Devore J.L., Berk K.N. Modern Mathematical Statistics with Applications
Подождите немного. Документ загружается.

The random deviation (random variable) e is assumed to be normally
distributed with mean value 0 and variance s
2
, and this mean value and
variance are the same regardless of the fixed x value. The n observed pairs
(x
1
, y
1
), (x
2
, y
2
), ...,(x
n
, y
n
) are regarded as having been generated indepen-
dently of each other from the model equation (first fix x ¼ x
1
and observe
Y
1
¼ b
0
+ b
1
x
1
+ e
1
, then fix x ¼ x
2
and observe Y
2
¼ b
0
+ b
1
x
2
+ e
2
, and
so on; assuming that the e’s are inde pendent of each other implies that the Y’s
are also).
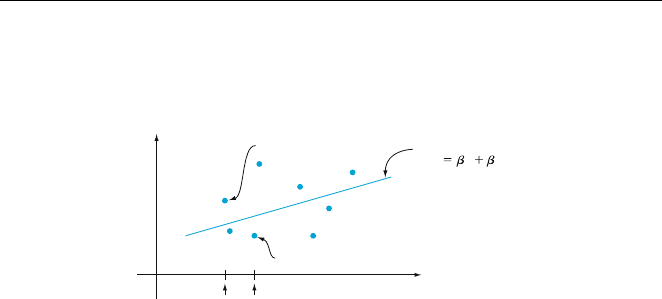
Figure 12.4 gives an illustration of data resulting from the simple linear regression
model.
The first two model parameters b
0
and b
1
are the coefficients of the popula-
tion or true regression line b
0
+ b
1
x. The slope parameter b
1
is now interpreted as
the expected or true average increase in Y associated with a 1-unit increase in x. The
variance parameter s
2
(or equivalently the standard deviation s) controls the
inherent amount of variability in the data. When s
2
is very close to 0, virtually
all of the (x
i
, y
i
) pairs in the sample should correspond to points quite close to the
population regression line. But if s
2
greatly exceeds 0, a number of points in the
scatter plot should fall far from the line. So the larger the value of s, the greater will
be the tendency for observed points to deviate from the population line by substan-
tial amounts. Roughly speaking, the magnitude of s is the size of a “typical”
deviation from the population line.
The following notation will help clarify implications of the model relat ion-
ship. Let x* denote a particular value of the independent variable x, and
m
Yx
¼ the expected i:e:; meanðÞvalue of Y when x ¼ x
s
2
Yx
¼ the variance of Y when x ¼ x
Alternative notation for these quantities is E(Y| x*) and V(Y| x*). For example, if
x ¼ applied stress (kg/mm
2
) and y ¼ time to fracture (h), then m
Y20
denotes the
expected time to fracture when applied stress is 20 kg/mm
2
. If we conceptualize an
entire population of (x, y) pairs resulting from applying stress to specimens, then
m
Y20
is the average of all values of the dependent variable for which x ¼ 20. The
variance s
2
Y20
describes the spread in the distribution of all y values for which
applied stress is 20.
y
x
x
1
x
2
⎧
⎨
⎩
⎧
⎨
⎩
(x
1
, y
1
)
(x
2
, y
2
)
True regression line
y
0 1
x
e
1
e
2
Figure 12.4 Points corresponding to observations from the simple linear
regression model
618
CHAPTER 12 Regression and Correlation
Now consider replacing x in the model equation by the fixed value x*. Then
the only randomness on the right-hand side is from the random deviation e.
Recalling that the mean value of a numerical constant is the numerical constant
and the variance of a constant is zero, we have that
m
Yx
¼ Eðb
0
þ b
1
x
þ eÞ¼b
0
þ b
1
x
þ EðeÞ¼b
0
þ b
1
x
s
2
Yx
¼ Vðb
0
þ b
1
x
þ eÞ¼Vðb
0
þ b
1
x
ÞþVðe Þ¼0 þ s
2
¼ s
2
The first sequence of equalities says that the mean value of Y when x ¼ x* is the
height of the population regression line above the value x*. That is, the population
regression line is the line of mean Y values—the mean Y value is a linear function of
the independent variable. The secon d sequence of equalities tells us that the amount
of variability in the distribution of Y is the same at any particular x value as it is at
any other x value—this is the property of homogeneous variation about the popu-
lation regression line. If the independent variable is age of a preschool child and the
dependent variable is the child’s vocabulary size, data suggests that the mean
vocabulary size increases linearly with age. However, there is more variability
in vocabulary size for 2-year-old children than for 4-year-old children, so there is
not constant variation in Y about the population line and the simple linear regres-
sion model is therefore not appropriate. The constant variance property implies that
points should spread out about the population regression line to the same extent
throughout the range of x values in the sample, rather than fanning out more as x
increases or as x decreases.
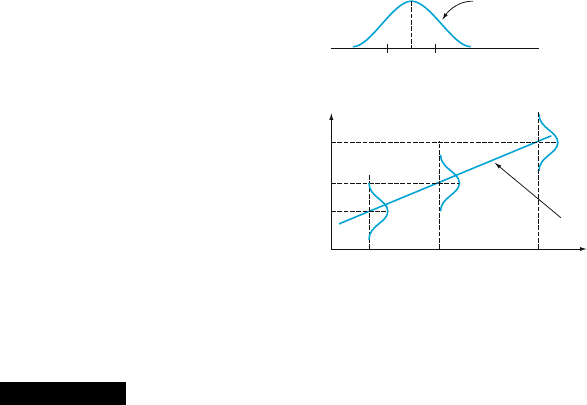
Also, the sum of a constant and a normally distributed variable is itself
normally distributed, and the addition of the constant affects only the mean value
and not the variance. So for any fixed value x*, Y ( ¼ b
0
+ b
1
x*+e) has a normal
distribution. The foregoing properties are summarized in Figure 12.5.
Example 12.3 Suppose the relationship between applied stress x and time-to-failure y is described
by the simple linear regression model with true regression line y ¼ 65 1.2x and
s ¼ 8. Then on average there is a 1.2-h decrease in time to rupture associated with
y
x
x
1
x
2
x
3
Line y = b
0
+ b
1
x
b
0
+ b
1
x
3
b
0
+ b
1
x
2
b
0
+ b
1
x
1
0
Normal, mean 0,
standard deviation s
a
b
s−s
Figure 12.5 (a) Distribution of
«
, (b) distribution of
Y
for different values of
x
12.1 The Simple Linear and Logistic Regression Models 619
an increase of 1 kg/mm
2
in applied stress. For any fixed value of x* of stress, time to
rupture is normally distributed with mean value 65 1.2x* and standar d deviation
8. Roughly speaking, in the population consisting of all (x, y) points, the magnitude
of a typical deviation from the true regression line is about 8. For x ¼ 20, Y has
mean value m
Y·20
¼ 65 1.2(20) ¼ 41, so
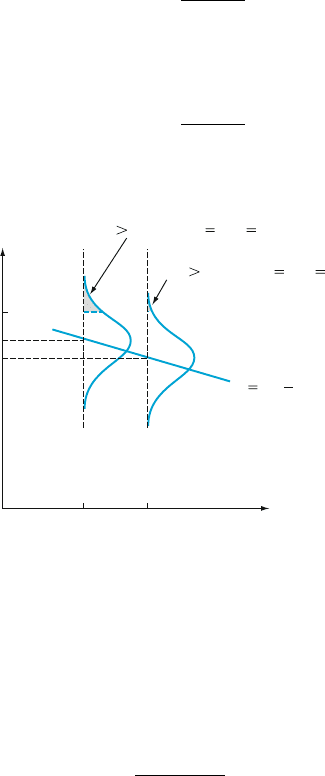
PðY > 50 when x ¼ 20Þ¼PZ>
50 41
8
¼ 1 Fð1:13Þ¼:1292
When applied stress is 25, m
Y·25
¼ 35, so the probability that time-to-failure
exceeds 50 is
PðY > 50 when x ¼ 25Þ¼PZ>
50 35
8
¼ 1 Fð1:88Þ¼:0301
These probabilities are illustrated as the shaded areas in Figure 12.6.
Suppose that Y
1
denotes an observation on time-to-failure mad e with x ¼ 25
and Y
2
denotes an independent observation made with x ¼ 24. Then the difference
Y
1
Y
2
is normally distributed with mean value E(Y
1
Y
2
) ¼ b
1
¼1.2, vari-
ance V(Y
1
Y
2
) ¼ s
2
+ s
2
¼ 128, and standard deviation
ffiffiffiffiffiffiffiffi
128
p
¼ 11:314. The
probability that Y
1
exceeds Y
2
is
PðY
1
Y
2
> 0Þ¼PZ>
0 ð1:2Þ
11:314
¼ PðZ >:11Þ¼:4562
That is, even though we expected Y to decrease when x increases by 1 unit, the
probability is fairly high (but less than .5) that the obser ved Y at x + 1 will be larger
than the observed Y at x.
■
The Logistic Regression Model
The simple linear regression model is appropriate for relating a quantitative
response variable y to a quantitative predictor x. Suppose that y is a dichotomous
variable with possible values 1 and 0 corresponding to success and failure.
20 25
x
y
50
41
35
P(Y
50 when x 20) .1292
P(Y
50 when x 25) .0301
True regression line
y
65 1.2x
Figure 12.6 Probabilities based on the simple linear regression model
620
CHAPTER 12 Regression and Correlation
Let p ¼ P(S) ¼ P(y ¼ 1). Frequently, the value of p will depend on the value of
some quantitative variable x. For example, the probability that a car needs warranty
service of a certain kind might well depend on the car’s mileage, or the probability
of avoiding an infection of a certain type might depend on the dosage in an
inoculation. Instead of using just the symbol p for the success probability, we
now use p(x) to emphasize the dependence of this probability on the value of x. The
simple linear regression equation Y ¼ b
0
+ b
1
x+e is no longer appropriate, for
taking the mean value on each side of the equation gives
m
Yx
¼ 1 pðxÞþ0 1 pðxÞ½¼pðx Þ¼b
0
þ b
1
x
Whereas p(x) is a probability and therefore must be between 0 and 1, b
0
+ b
1
x need
not be in this range.
Instead of letting the mean valu e of y be a linear function of x, we now
consider a model in which some function of the mean value of y is a linear function
of x. In other words, we allow p(x) to be a functi on of b
0
+ b
1
x rather than b
0
+ b
1
x
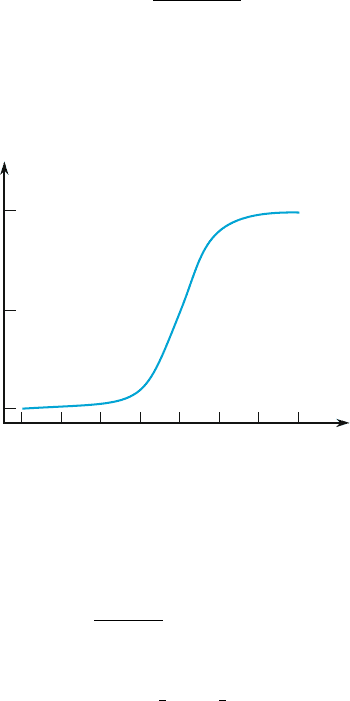
itself. A function that has been found quite useful in many applications is the logit
function
pðxÞ¼
e
b
0
þb
1
x
1 þ e
b
0
þb
1
x
Figure 12.7 shows a graph of p(x) for particular values of b
0
and b
1
with b
1
> 0.
As x increases, the probability of success increases. For b
1
negative, the success
probability would be a decreasing function of x.
Logistic regression means assuming that p(x) is related to x by the logit
function. Straigh tforward algebra shows that
pðxÞ
1 pðxÞ
¼ e
b
0
þb
1
x
The expression on the left-hand side is called the odds ratio. If, for example
p(60) ¼ 3/4, then pð60Þ=½1 pð60 Þ ¼
3
4
1
3
4
¼ 3 and when x ¼ 60 a success
10 20 30 40 50 60 70 80
0
.5
1.0
x
p(x)
Figure 12.7 A graph of a logit function
12.1 The Simple Linear and Logistic Regression Models 621

is three times as likely as a failure. This is described by saying that the odds are 3 to
1 becau se the success probability is three times the failure probability. Taking
natural logs of both sides, we see that the logarithm of the odds ratio is a linear
function of the predictor,
ln
pðxÞ
1 pðxÞ
¼ b
0
þ b
1
x
In particular, the slope parameter b
1
is the change in the log odds associated with a
1-unit increase in x. This implies that the odds ratio itself changes by the multipli-
cative factor e
b
1
when x increases by 1 unit.
Example 12.4 It seems reasonable that the size of a cancerous tumor should be related to the
likelihood that the cancer will spread (metast asize) to another site. The article
“Molecular Detection of p16 Promoter Methylation in the Serum of Patients with
Esophageal Squamous Cell Carcinoma” (Cancer Res., 2001: 3135–3138) investi-
gated the spread of esophageal cancer to the lymph nodes. With x ¼ size of a tumor
(cm) and Y ¼ 1 if the cancer does spread, consider the logistic regression model
with b
1
¼ .5 and b
0
¼2 (values suggested by data in the article). Then
pðxÞ¼
e
2þ:5x
1 þ e
2þ:5x
from which p(2) ¼ .27 and p(8) ¼ .88 (tumor sizes for patients in the study ranged
from 1.7 to 9.0 cm). Because e
2+.5(6.77)
4, the odds for a 6.77 cm tumor are 4,
so that it is four times as likely as not that a tumor of this size will spread to the
lymph nodes.
■
Exercises Section 12.1 (1–12)
1. The efficiency ratio for a steel specimen immersed
in a phosphating tank is the weight of the phos-
phate coating divided by the metal loss (both in
mg/ft
2
). The article “Statistical Process Control of
a Phosphate Coating Line” (Wire J. Internat., May
1997: 78–81) gave the accompanying data on tank
temperature (x) and efficiency ratio ( y).
Temp. 170 172 173 174 174 175 176
Ratio .84 1.31 1.42 1.03 1.07 1.08 1.04
Temp. 177 180 180 180 180 180 181
Ratio 1.80 1.45 1.60 1.61 2.13 2.15 .84
Temp. 181 182 182 182 182 184 184
Ratio 1.43 .90 1.81 1.94 2.68 1.49 2.52
Temp. 185 186 188
Ratio 3.00 1.87 3.08
a. Construct stem-and-leaf displays of both tem-
perature and efficiency ratio, and comment on
interesting features.
b. Is the value of efficiency ratio completely and
uniquely determined by tank temperature?
Explain your reasoning.
c. Construct a scatter plot of the data. Does it
appear that efficiency ratio could be very well
predicted by the value of temperature? Explain
your reasoning.
2. The article “Exhaust Emissions from Four-Stroke
Lawn Mower Engines” (J. Air Water Manage.
Assoc., 1997: 945–952) reported data from a
study in which both a baseline gasoline mixture
and a reformulated gasoline were used. Consider
the following observations on age (year) and NO
x
emissions (g/kWh):
Engine 12345
Age 002117
Baseline 1.72 4.38 4.06 1.26 5.31
Reformulated 1.88 5.93 5.54 2.67 6.53
Engine 678910
Age 16 9 0 12 4
Baseline .57 3.37 3.44 .74 1.24
Reformulated .74 4.94 4.89 .69 1.42
Construct scatter plots of NO
x
emissions versus
age. What appears to be the nature of the relation-
ship between these two variables? [Note: The
622
CHAPTER 12 Regression and Correlation
authors of the cited article commented on the
relationship.]
3. Bivariate data often arises from the use of two
different techniques to measure the same quantity.
As an example, the accompanying observations on
x ¼ hydrogen concentration (ppm) using a gas
chromatography method and y ¼ concentration
using a new sensor method were read from a
graph in the article “A New Method to Measure
the Diffusible Hydrogen Content in Steel Weld-
ments Using a Polymer Electrolyte-Based Hydro-
gen Sensor” (Welding Res., July 1997:
251s–256s).
x 47 62 65 70 70 78 95 100 114 118
y 38 62 53 67 84 79 93 106 117 116
x 124 127 140 140 140 150 152 164 198 221
y 127 114 134 139 142 170 149 154 200 215
Construct a scatter plot. Does there appear to be a
very strong relationship between the two types of
concentration measurements? Do the two methods
appear to be measuring roughly the same quan-
tity? Explain your reasoning.
4. A study to assess the capability of subsurface flow
wetland systems to remove biochemical oxygen
demand (BOD) and various other chemical con-
stituents resulted in the accompanying data on
x ¼ BOD mass loading (kg/ha/d) and y ¼ BOD
mass removal (kg/ha/d) (“Subsurface Flow Wet-
lands—A Performance Evaluation,” Water Envi-
ron. Res., 1995: 244–247).
x 3 8 10 11 13 16 27 30 35 37 38 44 103 142
y 4 7 8 8 10 11 16 26 21 9 31 30 75 90
a. Construct boxplots of both mass loading and
mass removal, and comment on any interesting
features.
b. Construct a scatter plot of the data, and com-
ment on any interesting features.
5. The article “Objective Measurement of the
Stretchability of Mozzarella Cheese” (J. Texture
Stud., 1992: 185–194) reported on an experiment
to investigate how the behavior of mozzarella
cheese varied with temperature. Consider the
accompanying data on x ¼ temperature and y ¼
elongation (%) at failure of the cheese. [Note: The
researchers were Italian and used real mozzarella
cheese, not the poor cousin widely available in the
United States.]
x 59 63 68 72 74 78 83
y 118 182 247 208 197 135 132
a. Construct a scatter plot in which the axes inter-
sect at (0, 0). Mark 0, 20, 40, 60, 80, and 100 on
the horizontal axis and 0, 50, 100, 150, 200,
and 250 on the vertical axis.
b. Construct a scatter plot in which the axes inter-
sect at (55, 100), as was done in the cited
article. Does this plot seem preferable to the
one in part (a)? Explain your reasoning.
c. What do the plots of parts (a) and (b) suggest
about the nature of the relationship between the
two variables?
6. One factor in the development of tennis elbow, a
malady that strikes fear in the hearts of all serious
tennis players, is the impact-induced vibration of
the racket-and-arm system at ball contact. It is
well known that the likelihood of getting tennis
elbow depends on various properties of the racket
used. Consider the scatter plot of x ¼ racket
resonance frequency (Hz) and y ¼ sum of peak-
to-peak acceleration (a characteristic of arm vibra-
tion, in m/s/s) for n ¼ 23 different rackets
(“Transfer of Tennis Racket Vibrations into the
Human Forearm,” Med. Sci. Sports Exercise,
1992: 1134–1140). Discuss interesting features
of the data and scatter plot.
x
100
y
38
36
34
32
30
28
26
22
24
180 190120110 130 140 160150 170
7. The article “Some Field Experience in the Use of
an Accelerated Method in Estimating 28-Day
Strength of Concrete” (J. Amer. Concrete Institut.,
1969: 895) considered regressing y ¼ 28-day
standard-cured strength (psi) against x ¼ acceler-
ated strength (psi). Suppose the equation of the
true regression line is y ¼ 1800 + 1.3x.
a. What is the expected value of 28-day strength
when accelerated strength ¼ 2500?
12.1 The Simple Linear and Logistic Regression Models 623

b. By how much can we expect 28-day strength to
change when accelerated strength increases by
1 psi?
c. Answer part (b) for an increase of 100 psi.
d. Answer part (b) for a decrease of 100 psi.
8. Referring to Exercise 7, suppose that the standard
deviation of the random deviation e is 350 psi.
a. What is the probability that the observed value
of 28-day strength will exceed 5000 psi when
the value of accelerated strength is 2000?
b. Repeat part (a) with 2500 in place of 2000.
c. Consider making two independent observa-
tions on 28-day strength, the first for an accel-
erated strength of 2000 and the second for
x ¼ 2500. What is the probability that the sec-
ond observation will exceed the first by more
than 1000 psi?
d. Let Y
1
and Y
2
denote observations on 28-day
strength when x ¼ x
1
and x ¼ x
2
, respectively.
By how much would x
2
have to exceed x
1
in
order that P(Y
2
> Y
1
) ¼ .95?
9. The flow rate y (m
3
/min) in a device used for air-
quality measurement depends on the pressure drop
x (in. of water) across the device’s filter. Suppose
that for x values between 5 and 20, the two vari-
ables are related according to the simple linear
regression model with true regression line
y ¼.12 + .095x.
a. What is the expected change in flow rate asso-
ciated with a 1-in. increase in pressure drop?
Explain.
b. What change in flow rate can be expected
when pressure drop decreases by 5 in.?
c. What is the expected flow rate for a pressure
drop of 10 in.? A drop of 15 in.?
d. Suppose s ¼ .025 and consider a pressure
drop of 10 in. What is the probability that the
observed value of flow rate will exceed .835?
That observed flow rate will exceed .840?
e. What is the probability that an observation on
flow rate when pressure drop is 10 in. will
exceed an observation on flow rate made
when pressure drop is 11 in.?
10. Suppose the expected cost of a production run is
related to the size of the run by the equation
y ¼ 4000 + 10x. Let Y denote an observation on
the cost of a run. If the variables size and cost are
related according to the simple linear regression
model, could it be the case that P(Y > 5500 when
x ¼ 100) ¼ .05 and P(Y > 6500 when x ¼ 200)
¼ .10? Explain.
11. Suppose that in a certain chemical process the
reaction time y (hr) is related to the temperature
(
F) in the chamber in which the reaction takes
place according to the simple linear regression
model with equation y ¼ 5.00 .01x and
s ¼ .075.
a. What is the expected change in reaction time
for a 1
F increase in temperature? For a 10
F
increase in temperature?
b. What is the expected reaction time when tem-
perature is 200
F? When temperature is
250
F?
c. Suppose five observations are made indepen-
dently on reaction time, each one for a temper-
ature of 250
F. What is the probability that all
five times are between 2.4 and 2.6 h?
d. What is the probability that two independently
observed reaction times for temperatures 1
apart are such that the time at the higher tem-
perature exceeds the time at the lower temper-
ature?
12. In Example 12.4 the probability of cancer metas-
tasizing was pðxÞ¼e
2þ:5x
= 1 þe
2þ:5x
.
a. Tabulate values of x, p(x), the odds
pðxÞ= 1 pðxÞ½, and the log odds
for x ¼0; 1; 2; 3; ...; 10
b. Explain what happens to the odds when x is
increased by 1. Your explanation should
involve the .5 that appears in the formula
for p(x).
c. Support your answer to (b) algebraically, start-
ing from the formula for p(x).
d. For what value of x are the odds 1? 5? 10?
12.2
Estimating Model Parameters
We will assume in this and the next several sections that the variables x and y are
related according to the simple linear regression model. The values of b
0
, b
1
, and
s
2
will almost never be known to an investigator. Instead, sample data consisting of
n observed pairs (x
1
, y
1
), ...,(x
n
, y
n
) will be available, from which the model
parameters and the true regression line itself can be estimated. These observations
624 CHAPTER 12 Regression and Correlation
are assumed to have been obtained independently of each other. That is, y
i
is
the observed value of an rv Y
i
, where Y
i
¼ b
0
þ b
1
x
i
þ e
i
and the n deviations
e
1
, e
2
, ..., e
n
are independent rv’s. Independence of Y
1
, Y
2
, ..., Y
n
follows from
the independence of the e
i
’s.
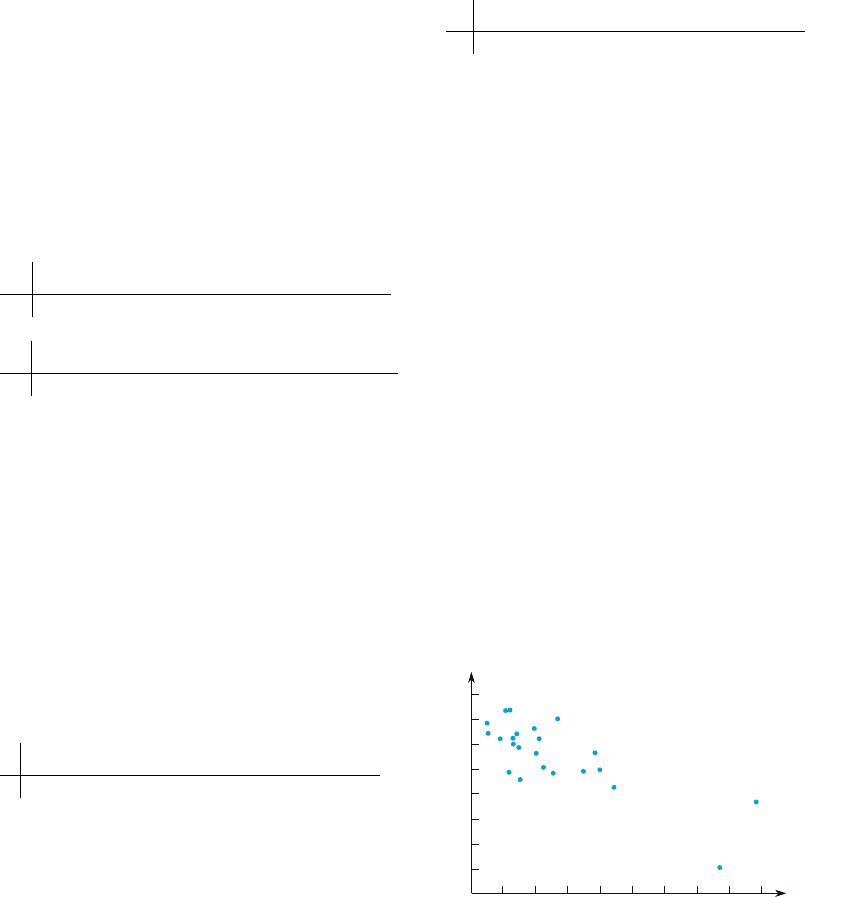
According to the model, the observed points will be distributed about the true
regression line in a random manner. Figure 12.8 shows a typical plot of observed
pairs along with two candidates for the estimated regression line, y ¼
a
0
+
a
1
x and
y ¼ b
0
+ b
1
x. Intuitively, the line y ¼
a
0
+
a
1
x is not a reasonable estimate of the
true line y ¼ b
0
+ b
1
x because, if y ¼
a
0
+
a
1
x were the true line, the observed
points would almost surely have been closer to this line. The line y ¼ b
0
+b
1
x is a
more plausible estimate because the observed points are scattered rather closely
about this line.
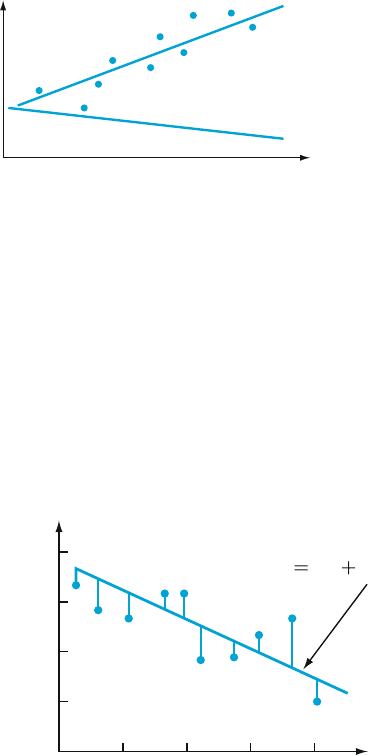
Figure 12.8 and the foregoing discussion suggest that our estimate of y ¼
b
0
+ b
1
x should be a line that provides in some sense a best fit to the observed data
points. This is what motivates the principle of least squares, which can be traced
back to the mathematicians Gauss and Legendre around the year 1800. According
to this principle, a line provides a good fit to the data if the vertical distances
(deviations) from the observed points to the line are small (see Figure 12.9). The
measure of the goodness-of-fit is the sum of the squares of these deviations. The
best-fit line is then the one having the smallest possible sum of squared deviations.
x
y
y
=
a
0
+
a
1
x
y
=
b
0
+
b
1
x
Figure 12.8 Two different estimates of the true regression line
10 20 30 40
20
40
60
80
y b
0
b
1
x
Applied stress (kg/mm
2
)
Time to failure (hr)
y
x
Figure 12.9 Deviations of observed data from line
y ¼ b
0
+
b
1
x
12.2 Estimating Model Parameters 625

PRINCIPLE
OF LEAST
SQUARES
The vertical deviation of the point (x
i
, y
i
) from the line y ¼ b
0
+ b
1
x is
height of point height of line ¼ y
i
ðb
0
þ b
1
x
i
Þ
The sum of squared vertical deviations from the points (x
1
, y
1
), ...,(x
n
, y
n
)to
the line is then
f ð b
0
; b
1
Þ¼
X
n
i ¼1
½y
i
ðb
0
þ b
1
x
i
Þ
2
The point estimates of b
0
and b
1
, denoted by
^
b
0
and
^
b
1
and called the least
squares estimates, are those values that minimize f(b
0
, b
1
). That is,
^
b
0
and
^
b
1
are such that f ð
^
b
0
;
^
b
1
Þf ðb
0
; b
1
Þ for any b
0
and b
1
.Theestimated regres-
sion line or least squares line is then the line whose equation is y ¼
^
b
0
þ
^
b
1
x.
The minimizing values of b
0
and b
1
are found by taking partial derivatives of
f(b
0
, b
1
) with respect to both b
0
and b
1
, equating them both to zero [analogously to
f
0
(b) ¼ 0 in univariate calculus], and solving the equations
@f ðb
0
; b
1
Þ
@b
0
¼
X
2ðy
i
b
0
b
1
x
i
Þð1Þ¼0
@f ðb
0
; b
1
Þ
@b
1
¼
X
2ðy
i
b
0
b
1
x
i
Þðx
i
Þ¼0
Cancellation of the factor 2 and rearrangement gives the following system of
equations, called the normal equations:
nb
0
þ
X
x
i
b
1
¼
X
y
i
X
x
i
b
0
þ
X
x
2
i
b
1
¼
X
x
i
y
i
The normal equations are linear in the two unknowns b
0
and b
1
. Provided that at
least two of the x
i
’s are different, the least squares estimates are the unique solution
to this system.
The least squares estimate of the slope coefficient b
1
of the true regression
line is
b
1
¼
^
b
1
¼
P
ðx
i
xÞðy
i
yÞ
P
ðx
i
xÞ
2
¼
S
xy
S
xx
ð12:2Þ
Computing formulas for the numerator and denominator of b
1
are
S
xy
¼
X
x
i
y
i
P
x
i
ðÞ
P
y
i
ðÞ
n
S
xx
¼
X
x
2
i
P
x
i
ðÞ
2
n
626 CHAPTER 12 Regression and Correlation

(the S
xx
formula was derived in Chapter 1 in connection with the sam ple
variance, and the derivation of the S
xy
formula is similar).
The least squares estimate of the intercept b
0
ofthetrueregressionlineis
b
0
¼
^
b
0
¼
P
y
i
^
b
1
P
x
i
n
¼
y
^
b
1
x ð12:3Þ
Because of the normality assumption,
^
b
0
and
^
b
1
are also the maximum
likelihood estimates (see Exercise 23).
The computational formulas for S
xy
and S
xx
require only the summary statistics Sx
i
,
Sy
i
, Sx
2
i
; Sx
i
y
i
(Sy
2
i
will be neede d shortly); the x and y deviations are then not
needed. In computing
^
b
0
, use extra digits in
^
b
1
because, if x is large in magnitude,
rounding may affect the final answer. We emphasize that before
^
b
1
and
^
b
0
are
computed, a scatter plot should be exam ined to see whether a linear probabilistic
model is plausible. If the points do not tend to cluster about a straight line with
roughly the same degree of spread for all x, other models should be investigated. In
practice, plots and regression calculations are usually done by using a statistical
computer package.
Example 12.5 Global warming is a major issue, and CO
2
emissions are an important part of the
discussion. What is the effect of increased CO
2
levels on the environment? In
particular, what is the effect of these higher levels on the growth of plants and trees?
The article “Effects of Atmospheric CO
2
Enrichment on Biomass Accumulation
and Distribution in Eldarica Pine Trees” (J. Exp. Bot., 1994: 345–349) describes the
results of growing pine trees with increasing levels of CO
2
in the air. There were
two trees at each of four levels of CO
2
concentration, and the mass of each tree was
measured after 11 months of the experiment. Here are the observations with x ¼
atmospheric concentration of CO
2
in microliters per liter (parts per million) and
y ¼ mass in kilograms, along with x
2
, xy and y
2
. The mass measurements were read
from a graph in the article.
Obs xy x
2
xy y
2
1 408 1.1 166,464 448.8 1.21
2 408 1.3 166,464 530.4 1.69
3 554 1.6 306,916 886.4 2.56
4 554 2.5 306,916 1385.0 6.25
5 680 3.0 462,400 2040.0 9.00
6 680 4.3 462,400 2924.0 18.49
7 812 4.2 659,344 3410.4 17.64
8 812 4.7 659,344 3816.4 22.09
Sum 4908 22.7 3,190,248 15,441.4 78.93
12.2 Estimating Model Parameters 627