Devore J.L., Berk K.N. Modern Mathematical Statistics with Applications
Подождите немного. Документ загружается.


The joint CIs are referred to as Bon ferroni intervals. The method is easily
generalized to yield joint intervals for k different m
Yx
’s. Using the interval (12.7)
separately first for x ¼ x
1
then for x ¼ x
2
; ..., and finally for x ¼ x
k
yields a set of k
CIs for which the joint or simultaneous confidence level is guaranteed to be at least
100(1 ka)%.
Tests of hypotheses about b
0
+ b
1
x* are based on the test statistic T obtained
by replacing b
0
+ b
1
x* in the numerator of (12.6) by the null value m
0
. For example,
the assertion H
0
: b
0
+ b
1
(1200) ¼ 75 in Example 12.15 says that when the average
SAT is 1200, expected (i.e., true average) graduation rate is 75%. The test statistic
value is then t ¼½
^
b
0
þ
^
b
1
1200ðÞ75=s
^
b
0
þ
^
b
1
ð1200Þ
, and the test is upper-, lower-, or
two-tailed according to the inequality in H
a
.
A Prediction Interval for a Future Value of Y
Analogous to the CI (12.7) for m
Yx
, one frequently wishes to obtain an interval of
plausible values for the value of Y associated with some future observation when
the independent variable has value x*. In the scenario of Example 12.5, the CI
(12.7) can be used to provide an interval estimate of true average tree mass for all
trees exposed to CO
2
concentration x ¼ 600. Alternatively, we might wish an
interval of plausible values for the mass of a single such tree.
A CI refers to a parameter, or population characteristic, whose value is fixed
but unknown to us. In contrast, a future value of Y is not a parameter but instead a
random variabl e; for this reason we refer to an interval of plausible values for a
future Y as a prediction interval rather than a confidence interval. For the
confidence interval we use the error of estimation, b
0
þ b
1
x
ð
^
b
0
þ
^
b
1
x
Þ,a
difference between a fixed (but unknown) quantity and a random variable. The
error of prediction is Y ð
^
b
0
þ
^
b
1
x
Þ¼b
0
þ b
1
x
þ e ð
^
b
0
þ
^
b
1
x
Þ, a difference
between two random variables. With the additional random e term, there is more
uncertainty in prediction than in estimation, so a PI will be wider than a CI. Because
the future value Y is independent of the observed Y
i
’s,
V½Y ð
^
b
0
þ
^
b
1
x
Þ ¼ variance of prediction error
¼ VðYÞþVð
^
b
0
þ
^
b
1
x
Þ
¼ s
2
þ s
2
1
n
þ
ðx
xÞ
2
S
xx
"#
¼ s
2
1 þ
1
n
þ
ðx
xÞ
2
S
xx
"#
Furthermore, because EðYÞ¼b
0
þ b
1
x
and Eð
^
b
0
þ
^
b
1
x
Þ¼b
0
þ b
1
x
, the
expected value of the prediction error is E½Y ð
^
b
0
þ
^
b
1
x
Þ ¼ 0. It can then be
shown that the standardized variable
T ¼
Y ð
^
b
0
þ
^
b
1
x
Þ
S
ffiffiffiffiffiffiffiffiffiffiffiffiffiffiffiffiffiffiffiffiffiffiffiffiffiffiffiffiffiffiffiffiffiffiffi
1 þ
1
n
þ
ðx
xÞ
2
S
xx
s
658 CHAPTER 12 Regression and Correlation

has a t distribution with n 2 df. Substituting this T into the probability statement
P(t
a/2,n2
< T < t
a/2,n2
) ¼ 1 a and manipulating to isolate Y between the two
inequalities yields the following interval.
A 100(1 a )% PI for a future Y observation to be made when x ¼ x* is
^
b
0
þ
^
b
1
x
t
a=2;n2
s
ffiffiffiffiffiffiffiffiffiffiffiffiffiffiffiffiffiffiffiffiffiffiffiffiffiffiffiffiffiffiffiffiffiffiffi
1 þ
1
n
þ
ðx
xÞ
2
S
xx
s
¼
^
b
0
þ
^
b
1
x
t
a=2;n2
ffiffiffiffiffiffiffiffiffiffiffiffiffiffiffiffiffiffiffiffiffiffiffi
s
2
þ s
2
^
b
0
þ
^
b
1
x
q
¼
^
y t
a=2;n2
ffiffiffiffiffiffiffiffiffiffiffiffiffiffi
s
2
þ s
2
^
Y
q
ð12:8Þ
The interpretation of the predict ion level 100(1 a)% is identical to that of
previous confidence levels—if (12.8) is used repeatedly, in the long run the
resulting intervals will actually contain the observed y values 100(1 a)% of the
time. Notice that the 1 underneath the initial square root symbol makes the PI (12.8)
wider than the CI (12.7), although the intervals are both centered at
^
b
0
þ
^
b
1
x
. Also,
as n !1the width of the CI approaches 0, whereas the width of the PI approaches
2z
a/2
s (because even with perfect knowledge of b
0
and b
1
, there will still be
uncertainty in prediction).
Example 12.16 Let’s return to the university data of Example 12.15 and calculate a 95% prediction
interval for a graduation rate that would result from selecting a single university
whose average SAT is 1200. Re levant quantities from that example are
^
y ¼ 70:07 s
^
Y
¼ 2:731 s ¼ 10:29
For a prediction level of 95% based on n 2 ¼ 18 df, the t critical value is 2.101,
exactly what we previously used for a 95% confidence level. The prediction
interval is then
70:07 ð2:101Þ
ffiffiffiffiffiffiffiffiffiffiffiffiffiffiffiffiffiffiffiffiffiffiffiffiffiffiffiffiffiffiffiffi
10:29
2
þ 2:731
2
p
¼ 70:07 2:101ðÞ10:646ðÞ
¼ 70:07 22:37 ¼ 47:70; 92:44ðÞ
Plausible values for a single observation on graduation rate when SAT is 1200 are
(at the 95% prediction level) between 47.70% and 92.44%. The 95% confidence
interval for graduation rate when SAT is 120 was (64.33, 75.81). The prediction
interval is much wider than this because of the extra 10.29
2
under the square root.
Figure 12.22, the MINITAB outpu t for Example 12.15, shows this interval as well
as the confidence interval.
■
The Bonferroni technique can be employed as in the case of confidence
intervals. If a PI with prediction level 100(1 a)% is calculated for each of k
different values of x, the simultaneous or joint prediction level for all k intervals is
at least 100(1 ka)%.
12.4 Inferences Concerning m
Y x
and the Prediction of Future Y Values 659

Exercises Section 12.4 (45–55)
45. Recall Example 12.5 and Example 12.6 of Sec-
tion 12.2, where the simple linear regression
model was applied to 8 observations on x ¼ CO
2
concentration and y ¼ mass in kilograms of pine
trees at age 11 months. Further calculations give
s ¼ .534 and
^
y ¼ 2:723, s
^
Y
¼ :190 when
x ¼ 600, and
^
y ¼ 3:992, s
^
Y
¼ :256 when
x ¼ 750.
a. Explain why s
^
Y
is larger when x ¼ 750 than
when x ¼ 600.
b. Calculate a confidence interval with a confi-
dence level of 95% for the true average mass
of all trees grown with a CO
2
concentration of
600 parts per million.
c. Calculate a prediction interval with a predic-
tion level of 95% for the mass of a tree grown
with a CO
2
concentration of 600 parts per
million.
d. If a 95% CI is calculated for the true average
mass when CO
2
concentration is 750, what
will be the simultaneous confidence level for
both this interval and the interval calculated
in part (b)?
46. Reconsider the filtration rate–moisture content
data introduced in Example 12.7 (see also Exam-
ple 12.8).
a. Compute a 90% CI for b
0
+ 125b
1
, true aver-
age moisture content when the filtration rate
is 125.
b. Predict the value of moisture content for a
single experimental run in which the filtration
rate is 125 using a 90% prediction level. How
does this interval compare to the interval of
part (a)? Why is this the case?
c. How would the intervals of parts (a) and (b)
compare to a CI and PI when filtration rate is
115? Answer without actually calculating
these new intervals.
d. Interpret both H
0
: b
0
+ 125b
1
¼ 80 and
H
a
: b
0
+ 125b
1
< 80, and then carry out a
test at significance level .01.
47. Astringency is the quality in a wine that makes
the wine drinker’s mouth feel slightly rough, dry,
and puckery. The paper “Analysis of Tannins in
Red Wine Using Multiple Methods: Correlation
with Perceived Astringency” (Amer. J. Enol.
Vitic., 2006: 481–485) reported on an investiga-
tion to assess the relationship between perceived
astringency and tannin concentration using vari-
ous analytic methods. Here is data provided by
the authors on x ¼ tannin concentration by pro-
tein precipitation and y ¼ perceived astringency
as determined by a panel of tasters.
x 0.718 0.808 0.924 1.000 0.667 0.529 0.514 0.559
y 0.428 0.480 0.493 0.978 0.318 0.298 0.224 0.198
x 0.766 0.470 0.726 0.762 0.666 0.562 0.378 0.779
y 0.326 0.336 0.765 0.190 0.066 0.221 0.898 0.836
x 0.674 0.858 0.406 0.927 0.311 0.319 0.518 0.687
y 0.126 0.305 0.577 0.779 0.707 0.610 0.648 0.145
x 0.907 0.638 0.234 0.781 0.326 0.433 0.319 0.238
y 1.007 0.090 1.132 0.538 1.098 0.581 0.862 0.551
Relevant summary quantities are as follows:
X
x
i
¼ 19:404;
X
y
i
¼:549;
X
x
2
i
¼ 13:248032;
X
y
2
i
¼ 11:835795;
X
x
i
y
i
¼ 3:497811
S
xx
¼ 13:248032 ð19:404Þ
2
=32 ¼ 1:48193150;
S
yy
¼ 11:82637622
S
xy
¼ 3:497811 ð19:404Þð:549Þ=32 ¼ 3:83071088
a. Fit the simple linear regression model to this
data. Then determine the proportion of
observed variation in astringency that can be
attributed to the model relationship between
astringency and tannin concentration.
b. Calculate and interpret a confidence interval
for the slope of the true regression line.
c. Estimate true average astringency when tan-
nin concentration is .6, and do so in a way that
conveys information about reliability and pre-
cision.
d. Predict astringency for a single wine sample
whose tannin concentration is .6, and do so in
a way that conveys information about reliabil-
ity and precision.
e. Is there compelling evidence for concluding
that true average astringency is positive when
tannin concentration is .7? State and test the
appropriate hypotheses.
48. The simple linear regression model provides a
very good fit to the data on rainfall and runoff
volume given in Exercise 17 of Section 12.2. The
equation of the least squares line is
^
y ¼1:128 þ :82697x, r
2
¼ :975, and s ¼ 5:24.
a. Use the fact that s
^
Y
¼ 1:44 when rainfall
volume is 40 m
3
to predict runoff in a way
660
CHAPTER 12 Regression and Correlation

that conveys information about reliability and
precision. Does the resulting interval suggest
that precise information about the value of
runoff for this future observation is available?
Explain your reasoning.
b. Calculate a PI for runoff when rainfall is 50
using the same prediction level as in part (a).
What can be said about the simultaneous pre-
diction level for the two intervals you have
calculated?
49. You are told that a 95% CI for expected lead
content when traffic flow is 15, based on a sam-
ple of n ¼ 10 observations, is (462.1, 597.7).
Calculate a CI with confidence level 99% for
expected lead content when traffic flow is 15.
50. Refer to Exercise 21 in which x ¼ available
travel space in feet and y ¼ separation distance
in feet between a bicycle and a passing car.
a. MINITAB gives s
^
b
0
þ
^
b
1
ð15Þ
¼ :186 and
s
^
b
0
þ
^
b
1
ð20Þ
¼ :360. Explain why one is much
larger than the other.
b. Calculate a 95% CI for expected separation
distance when available travel space is 15 ft.
(Use s
^
b
0
þ
^
b
1
ð15Þ
¼ :186.)
c. Calculate a 95% PI for a single instance of
separation distance when available travel
space is 20 ft. (Use s
^
b
0
þ
^
b
1
ð20Þ
¼ :360.)
51. Plasma etching is essential to the fine-line pat-
tern transfer in current semiconductor processes.
The article “Ion Beam-Assisted Etching of Alu-
minum with Chlorine” (J. Electrochem. Soc.,
1985: 2010–2012) gives the accompanying data
(read from a graph) on chlorine flow (x,in
SCCM) through a nozzle used in the etching
mechanism and etch rate (y, in 100 A/min).
x 1.5 1.5 2.0 2.5 2.5 3.0 3.5 3.5 4.0
y 23.0 24.5 25.0 30.0 33.5 40.0 40.5 47.0 49.0
The summary statistics are
P
x
i
¼ 24:0,
P
y
i
¼ 312:5,
P
x
2
i
¼ 70:50,
P
x
i
y
i
¼902:25;
P
y
2
i
¼11;626:75,
^
b
0
¼6:448718,
^
b
1
¼
10:602564.
a. Does the simple linear regression model spec-
ify a useful relationship between chlorine
flow and etch rate?
b. Estimate the true average change in etch rate
associated with a 1-SCCM increase in flow
rate using a 95% confidence interval, and
interpret the interval.
c. Calculate a 95% CI for m
Y·3.0
, the true average
etch rate when flow ¼ 3.0. Has this average
been precisely estimated?
d. Calculate a 95% PI for a single future obser-
vation on etch rate to be made when flow
¼ 3.0. Is the prediction likely to be accurate?
e. Would the 95% CI and PI when flow ¼ 2.5 be
wider or narrower than the corresponding
intervals of parts (c) and (d)? Answer without
actually computing the intervals.
f. Would you recommend calculating a 95% PI
for a flow of 6.0? Explain.
g. Calculate simultaneous CI’s for true average
etch rate when chlorine flow is 2.0, 2.5, and
3.0, respectively. Your simultaneous confi-
dence level should be at least 97%.
52. Consider the following four intervals based on
the data of Exercise 20 (Section 12.2):
a. A 95% CI for lichen nitrogen when NO
3
is .5
b. A 95% PI for lichen nitrogen when NO
3
is .5
c. A 95% CI for lichen nitrogen when NO
3
is .8
d. A 95% PI for lichen nitrogen when NO
3
is .8
e. Without computing any of these intervals,
what can be said about their widths relative
to each other?
53. The decline of water supplies in certain areas of
the United States has created the need for
increased understanding of relationships
between economic factors such as crop yield
and hydrologic and soil factors. The article
“Variability of Soil Water Properties and Crop
Yield in a Sloped Watershed” (Water Resources
Bull., 1988: 281–288) gives data on grain sor-
ghum yield (y, in g/m-row) and distance upslope
(x, in m) on a sloping watershed. Selected obser-
vations are given in the accompanying table.
x 0 102030455070
y 500 590 410 470 450 480 510
x 80 100 120 140 160 170 190
y 450 360 400 300 410 280 350
a. Construct a scatter plot. Does the simple lin-
ear regression model appear to be plausible?
b. Carry out a test of model utility.
c. Estimate true average yield when distance
upslope is 75 by giving an interval of plausi-
ble values.
12.4 Inferences Concerning m
Y x
and the Prediction of Future Y Values 661

54. Infestation of crops by insects has long been of
great concern to farmers and agricultural scien-
tists. The article “Cotton Square Damage by the
Plant Bug, Lygus hesperus, and Abscission Rates”
(J. Econ. Entomol., 1988: 1328–1337) reports data
on x ¼ age of a cotton plant (days) and y ¼ %
damaged squares. Consider the accompanying
n ¼ 12 observations (read from a scatter plot in
the article).
x 9 1212151818
y 11 12 23 30 29 52
x 21 21 27 30 30 33
y 41 65 60 72 84 93
a. Why is the relationship between x and y not
deterministic?
b. Does a scatter plot suggest that the simple
linear regression model will describe the rela-
tionship between the two variables?
c. The summary statistics are
P
x
i
¼ 246,
P
x
2
i
¼ 5742,
P
y
i
¼ 572,
P
y
2
i
¼ 35;634
and
P
x
i
y
i
¼ 14;022. Determine the equation
of the least squares line.
d. Predict the percentage of damaged squares
when the age is 20 days by giving an interval
of plausible values.
55. Verify that Vð
^
b
0
þ
^
b
1
xÞ is indeed given by
the expression in the text. [Hint:
Vð
P
d
i
Y
i
Þ¼
P
d
2
i
VðY
i
Þ.]
12.5
Correlation
In many situations the objective in studying the joint behavior of two variables is to
see whether they are related, rather than to use one to predict the value of the other.
In this section, we first develop the sample correlation coefficient r as a measure of
how strongly related two variables x and y are in a sample and then relate r to the
correlation coefficient r defined in Chapter 5.
The Sample Correlation Coefficient r
Given n pairs of observations (x
1
, y
1
), (x
2
, y
2
), ...,(x
n
, y
n
), it is natural to speak of x
and y having a positive relationship if large x’s are paired with large y’s and small
x’s with small y’s. Similarly, if large x’s are paired with small y’s and small x’s with
large y’s, then a negative relationship between the variables is implied. Consider
the quantity
S
xy
¼
X
n
i¼1
ðx
i
xÞðy
i
yÞ¼
X
n
i¼1
x
i
y
i
P
n
i¼1
x
i
P
n
i¼1
y
i
n
Then if the relationship is strongly positive, an x
i
above the mean x will tend to be
paired with a y
i
above the mean y, so that ðx
i
xÞðy
i
yÞ > 0, and this product will
also be positive whenever both x
i
and y
i
are below their respective means. Thus a
positive relationship implies that S
xy
will be positive. An analogous argument
shows that when the relationship is negative, S
xy
will be negative, since most of
the products ðx
i
xÞðy
i
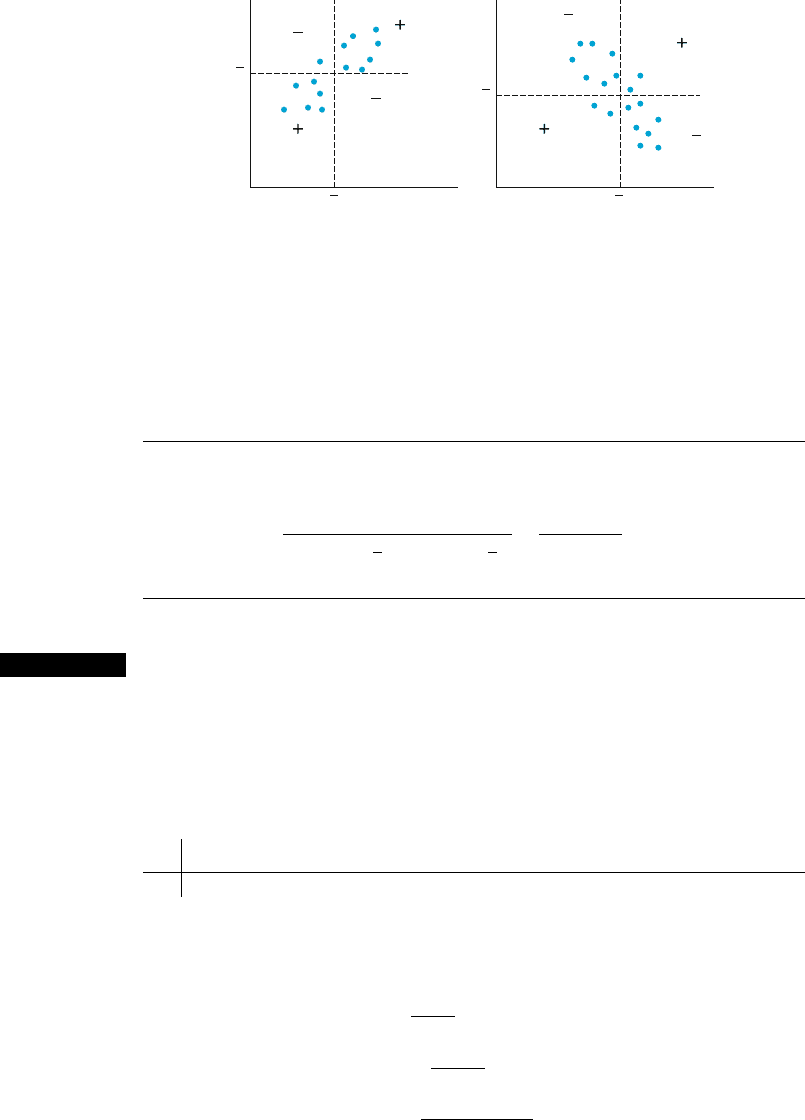
yÞ will be negative. This is illustrated in Figure 12.23 .
Although S
xy
seems a plausible measure of the strength of a relationship, we
do not yet have any idea of how positive or negative it can be. Unfortunately, S
xy
has a serious defect: By changi ng the unit of measurement for either x or y, S
xy
can
be made either arbitrarily large in magnitu de or arbitrarily close to zero. For
example, if S
xy
¼ 25 when x is measured in meters, then S
xy
¼ 25,000 when x is
662 CHAPTER 12 Regression and Correlation
measured in millimeters and .025 when x is expressed in kilometers. A reasonable
condition to impose on any measure of how strongly x and y are related is that the
calculated measure should not depend on the particular unit used to measure them. This
condition is achieved by modifying S
xy
to obtain the sample correlation coefficient.
DEFINITION
The sample correlation coefficient for the n pairs (x
1
, y
1
), ...,(x
n
, y
n
)is
r ¼
S
xy
ffiffiffiffiffiffiffiffiffiffiffiffiffiffiffiffiffiffiffiffiffiffiffi
P
ðx
i
xÞ
2
q ffiffiffiffiffiffiffiffiffiffiffiffiffiffiffiffiffiffiffiffiffiffiffi
P
ðy
i
yÞ
2
q
¼
S
xy
ffiffiffiffiffiffi
S
xx
p
ffiffiffiffiffiffi
S
yy
p
ð12:9Þ
Example 12.17 An accurate assessment of soil productivity is critical to rational land-use planning.
Unfortunately, as the author of the article “Productivity Ratings Based on Soil Series”
(Prof. Geographer, 1980: 158–163) argues, an acceptable soil productivity index is not
so easy to come by. One difficulty is that productivity is determined partly by which
crop is planted, and the relationship between yield of two different crops planted in the
same soil may not be very strong. To illustrate, the article presents the accompanying
data on corn yield x and peanut yield y (mT/ha) for eight different types of soil.
x 2.4 3.4 4.6 3.7 2.2 3.3 4.0 2.1
y 1.33 2.12 1.80 1.65 2.00 1.76 2.11 1.63
With
P
x
i
¼ 25:7,
P
y
i
¼ 14:40,
P
x
2
i
¼ 88:31,
P
x
i
y
i
¼ 46:856,
P
y
2
i
¼
26:4324,
S
xx
¼ 88:31
25:7
2
8
¼ 88:31 82:56 ¼ 5:75
S
yy
¼ 26:4324
14:40
2
8
¼ :5124
S
xy
¼ 46:856
ð25:7Þð14:40Þ
8
¼ :5960
x x
y
y
ab
Figure 12.23 (a) Scatter plot with S
xy
positive; (b) scatter plot with S
xy
negative
[+ means ðx
i
xÞðy
i
yÞ > 0, and means ðx
i
xÞðy
i
yÞ < 0]
12.5 Correlation 663

from which
r ¼
:5960
ffiffiffiffiffiffiffiffiffi
5:75
p ffiffiffiffiffiffiffiffiffiffiffi
:5124
p
¼ :347
■
Properties of r
The most important properties of r are as follows:
1. Th e value of r does not depend on which of the two variables is labeled x and
which is labeled y.
2. Th e value of r is independent of the units in which x and y are measured.
3. 1 r 1
4. r ¼ 1 if and only if (iff) all (x
i
, y
i
) pairs lie on a straight line with positive slope,
and r ¼1 iff all (x
i
, y
i
) pairs lie on a straight line with negative slope.
5. Th e square of the sample correlation coefficient gives the value of the
coefficient of determination that woul d result from fitting the simple linear
regression model—in symbols, (r)
2
¼ r
2
.
Property 1 should be evident. Exercise 66 asks you to verify Property 2. To
derive Property 5, recall the regression analysis of variance identity (12.4),
[SST ¼ SSE þ SSR ¼ SSE þ
P
ð
^
y
i
yÞ
2
]. It is easily shown [Exercise 24(b)]
that
^
y
i
y ¼
^
b
1
ðx
i
xÞ, and therefore
X
ð
^
y
i
yÞ
2
¼
^
b
2
1
X
ðx
i
xÞ
2
¼
P
ðx
i
xÞðy
i
yÞ
P
ðx
i
xÞ
2
"#
2
X
ðx
i
xÞ
2
¼
P
ðx
i
xÞðy
i
yÞ½
2
P
ðx
i
xÞ
2
P
ðy
i
yÞ
2
X
ðy
i
yÞ
2
¼ðrÞ
2
SST
Here (r)
2
is the square of the correlation coefficient. Substituting this result into the
identity (12.4) gives SST ¼ SSE + (r)
2
SST, so (r)
2
¼ (SST SSE)/SST, com-
pleting the derivation of Property 5.
Because (r)
2
¼ (SST SSE)/SST, and the numerator cannot be bigger than
the denominator, Property 3 follows immediately. Furthermore, because the ratio
can be 1 if and only if SSE ¼ 0, we conclude that r
2
¼ 1 if and only if all the points
fall on a straight line. If the correlation is positive this will be a line with positive
slope, and if the correlation is negative it will be a line with negative slope, so we
have verified Property 4.
Property 1 stands in marked contrast to what happens in regress ion analysis,
where virtually all quantities of interest (the estimated slope, estimated y-intercept,
s
2
, etc.) depend on which of the two variables is treated as the depend ent variable.
However, Property 5 shows that the proportion of variation in the dependent
variable explained by fitting the simple linear regression model does not depend
on which variable plays this role.
Property 2 is equivalent to saying that r is unchanged if each x
i
is replaced by
cx
i
and if each y
i
is replaced by dy
i
(where c and d are positive, giving a change in
the scale of measurement), as well as if each x
i
is replaced by x
i
a and y
i
by y
i
b
664 CHAPTER 12 Regression and Correlation
(which changes the location of zero on the measurement axis). This implies, for
example, that r is the same whether temperature is measured in
For
C.
Property 3 tells us that the maximum value of r, corresponding to the largest
possible degree of positive relationship, is r ¼ 1, whereas the most negative
relationship is identified with r ¼1. According to Property 4, the largest positive
and largest negative correlations are achieved only when all points lie along a
straight line. Any other configuration of points, even if the configuration suggests a
deterministic relationship between variables, will yield an r value less than 1 in
absolute magnitude. Thus r measures the degree of linear relationship among
variables. A value of r near 0 is not evidence of the lack of a strong relationship,
but only the absence of a linear relation, so that such a value of r must be interpreted
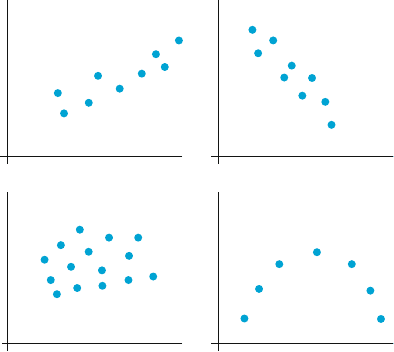
with caution. Figure 12.24 illustrates several configurations of points associated
with different values of r.
A frequently asked question is, “When can it be said that there is a
strong correlation between the variables, and when is the correlation weak?”
A reasonable rule of thumb is to say that the correlation is weak if 0
|r| .5,
strong if .8
|r| 1, and moderate otherwise. It may surprise you that r ¼ .5 is
considered weak, but r
2
¼ .25 implies that in a regression of y on x, only 25% of
observed y variation would be expl ained by the model. In Example 12.17, the
correlation between corn yield and peanut yield would be described as weak.
The Population Correlation Coefficient r
and Inferences About Correlation
The correlation coefficient r is a measure of how strongly related x and y are in the
observed sample. We can think of the pairs (x
i
, y
i
) as having been drawn from a
bivariate population of pairs, with (X
i
, Y
i
) having joint probability distribution
f(x, y). In Chapter 5, we defined the correlation coefficient r(X, Y)by
r near + 1 r near - 1
r near 0, no
a
pp
arent relationshi
p
r near 0, nonlinear
relationshi
p
Figure 12.24 Data plots for different values of r
12.5 Correlation 665

r ¼ rðX; YÞ¼
CovðX; YÞ
s
X
s
Y
where
CovðX; YÞ¼
P
x
P
y
ðx m
X
Þðy m
Y
Þf ðx; yÞðX; YÞ discrete
Ð
1
1
Ð
1
1
ðx m
X
Þðy m
Y
Þf ðx; yÞdx dy ðX; YÞ continuous
(
If we think of f(x, y) as describing the distribution of pairs of values within the
entire population, r becomes a measure of how strongly related x and y are in that
population. Properties of r analogous to those for r were given in Chapter 5 .
The population correlation coefficient r is a parameter or population charac-
teristic, just as m
X
, m
Y
, s
X
, and s
Y
are, and we can use the sample correlation
coefficient to make various inferences about r. In particular, r is a point est imate
for r, and the corresponding estimator is
^
r ¼ R ¼
P
ðX
i
XÞðY
i
YÞ
ffiffiffiffiffiffiffiffiffiffiffiffiffiffiffiffiffiffiffiffiffiffiffiffiffi
P
ðX
i
XÞ
2
q ffiffiffiffiffiffiffiffiffiffiffiffiffiffiffiffiffiffiffiffiffiffiffiffiffi
P
ðY
i
YÞ
2
q
Example 12.18 In some locations, there is a strong association between concentrations of two
different pollutants. The article “The Carbon Compon ent of the Los Angeles
Aerosol: Source Apportionment and Contributions to the Visibility Budget”
(J. Air Pollution Contr. Fed., 1984: 643–650) reports the accompanying data on
ozone concentration x (ppm) and secondary carbon concentration y (mg/m
3
).
x .066 .088 .120 .050 .162 .186 .057 .100
y 4.6 11.6 9.5 6.3 13.8 15.4 2.5 11.8
x .112 .055 .154 .074 .111 .140 .071 .110
y 8.0 7.0 20.6 16.6 9.2 17.9 2.8 13.0
The summary quantities are n ¼ 16,
P
x
i
¼ 1:656,
P
y
i
¼ 170:6,
P
x
2
i
¼ :196912,
P
x
i
y
i
¼ 20:0397,
P
y
2
i
¼ 2253:56, from which
r ¼
20:0397 ð1:656Þð170 :6Þ=16
ffiffiffiffiffiffiffiffiffiffiffiffiffiffiffiffiffiffiffiffiffiffiffiffiffiffiffiffiffiffiffiffiffiffiffiffiffiffiffiffiffiffiffiffiffiffi
:196912 ð1 :656Þ
2
=16
q ffiffiffiffiffiffiffiffiffiffiffiffiffiffiffiffiffiffiffiffiffiffiffiffiffiffiffiffiffiffiffiffiffiffiffiffiffiffiffiffiffiffiffiffiffiffi
2253:56 ð170:6Þ
2
=16
q
¼
2:3826
ð:1597Þð20:8456Þ
¼ :716
The point estimate of the population correlation coefficient r between ozone
concentration and secondary carbon concentration is
^
r ¼ r ¼ :716.
■
666 CHAPTER 12 Regression and Correlation
The small-sample intervals and test procedures presented in Chapters 8–10
were based on an assumption of popul ation normality. To test hypotheses about r,
we must make an analogous assumpt ion about the distribution of pairs of (x, y)
values in the population. We are now assuming that both X and Y are random, with
joint distribution given by the bivariate normal pdf introduced in Section 5.3.
If X ¼ x, recall that the (conditional) distribution of Y is normal with mean
m
Yx
¼ m
2
þðrs
2
=s
1
Þðx m
1
Þ and variance ð1 r
2
Þs
2
2
. This is exactly the model
used in simple linear regression with b
0
¼ m
2
rm
1
s
2
=s
1
; b
1
¼ rs
2
=s
1
, and
s
2
¼ð1 r
2
Þs
2
2
independent of x. The implication is that if the observed pairs
(x
i
, y
i
) are actually drawn from a bivariate normal distribution, then the simple
linear regression model is an appropriate way of studying the behavior of Y for
fixed x.Ifr ¼ 0, then m
Y·x
¼ m
2
independent of x; in fact, when r ¼ 0 the joint
probability density function f(x, y) can be factored into a part involving x only and a
part involving y only, which implies that X and Y are independent variables.
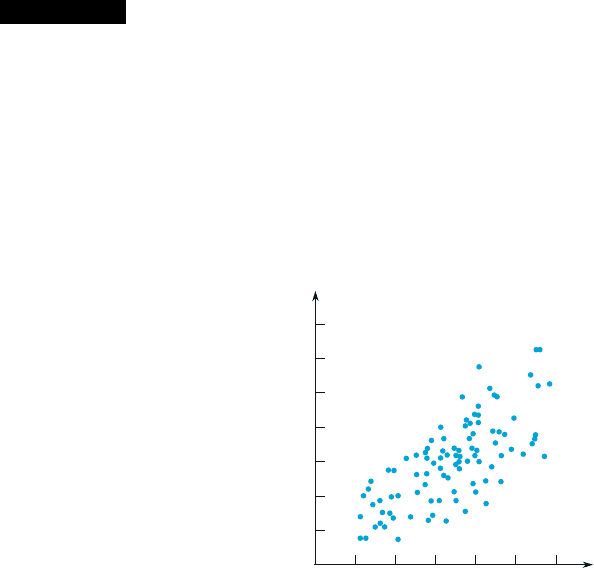
Example 12.19 As discussed in Section 5.3, contours of the bivariate normal distribution are
elliptical, and this suggests that a scatter plot of observed (x, y) pairs from such a
joint distribution should have a roughly elliptical shape. The accompa nying scatter
plot of y ¼ visceral fat (cm
2
) by the CT method versus x ¼ visceral fat (cm
2
)by
the US method for a sample of n ¼ 100 obese women appeared in the paper
“Methods of Estimation of Visceral Fat: Advantages of Ultrasonography” (Obes.
Res., 2003: 1488–1494). Computerized tomography is considered the most accu-
rate technique for body fat measurement, but is costly, time consuming, and
involves exposure to ionizing radiation; the US method is noninvasive and less
expensive.
The pattern in the scatter plot seems consistent with an assumption of
bivariate normality . Here r ¼ .71, which is not all that impressive ( r
2
¼ .50), but
the investigators reported that a test of H
0
: r ¼ 0 (to be introduced shortly) gives
P-value < .001. Of course we would want values from the two methods to be very
highly correlated before regarding one as an adequate substitute for the other.
■
100
50
0
250
300
200
150
350
0
24
6
81012
Fat by CT
Fat by US
Figure 12.25 Scatter Plot for Example 12.19
12.5 Correlation 667