Devore J.L., Berk K.N. Modern Mathematical Statistics with Applications
Подождите немного. Документ загружается.

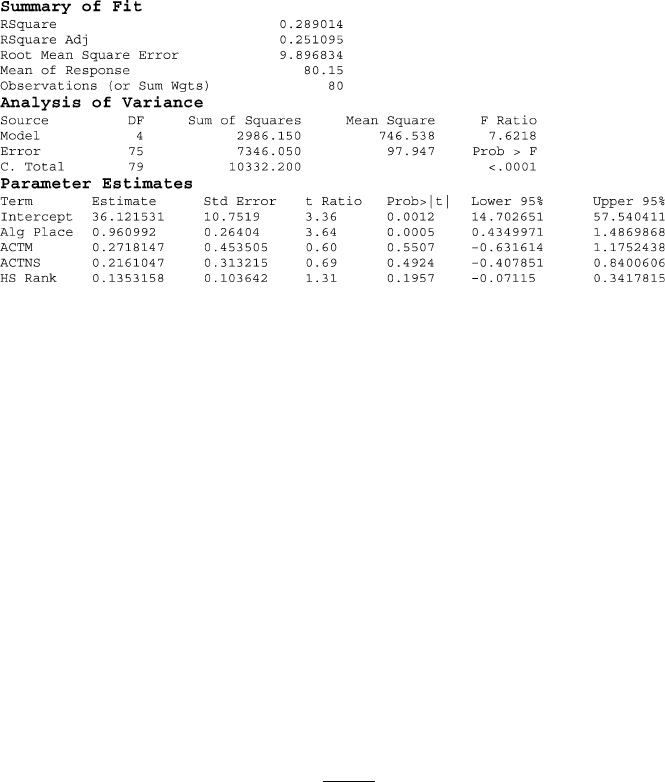
This value also appears in the F Ratio column of the ANOVA table in Figure 12.29.
Since f ¼ 7.62 F
.01,4,75
3.6, H
0
should be rejected at significance level .01.
In fact, the ANOVA table in the JMP output shows that P-val ue < .0001. The null
hypothesis should therefore be rej ected at any reasonable significance level. We
conclude that there is a useful lin ear relationship between y and at least one of the
four predictors in the model. This does not mean that all four predictors are useful;
we will say more about this subsequently.
Inferences in Multiple Regression
Before testing hypotheses, constructing CIs, and making predictions, one should
first examine diagnostic plots to see whether the model needs modification or
whether there are outliers in the data. The recommended plots are (standardized)
residuals versus each independent variable, residuals versus
^
y, y versus
^
y, and a
normal probability plot of the standardized residuals. Potential problems are sug-
gested by the same patterns discussed in Section 12.6. Of particular importance is
the identification of observations that have a large influence on the fit.
Because each
^
b
i
is a linear function of the y
i
’s, the standard deviation of each
^
b
i
is the product of s and a function of the x
ij
’s, so an estimate s
^
b
i
is obtained by
substituting s for s. A formula for s
^
b
i
is given in the next section, and the result is
part of the output from all standard regression computer packages. Inferences
concerning a single
^
b
i
are based on the standardized variable
T ¼
^
b
i
b
i
S
^
b
i
which, assum ing the model is correct, has a t distribution with n (k + 1) df.
The point estimate of m
Yx
1
;...;x
k
, the expected value of Y when
x
1
¼ x
1
; ...; x
k
¼ x
k
,is
^
m
Yx
1
;...;x
k
¼
^
b
0
þ
^
b
1
x
1
þþ
^
b
k
x
k
. The estimated standard
deviation of the corresponding estimator is a complicated expression involving the
Figure 12.29 Multiple regression output from JMP for the data of Example 12.27 ■
688
CHAPTER 12 Regression and Correlation

sample x
ij
’s, but a simple matrix formula is given in the next section. The better
statistical computer packages will calculate it on request. Inferences about m
Yx
1
;...;x
k
are based on standardizing its estimator to obtain a t variable havi ng n (k + 1) df.
1. A 100(1 a)% CI for b
i
, the coefficient of x
i
in the regression function, is
^
b
i
t
a=2;nðkþ1 Þ
s
^
b
i
2. A test for H
0
: b
i
¼ b
i0
uses the test statistic value t ¼ð
^
b
i
b
i0
Þ=s
^
b
i
based
on n (k + 1) df. The test is upper-, lower-, or two-tailed according to
whether H
a
contains the inequality >, <,or6¼ .
3. A 100(1 a)% CI for m
Yx
1
;x
2
;...;x
k
is
^
m
Yx
1
;x
2
;...;x
k
t
a=2;nðkþ1Þ
ðestimated SD of
^
m
Yx
1
;x
2
;...;x
k
Þ¼
^
y t
a=2;nðkþ1 Þ
s
^
Y
where
^
Y is the statistic
^
b
0
þ
^
b
1
x
1
þþ
^
b
k
x
k
and
^
y is the calculated value
of
^
Y.
4. A 100(1 a)% PI for a future y value is
^
m
Yx
1
;x
2
;...;x
k
t
a=2;nðkþ1 Þ
½s
2
þðestimated SD of
^
m
Yx
1
;x
2
;...;x
k
Þ
2
1=2
¼
^
y t
a=2;nðkþ1 Þ
ffiffiffiffiffiffiffiffiffiffiffiffiffiffi
s
2
þ s
2
^
Y
q
Simultaneous intervals for which the simultaneous confidence or prediction
level is controlled can be obtained by applying the Bonferroni technique.
Example 12.28
(Example 12.27
continued)
The JMP output for the calculus data include s 95% confidence intervals for the
coefficients. Let’s verify the interval for b
1
, the coefficient for algebra placement
score:
^
b
1
t
:025;805
s
^
b
1
¼ :961 1:992ð :264Þ¼:961 :526 ¼ð:435; 1:487Þ
which agrees with the interval given in Figure 12.29. Thus if ACTM score, ACTNS
score, and percentile rank are fixed, we estimate an increase between .435 and
1.487 in grade is associated with a one-point increase in algebra score.
We found in Example 12.25 that, if a student has an algebra test score of 25,
ACTM score of 28, ACTNS score of 26, and high school percentile rank of 90, then
the predicted value is 85.55. The estimated standard deviation for this predicted
value can be obtained from JMP, with the result s
^
Y
¼ 1:882, so a 95% confidence
interval for the expected grade is
^
m
Y25;28;26;90
t
:025;805
s
^
Y
¼ 85:55 1:992ð1:882Þ
¼ 85:55 3:75 ¼ð81:8; 89:3Þ
which can also be obtained from JMP. This interval is for the mean score of all
students with the predictor values 25, 28, 26, and 90. Regarding scores in the 80’s
as B’s, we can say with 95% confidence that the expected grade is a B. Now
12.7 Multiple Regression Analysis 689
consider the estimated standard deviation for the error in predicting the final grade
of a single student with the predictor values 25, 28, 26, and 90. This is
ffiffiffiffiffiffiffiffiffiffiffiffiffiffi
s
2
þ s
2
^
Y
q
¼
ffiffiffiffiffiffiffiffiffiffiffiffiffiffiffiffiffiffiffiffiffiffiffiffiffiffiffiffiffiffiffiffi
9:897
2
þ 1:882
2
p
¼ 10:074
Therefore, a 95% prediction interval for the final grade of a single student with
predictor scores 25, 28, 26, and 90 is
^
m
Y25;28;26;90
t
:025;805
ð10:074Þ¼85:55 1:992ð10:074Þ¼85:55 20:07
¼ð65:5; 105:6Þ
Of course, this PI is much wider than the corresponding CI. Although we are highly
confident that the expected score is a B, the score for a single student could be as
low as a D or as high as an A. Notice that the upper end of the interval exceeds
the maximum score of 100, so it would be appropriate to truncate the interval to
(65.5, 100) ■
Frequently, the hypothesis of interest has the form H
0
: b
i
¼ 0 for a particular
i. For example, after fitting the four-predictor model in Example 12.25, the
investigator might wish to test H
0
: b
2
¼ 0. According to H
0
, as long as the
predictors x
1
, x
3
, and x
4
remain in the model, x
2
contains no useful information
about y. The test statistic value is the t-ratio
^
b
i
=s
^
b
i
. Many statistical computer
packages report the t-ratio and corresponding P-value for each predictor included
in the model. For example, Figure 12.29 shows that as long as algebra pretest score,
ACT natural science, and high school percentile rank are retained in the model, the
predictor x
2
¼ ACT math score can be deleted. The P-value for x
2
is .55, much too
large to reject the null hypothesi s.
It is interesting to look at the correlations between the predictors and the
response variable in Example 12.25. Here are the correlations and the
corresponding P-values (in parentheses):
alg plc ACTmath ACTns rank
calc grade 0.491 0.353 0.259 0.324
(0.000) (0.0013) (0.020) (0.003)
Do these values seem inconsistent with the multiple regression results? There is a
highly significant correlation between calculus grade and ACT math score, but in
the multiple regression the ACT math scor e is redundant, not needed in the model.
The idea is that ACT math score also has highly significant correlations with the
other predictors, so much of its predictive ability is retained in the model when this
variable is deleted. In order to be a statistically significant predictor in the mul tiple
regression model, a variable must provide additional predictive ability beyond what
is offered by the other predictors.
The R
2
value for the calculus data is disappointing. Given the importance
placed on predictors such as ACT scores and high school rank in college admis-
sions and NCAA eligibility, we might expect that these scores would give better
predictions.
690 CHAPTER 12 Regression and Correlation
Assessing Model Adequacy
The standardized residuals in multiple regression result from dividing each residual
by its estimated standard deviation; a simple matrix formula for the standard
deviation is given in the next section. We recommend a normal probability plot
of the standardized residuals as a basis for validating the normality assumption.
Plots of the standardized residuals versus each predictor and versus
^
y should show
no discernible pattern. The book by Kutner et al. discusses other diagnostic plots.
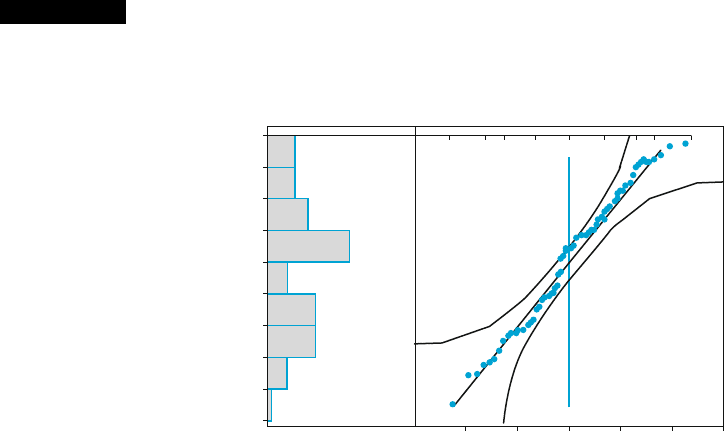
Example 12.29 Figur e 12.30 from JMP shows a histogram and normal probability plot of the
standardized residuals for the calculus data discussed in the preceding examples.
The plot is sufficiently straight that there is no reason to doubt the assumption of
normally distributed errors.
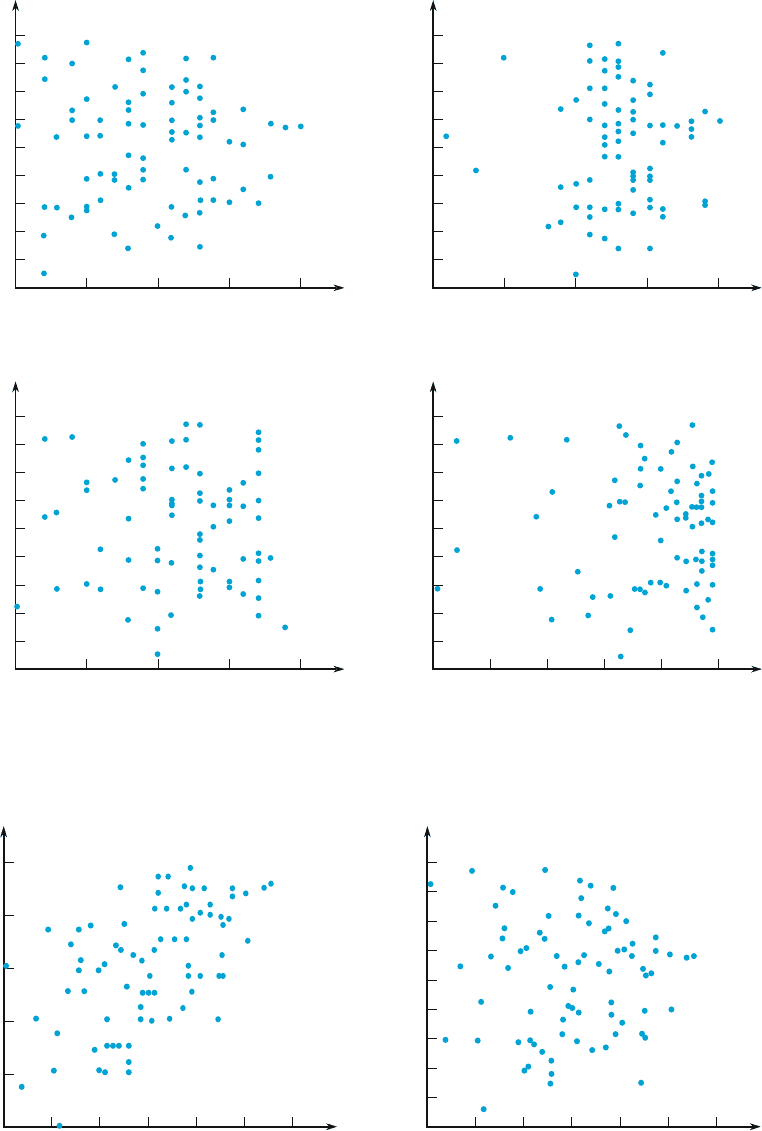
Figure 12.31 shows plots of the standar dized residuals versus the predictors
for the calcul us data. There is not much evidence of a pattern in plots (b), (c), and
(d), other than randomness. However, the first plot does show some indication that
the variance might be lower at the high end.
The graphs in Figure 12.32 show the calculus grade and the standardized
residuals plotted against the predicted values, and these also show narrowing on the
right. Looking at Figure 12.32a, it is apparent that this would have to occur, because
no score can be above 100.
■
Multiple Regression Models
We now consider various ways of creating predictors to specify informative models.
Polynomial Regression Let’s return for a moment to the case of bivariate
data consisting of n (x, y) pairs. Suppose that a scatter plot shows a parabolic rather
than linear shape. Then it is natural to specify a quadratic regression model:
Y ¼ b
0
þ b
1
x þ b
2
x
2
þ e
0
0
-
-
2
2
-
-
1
1
Normal Quantile Plot
Normal Quantile Plot
3
3
1
1
-
-
2.5
2.5
-
-
2
2
-
-
1.5
1.5
-
-
0.5
0.5
-
-
1
1
1.5
1.5
0
0
0.5
0.5
1
1
2
2
.05
.05
.01
.01
.10
.10
.25
.25
.50
.50
.75
.75
.90
.90
.95
.95
.99
.99
2
2
Figure 12.30 A normal probability plot and histogram of the standardized
residuals for the calculus data
12.7 Multiple Regression Analysis 691
0
1.5
1
0.5
2
Standardized residual calculus grade
Algebra place
0
1.5
1
0.5
2
Standardized residual calculus grade
ACTM
0
-0.5
-1
-1.5
-2
-2.5
-0.5
-1
-1.5
-2
-2.5
-0.5
-1
-1.5
-2
-2.5
-0.5
-1
-1.5
-2
-2.5
1.5
1
0.5
2
10 15 20 25 30 15 20 25 30 35
15 20 25 30 35
Standardized residual calculus grade
ACTNS
0
1.5
1
0.5
2
50 60 70 80 10090
Standardized residual calculus grade
HS Rank
ab
cd
Figure 12.31 Standardized residuals versus predictors for the calculus data
60
50
90
80
70
100
65 75 80 8570 90 95 65 75 80 8570 90 95
Calculus grade
Predicted calculus grade
0
-0.5
-1
-1.5
-2
-2.5
1.5
1
0.5
2
Standardized residual calculus grade
Predicted calculus grade
ab
Figure 12.32 Diagnostic plots for the calculus data: (a) y versus
^
y (b) standardized residual versus
^
y
692
CHAPTER 12 Regression and Correlation
The corresponding population regression functi on b
0
þ b
1
x þ b
2
x
2
is quadratic
rather than linear, and gives the mean or expected value of Y for any particular x.
So what does this have to do with multiple regression? Let’s rewrite the
quadratic model equation as follows:
Y ¼ b
0
þ b
1
x
1
þ b
2
x
2
þ e where x
1
¼ x and x
2
¼ x
2
Now this looks exactly like a multiple regression equatio n with two predictors. You
may object on the grounds that one of the predictors is a mathematical function of
the other one. Appeal denied! It is not only legitimate for a predictor in a multiple
regression model to be a function of one or more other predictors but often
desirable in the sense that a model with such a predictor may be judged much
more useful than the model without such a predictor. The message at the moment is
that quadratic regression is a special case of multiple regression. Thus any
software package capable of carrying out a multiple regression analysis can fit
the quadratic regression model. The same is true of cubic regression and even
higher-order polynomial models, although in practice very rarely are such higher-
order predictors needed.
The interpretation of b
i
given previously for the general multiple regression
model is not legitimate in quadratic regression. This is because x
2
¼ x
2
, so the
value of x
2
cannot be increased while x
1
¼ x is held fixed. More generally, the
interpretation of regression coefficie nts requires extra care when some predictor
variables are mathematical functions of others.
Models with Interaction Suppose that an industrial chemist is interested in
the relationship between product yield (y) from a certain reaction and two indepen-
dent variables, x
1
¼ reaction temperature and x
2
¼ pressure at which the reaction
is carried out. The chemist initially proposes the relationship
Y ¼ 1200 þ 15x
1
35x
2
þ e
for temper ature values between 80 and 100 in combination with pressure values
ranging from 50 to 70. The popul ation regression function 1200 + 15x
1
35x
2
gives the mean y value for any particular values of the predictors. Consider this
mean y value for three different particular temperature values:
x
1
¼ 90 : mean y value ¼ 1200 þ 15 90ðÞ35x
2
¼ 2550 35x
2
x
1
¼ 95 : mean y value ¼ 2625 35x
2
x
1
¼ 100 : mean y value ¼ 2700 35x
2
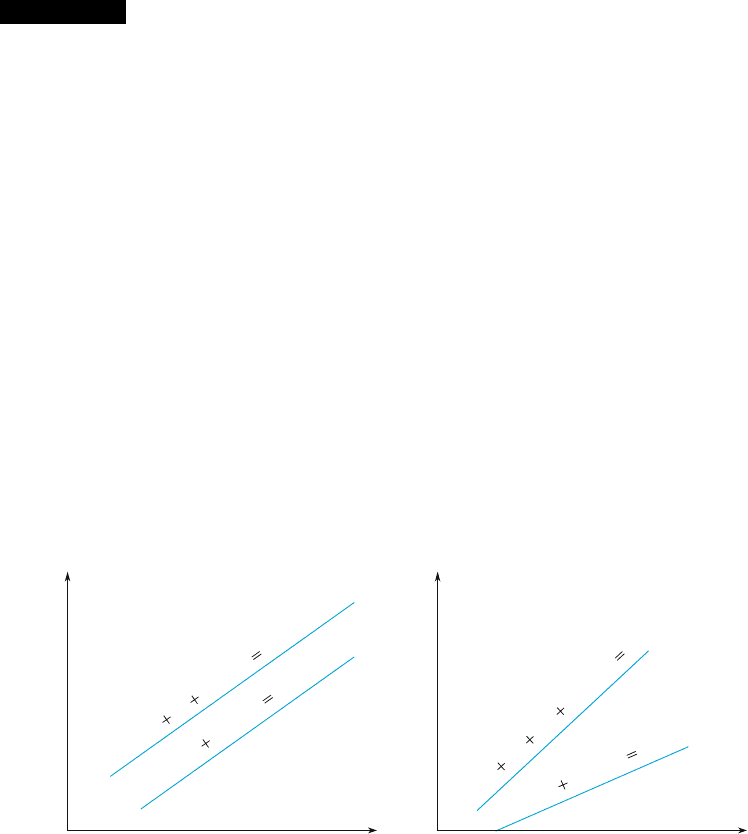
Graphs of these three mean y value functions are shown in Figure 12.33a. Each
graph is a straight line, and the three lines are parallel, each with a slope of 35.
Thus irrespective of the fixed value of temperature, the average change in yield
associated with a 1-unit increase in pressure is 35.
When pressure x
2
increases, the decline in average yield should be more rapid
for a high temperature than for a low temperature, so the chemist has reason to
doubt the appropriateness of the proposed model. Rather than the lines being
parallel, the line for a temperature of 100 should be steeper than the line for a
temperature of 95, and that line in turn should be steeper than the line for x
1
¼ 90.
12.7 Multiple Regression Analysis 693

A model that has this property includes, in addition to predictors x
1
and x
2
, a third
predictor variable, x
3
¼ x
1
x
2
. One such model is
Y ¼4500 þ 75x
1
þ 60x
2
x
1
x
2
þ e
for which the population regression function is 4500 + 75x
1
+60x
2
x
1
x
2
.This
gives
mean y value when temperature is 100ðÞ¼4500 þ 75ðÞ100ðÞþ60x
2
100x
2
¼ 3000 40x
2
mean value when temperature is 95ðÞ¼2625 35x
2
mean value when temperature is 90ðÞ¼2250 30x
2
These are graphed in Figure 12.33b , where it is clear that the three slopes are
different. Now each different value of x
1
yields a line with a different slope, so the
average change in yield associated with a l-unit increase in x
2
depends on the value
of x
1
. When this is the case, the two variables are said to interact.
DEFINITION
If the change in the mean y value associated with a 1-unit increase in one
independent variable depends on the value of a second independent variable,
there is interaction between these two variables. Denoting the two inde pen-
dent variables by x
1
and x
2
, we can model this interaction by including as an
additional predictor x
3
¼ x
1
x
2
, the product of the two independent variables.
The general equation for a multiple regression model based on two indepen-
dent variables x
1
and x
2
and also including an interaction predictor is
Y ¼ b
0
þ b
1
x
1
þ b
2
x
2
þ b
3
x
3
þ e where x
3
¼ x
1
x
2
:
When x
1
and x
2
do interact, this model will usually give a much better fit to
resulting data than would the no-interaction model. Failure to consider a model
Mean y value Mean y value
x
2
x
2
2550 − 35x
2
(x
1
=
90)
2625 − 35x
2
(x
1
=
95)
2700 − 35x
2
(x
1
=
100)
3000 − 40x
2
(x
1
=
100)
2625 − 35x
2
(x
1
=
95)
2250 − 30x
2
(
x
1
=
90)
ab
Figure 12.33 Graphs of the mean y value for two different models: (a) 1200 + 15x
1
35x
2
;
(b) 4500 + 75x
1
+60x
2
x
1
x
2
694 CHAPTER 12 Regression and Correlation

with interaction too often leads an investigator to conclude incorrectly that the
relationship between y and a set of independent variables is not very substantial.
In applied work, quadratic predictors x
2
1
and x
2
2
are often included to model a
curved relationship. This leads to the full quadratic or complete second-order
model
Y ¼ b
0
þ b
1
x
1
þ b
2
x
2
þ b
3
x
1
x
2
þ b
4
x
2
1
þ b
5
x
2
2
þ e
This model replaces the straight lines of Figure 12.33 with parabolas (each one is
the graph of the population regression function as x
2
varies when x
1
has a particular
value).
Example 12.30 Investigators carried out a study to see how various characteristics of concrete are
influenced by x
1
¼ % limestone powder and x
2
¼ water–cement ratio, resulting in
the accompanying data (“Durability of Concrete with Addition of Limestone
Powder,” Mag. Concrete Res., 1996: 131–137).
x
1
x
2
x
1
x
2
28-day comp str. (MPa) Adsorbability (%)
21 .65 13.65 33.55 8.42
21 .55 11.55 47.55 6.26
7 .65 4.55 35.00 6.74
7 .55 3.85 35.90 6.59
28 .60 16.80 40.90 7.28
0 .60 0.00 39.10 6.90
14 .70 9.80 31.55 10.80
14 .50 7.00 48.00 5.63
14 .60 8.40
42.30 7.43
y ¼ 39:317; SST ¼ 278:52 y ¼ 7:339; SST ¼ 18:356
Consider first compressive strength as the dependent variable y. Fitting the first-
order model results in
y ¼ 84:82 þ :1643x
1
79:67x
2
SSE ¼ 72:25 df ¼ 6ðÞ
R
2
¼ :741 R
2
a
¼ :654
whereas including an interaction predictor gives
y ¼ 6:22 þ 5:779x
1
þ 51:33x
2
9:357x
1
x
2
SSE ¼ 29:35 df ¼ 5ðÞR
2
¼ :895 R
2
a
¼ :831
Based on this latter fit, a predictio n for compressive strength when % limestone ¼
14 and water–cement ratio ¼ .60 is
^
y ¼ 6:22 þ 5:779 14ðÞþ51:33 :60ðÞ9:357 8: 4ðÞ¼39:32
Fitting the full quadratic relationship results in virtually no change in the R
2
value.
However, when the dependent variabl e is adsorbability, the following results are
obtained: R
2
¼ .747 when just two predictors are used, .802 when the interaction
predictor is added, and .889 when the five predictors for the full quadratic relation-
ship are used.
■
12.7 Multiple Regression Analysis 695
Models with Predictors for Categorical Variables Thus far we have
explicitly considered the inclusion of only quantitative (numerical) predictor vari-
ables in a multiple regression model. Using simple numerical coding, qualitative
(categorical) variables, such as type of college (private or state) or type of wood
(pine, oak, or walnut), can also be incorporated into a model. Let’s first focus on the
case of a dichotomous variable, one with just two possible categories—male or
female, U.S. or foreign manufacture, and so on. With any such variable, we
associate a dummy or indicator variable x whose possible values 0 and 1 indicate
which category is relevant for any particular observation.
Example 12.31 Re call the graduation rate data introduced in Example 12.12 and plotted in Exam-
ple 12.24. There it appeared that private universities might do better for a given
SAT score. To test this we will use a model with y ¼ graduation rate, x
2
¼ average
freshman SAT score, and x
1
¼ a variable defined to indicate private or public
status. Define
x
1
¼
1 if the university is private
0 if the university is public
and consider the multiple regression model
Y ¼ b
0
þ b
1
x
1
þ b
2
x
2
þ e:
The mean graduation rate depends on whether the university is public or private:
mean graduation rate ¼ b
0
þ b
2
x
2
when x
1
¼ 0 publicðÞ
mean graduation rate ¼ b
0
þ b
1
þ b
2
x
2
when x
1
¼ 1 privateðÞ
Thus there are two parallel lines with vertical separation b
1
. as shown in Fig-
ure 12.34a. The coefficient b
1
is the difference in mean graduation rates between
private and public universities with SAT held fixed. If b
1
> 0, then on average, for
a given SAT, private universities will have a higher graduation rate.
Mean y Mean y
Private
State
Private
State
x
2
x
2
b
0
b
1
b
2
x
2
(x
1
1)
b
0
b
2
x
2
(
x
1
0)
b
0
b
1
(
b
2
b
3
)x
2
(
x
1
1)
b
0
b
2
x
2
(x
1
0)
ab
Figure 12.34 Regression functions for models with one dummy variable ( x
1
) and one
quantitative variable (x
2
): (a) no interaction; (b) interaction
696
CHAPTER 12 Regression and Correlation
A second possibility is a model with a product (interaction) term:
Y ¼ b
0
þ b
1
x
1
þ b
2
x
2
þ b
3
x
1
x
2
þ e:
Now the mean graduation rates for the two types of university are
mean graduation rate ¼ b
0
þ b
2
x
2
when x
1
¼ 0 publicðÞ
mean graduation rate ¼ b
0
þ b
1
þðb
2
þ b
3
Þx
2
when x
1
¼ 1 privateðÞ
Thus we have two lines where b
1
is the difference in intercepts and b
3
is the
difference in slopes, as shown in Figure 12.34b. Unless b
3
¼ 0, the lines will not
be parallel and there will be interact ion, which means that the separation between
public and private universities depends on SAT.
The usual procedure is to test the interaction hypothesis H
0
: b
3
¼ 0 versus
H
a
: b
3
6¼ 0 first. If we do not reject H
0
(no interaction) then we can use the parallel
model to see if there is a separation (b
1
) between lines. Of course, it does not make
sense to estimate the difference between lines if the difference depends on x
2
,
which is the case when there is interact ion.
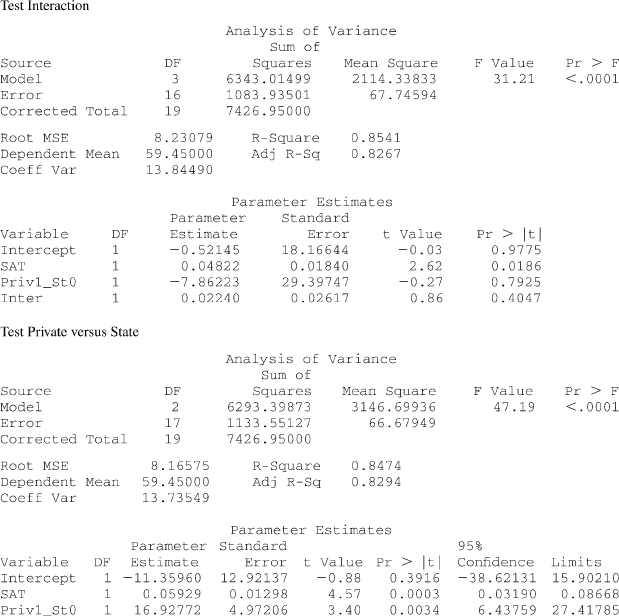
Figure 12.35 shows SAS output for these two tests. The coefficient for
interaction has a P-value of 0.9062, so there is no reason to reject the null
Figure 12.35 SAS output for interaction model and parallel model ■
12.7 Multiple Regression Analysis 697