Dinc Ibrahim. Refrigeration systems and applications 2th edition
Подождите немного. Документ загружается.

Refrigeration Cycles and Systems 201
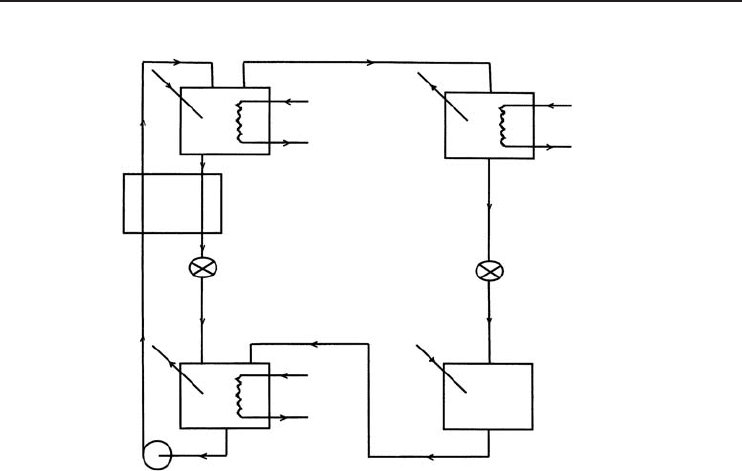
Generator
Q
G
T
G
3
4
5
6
2
Q
P
Q
A
Solution pump
Absorber
T
A
1
Heat exchanger
Expansion valve
7
Q
C
T
C
Condenser
8
Expansion valve
9
T
E
Q
E
Evaporator
10
Figure 4.33 The lithium bromide–water ARS used in the model development (Dincer and Dost, 1996).
generator temperatures were computed using a computer program which is partly based on some
equations given in ASHRAE 1997: T
1
= T
2
= T
8
= 30
◦
C, T
3
= 32.3
◦
C, T
4
= 90
◦
C, T
5
= 88
◦
C,
T
6
= 75.5
◦
C, T
7
= 90
◦
C, T
9
= T
10
= 4.5
◦
C; h
1
= 60.5 kJ/kg, h
2
= 95.6 kJ/kg, h
3
= 102.1 kJ/kg,
h
4
= 256.1 kJ/kg, h
5
= h
6
= 251.19 kJ/kg, h
7
= 2660.1 kJ/kg, h
8
= h
9
= 125.66 kJ/kg, h
10
=
2509.9 kJ/kg; and P
E
= 1.23 kPa, for T
G
= 90
◦
C; and T
1
= T
2
= T
8
= 30
◦
C, T
3
= 34.4
◦
C, T
4
=
100
◦
C, T
5
= 96
◦
C, T
6
= 80.1
◦
C, T
7
= 100
◦
C, T
9
= T
10
= 4.5
◦
C; h
1
= 60.5 kJ/kg, h
2
= 104.12
kJ/kg, h
3
= 111.3 kJ/kg, h
4
= 278.08 kJ/kg, h
5
= h
6
= 268.13 kJ/kg, h
7
= 2676.0 kJ/kg, h
8
=
h
9
= 125.66 kJ/kg, h
10
= 2509.9 kJ/kg; and P
E
= 1.23 kPa, P
C
= 5.45 kPa for T
G
= 100
◦
C.
Using the above temperature, enthalpy, and pressure values in energy balance equations we
obtained the following absorber heat capacity, solution pump work, generator heat capacity, con-
denser heat capacity, and evaporator heat capacity with the mass flow rate of weak solution for
two cases of generator temperatures of 90 and 100
◦
C:
˙
Q
A
= 1093.65 ˙m
a
and
˙
Q
A
= 1162.89 ˙m
a
˙
W
P
= 48.09 ˙m
a
and
˙
W
P
= 60.63 ˙m
a
˙
Q
G
= 1101.13 ˙m
a
and
˙
Q
G
= 1167.89 ˙m
a
˙
Q
C
= 937.76 ˙m
a
and
˙
Q
C
= 994.63 ˙m
a
˙
Q
E
= 882.19 ˙m
a
and
˙
Q
C
= 929.85 ˙m
a
with COP = 0.7676 at the generator temperature of 90
◦
CandCOP= 0.7574 at the generator
temperature of 100
◦
C. These COP values indicate that the lithium bromide–water ARS at the
generator temperature of 90
◦
C becomes more efficient in providing the evaporator temperature
of 4.5
◦
C, because of the fact that the lower generator temperature provides the same evaporator
temperature. In this respect, this generator temperature is recommended for practical applications.
202 Refrigeration Systems and Applications
180
170
160
150
140
130
120
110
90
80
70
60
50
40
30
20
10
100 °C
0
50
100
150
200
250
300
350
400
450
500
Enthalpy, kJ/kg solution
010203040506070
Lithium bromide concentration, mass percent
Equations Concentration range 40 < X < 70% LiBr
Temperature range 15 < t < 165 °C
h = Σ
4
o
A
n
X
n
+ t Σ
4
o
B
n
X
n
+ t
2
Σ
4
o
C
n
X
n
in kJ/kg, where t = °C and X = % LiBr
A
0
= −2024.33
A
1
= 163.309
A
2
= −4.88161
A
3
= 6.302948 E−2
A
4
= −2.913705 E−4
B
4
= 1.8520569 E−6
B
0
= 18.2829
B
1
= −1.1691757
B
2
= 3.248041 E−2
B
3
= −4.034184 E−4
C
4
= −4.4441207 E−9
C
0
= −3.7008214 E−2
C
1
= 2.8877666 E−3
C
2
= −8.1313015 E−5
C
3
= 9.9116628 E−7
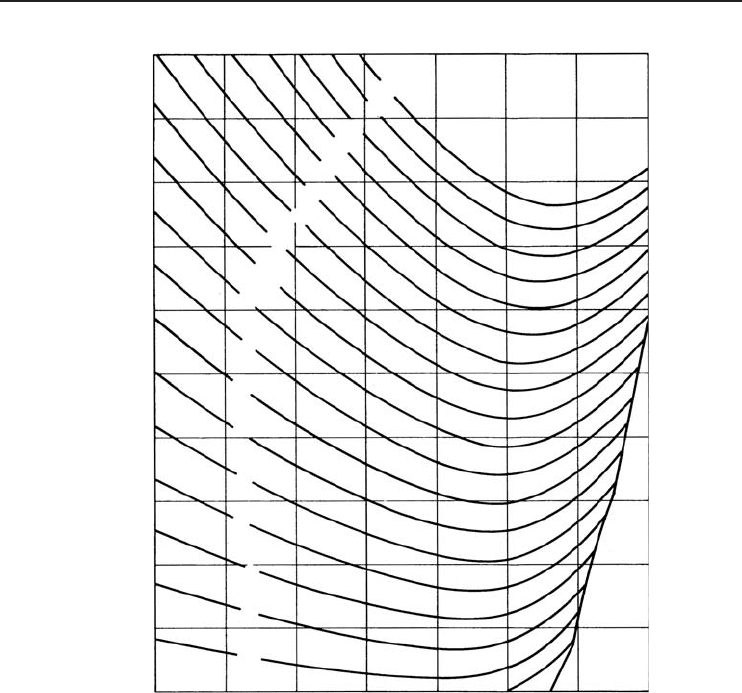
Figure 4.34 Enthalpy–concentration diagram for lithium bromide–water combinations (ASHRAE, 1997)
(Reprinted with permission from ASHRAE).
The above equations were checked by inserting them into energy balance equations and were
found to be correct. The variations in the capacities of absorber, pump, generator, condenser, and
evaporator against the flow rate of the weak solution (for the range of 0 and 0.2 kg/s) were computed
from the above equations and are shown in Figure 4.35a and b. As seen, the capacities increase
with the flow rate linearly. Thus, one can claim that the above equations (i.e., heat load-mass flow
rate equations) under the optimum conditions will lead to a simple solution for the design of a
practical lithium bromide–water ARS.
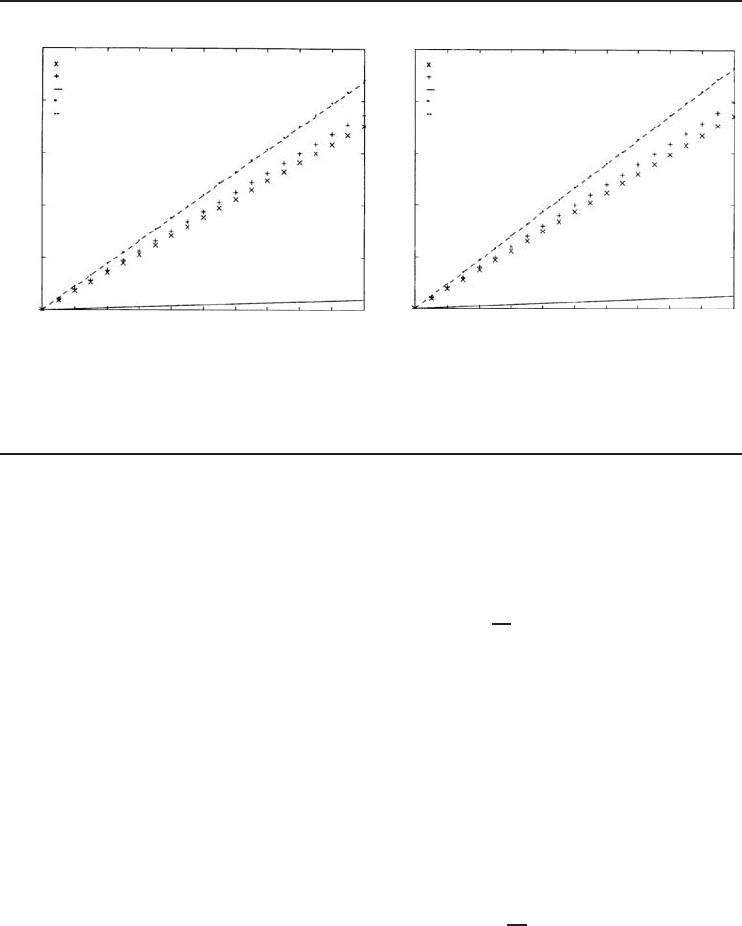
Refrigeration Cycles and Systems 203
250
200
150
100
50
0
0 0.02 0.04 0.06 0.08 0.1 0.12 0.14 0.16 0.18 0.2
Mass flow rate (kg/s)
(a)
Heat load (kW)
Evaporator
Condenser
Solution pump
Generator
Absorber
T
G
= 90 °C
COP = 0.7676
250
200
150
100
50
0
0 0.02 0.04 0.06 0.08 0.1 0.12 0.14 0.16 0.18 0.2
Mass flow rate (kg/s)
(b)
Heat load (kW)
Evaporator
Condenser
Solution pump
Generator
Absorber
T
G
= 100 °C
COP = 0.7574
Figure 4.35 Variations of absorber, pump, generator, condenser, and evaporator capacities versus mass flow
rate of weak solution (a) at T
G
= 90
◦
Cand(b)atT
G
= 100
◦
C (Dincer and Dost, 1996).
4.7.9 Exergy Analysis of an ARS
As given earlier, the change in exergy rate or the rate of exergy loss can be defined in terms of
physical terms as follows:
˙
Ex =
˙m
i
ex
i
−
˙m
e
ex
e
+
˙
Q
1 −
T
0
T
+
˙
W
i
(4.55)
where the first terms are the sum of exergy input and output rates of the flow, respectively. The
third term is the heat of exergy (+ if it is heat input; – if it is heat output). The last term is the
work given to the system (e.g., pump work).
The exergy balance equations for the components of the ARS can be written with respect to
Figure 4.36 as follows:
• Condenser:
˙
Ex
C
=˙m
7
(ex
7
− ex
8
) (4.56)
since there is a heat rejection to the surroundings (T
C
= T
0
) resulting in
˙
Q
C
(1 − T
0
/T
C
) = 0
and no work input makes
˙
W
i
= 0.
• Evaporator:
˙
Ex
E
=˙m
7
(ex
10
− ex
11
) +
˙
Q
E
1 −
T
0
T
E
(4.57)
• Absorber:
˙
Ex
A
=˙m
7
ex
12
+˙m
6
ex
6
−˙m
1
ex
1
(4.58)
since there is a heat rejection to the surroundings (T
A
= T
0
) resulting in
˙
Q
A
(1 − T
0
/T
A
) = 0
and no work input makes
˙
W
i
= 0.
• Solution pump:
˙
Ex
P
=˙m
1
(ex
1
− ex
2
) +
˙
W
P
(4.59)
204 Refrigeration Systems and Applications
• Generator:
˙
E
G
=˙m
3
ex
3
−˙m
4
ex
4
−˙m
7
ex
7
+
˙
Q
G
1 −
T
0
T
G
(4.60)
• First heat exchanger:
˙
Ex
HE1
=˙m
2
(ex
2
− ex
3
) +˙m
4
(ex
4
− ex
5
) (4.61)
• Second heat exchanger:
˙
Ex
HE2
=˙m
7
(ex
8
− ex
9
+ ex
11
− ex
12
) (4.62)
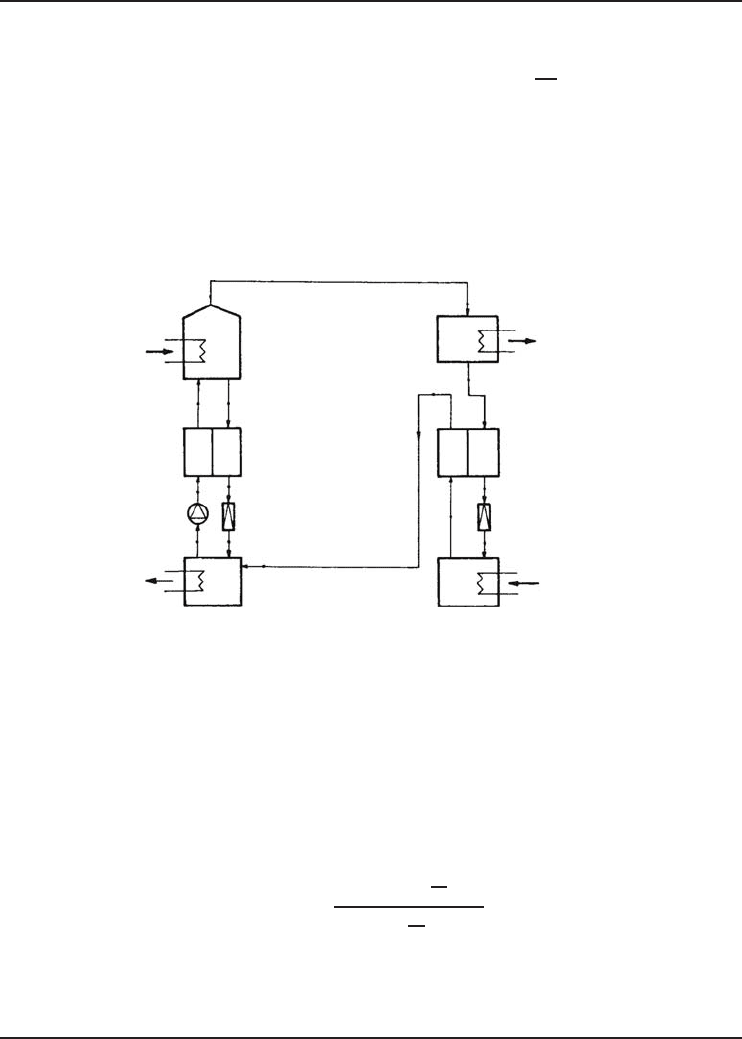
Generator
7
4
3
5
2
6
1
MHE
Pump
Expansion valve
q
a
q
g
Absorber
12′
12
11
8
9
10
Expansion valve
Evaporator
RHE
Condenser
7′
q
c
q
e
Figure 4.36 Schematic of the ammonia–water ARS (Ataer and Gogus, 1991) (Reprinted with permission
from Elsevier Science).
Note that the exergy losses in expansion valves are neglected because of the fact that their
magnitudes are comparatively small. Therefore, the total exergy loss of the ARS system becomes
the sum of the exergy losses in the components as listed above:
˙
Ex
T
=
˙
Ex
C
+
˙
Ex
E
+
˙
Ex
P
+
˙
Ex
G
+
˙
Ex
HE1
+
˙
Ex
HE2
(4.63)
Consequently, the exergetic COP (ECOP)(i.e., exergy efficiency) for the entire system can be
defined as follows:
η
COP,ex
=
˙
Q
E
1 −
T
0
T
E
˙
Q
G
1 −
T
0
T
G
+
˙
W
P
(4.64)
Note that the heat-transfer rates for condenser, evaporator, absorber, and generator can be cal-
culated through the energy balance equations as given earlier in this section.
Example 4.9
In this example, we present work done by Ataer and Gogus 1991 on exergy analysis of an
ammonia–water ARS which is similar to that shown in Figure 4.21 and the performance results.
These authors determined irreversibilities in components (absorber, generator, pump, expansion

Refrigeration Cycles and Systems 205
valves, mixture heat exchanger (MHE), and refrigerant heat exchanger (RHE)) of the ARS by
exergy analysis. It was assumed that the ammonia concentration at the generator exit is independent
of the other parameters, equal to 0.999, and at the evaporator exit the gas was saturated vapor. Pres-
sure losses between the generator and condenser, and the evaporator and absorber, were taken into
consideration. For each condenser, evaporator, absorber, and generator temperature it was assumed
that a separate ARS design capacity is a 1 kW cooling load. The assumptions were that the mixture
leaves the condenser at the condenser temperature and in a saturated liquid state; the weak solu-
tion leaves the generator at the generator temperature; the strong solution leaves the absorber at the
absorber temperature; the mixture at the evaporator exit is saturated vapor at the evaporator temper-
ature; and the rectifier of the ARS and its effect is ignored. In the results, the exergy values of each
component, the COP, and the ECOP were given graphically for different generator temperatures.
Solution
The mass and exergy balance equations for each component of the system were written, based on
the methodology presented earlier in this section. Ataer and Gogus 1991 conducted an analysis to
determine COP and ECOP values varying with generator temperature. They obtained Table 4.1, pre-
senting the temperature, pressure, concentration (mass fraction), mass flow rate, enthalpy, entropy,
and exergy data for each point of the system as shown in Figure 4.36.
As shown in Figure 4.38a, typical COP values of the ARS are in the range 0.2−0.9. For a given
evaporator, absorber, and condenser temperature there is a minimum generator temperature which
Table 4. 1 ARS data obtained from the analysis.
Point T(
◦
C)P(bar) Xm(g/s)h(kJ/kg) S (kJ/kg·K) e (kJ/kg)
1 24.00 2.571 0.459 2.37 −138.65 2.032 −734.43
2 24.04 9.094 0.459 2.37 −137.80 2.031 −733.09
3 81.53 9.094 0.459 2.37 127.49 2.847 −707.07
4 130.0 9.094 0.170 1.54 444.43 4.532 −884.26
5 45.41 9.094 0.170 1.54 66.22 3.479 −953.71
6 45.50 2.571 0.170 1.54 66.22 3.482 −954.54
7 130.00 9.094 0.999 0.83 1562.43 5.150 52.82
7
129.59 8.661 0.999 0.83 1562.43 5.173 45.97
8 22.00 8.661 0.990 0.83 102.60 0.378 −8.15
9 11.02 8.661 0.999 0.83 50.64 0.198 −7.52
10 11.06 2.764 0.999 0.83 50.64 0.201 −8.41
11 −10.00 2.764 0.999 0.83 1255.82 4.777 −144.58
12 15.59 2.764 0.999 0.83 1316.44 4.997 −148.44
12
15.00 2.571 0.999 0.83 1316.44 5.031 −158.53
Note that the temperature–concentration diagram of ammonia–water mixture is utilized to get enthalpy and
other relevant data. Such a diagram is shown in Figure 4.37.
Source: Ataer and Gogus (1991) (Reprinted with permission from Elsevier Science).
206 Refrigeration Systems and Applications
0 0.1 0.2 0.3 0.4 0.5 0.6 0.7 0.8 0.9 1.0
210
200
190
180
170
160
150
140
130
120
110
100
90
80
70
60
50
40
30
20
10
0
−10
−20
−30
−50
−40
0 0.1 0.2 0.3 0.4 0.5 0.6 0.7 0.8 0.9 1.0
Ammonia in saturated liquid
Temperature, °C
210
200
190
180
170
160
150
140
130
120
110
100
90
80
70
60
50
40
30
20
10
0
−10
−20
−30
−50
−40
Temperature, °C
Saturation pressure, KPa
Enthalpy of saturated vapor, KJ/Kg vapor
Vapor composition, Kg NH
3
/Kg vapor
Enthalpy of saturated liquid, KJ/Kg liquid
Figure 4.37 Temperature–concentration diagram of ammonia–water mixture (ASHRAE, 1997) (Reprinted
with permission from ASHRAE).
(a)
(b)
0.9
0.8
0.7
0.6
0.5
0.4
0.3
0.2
0.1
0.0
50 70 90 110 130
T
g
(°C)
0.45
0.40
0.35
0.30
0.25
0.20
0.15
0.10
0.05
0
50 70 90 110 130
T
g
(°C)
0 °C
−10 °C
10 °C
10 °C
10 °C
10 °C
10 °C
−10 °C
0 °C
0 °C
0 °C
0 °C
−10 °C
−10 °C
−10 °C
−10 °C
−20 °C
−20 °C
−20 °C
−20 °C
−20 °C
−20 °C
COP
T
e
= 10 °C
T
e
= 10 °C
ECOP
Figure 4.38 Variation of (a) COP and (b) exergetic COP (ECOP) with generator temperature (Ataer and
Gogus, 1991) (Reprinted with permission from Elsevier Science).
Refrigeration Cycles and Systems 207
corresponds to equalization of ammonia concentrations of the solution flowing into and out of the
generator. This temperature is called the cut-in temperature. For generator temperatures above this
value, the COP increases until it reaches a maximum. The value of ECOP is at a maximum at the
points where the COP values are at a maximum, as shown in Figure 4.38b. However, ECOP values
are relatively much smaller than the corresponding COP values, because of the fact that there are
considerable irreversibilities occurring in the system.
Consequently, for each condenser, absorber, and evaporator temperature, there is a generator
temperature at which the dimensionless total exergy loss of the ARS is a minimum. At this point
the COP and ECOP of the system are at a maximum. It can be noted that the results of the
second-law analysis can be used to identify the less efficient components of the system and also
to modify them. Moreover, the suitability of the selected components can be judged by exergy
analysis. Furthermore, the exergy analysis appears to be a significant tool for the determination of
the optimum working conditions of such systems.
4.7.10 Performance Evaluation of an ARS
The efficiency of ARS is defined by COP as in a vapor-compression refrigeration system.
Figure 4.39 presents the change of COP for a single-stage NH
3
–H
2
O ARS with evaporation
temperature at different condensation temperature ranges of 10−20
◦
C, 20−30
◦
C, and 30−40
◦
C,
respectively. As shown in the figure, increasing evaporation temperature will decrease the COP,
and for the same evaporation temperature a lower condensation temperature will give better
COP. These trends should be taken into consideration carefully when designing an ARS for any
particular application.
4.8 Concluding Remarks
This chapter has dealt with a large number of theoretical and practical topics in refrigeration
systems, covering refrigeration cycles/systems and their energy and exergy analyses along with
the representative examples. In addition to conventional vapor-compression cycles, air-standard
refrigeration cycle and absorption–refrigeration cycles are studied in a greater detail.
10 °C–20 °C
20 °C–30 °C
30 °C–40 °C
80
70
60
50
40
30
20
10
0
COP (%)
10 −10 −20 −30 −40 −50 −600
Evaporation temperature (°C)
Figure 4.39 Variation of COP with evaporation temperature at various condensation temperature ranges
(Courtesy of Colibri b.v.-Stork Thermeq b.v.).

208 Refrigeration Systems and Applications
Nomenclature
COP coefficient of performance
c
p
constant pressure specific heat, kJ/kg·K
ex specific exergy, kJ/kg
˙
Ex exergy rate, kW
h enthalpy, kJ/kg
˙m mass flow rate, kg/s
P pressure, kPa
q specific heat, kJ/kg
˙
Q heat load; power, kW
s entropy, kJ/kg
˙
S
gen
entropy generation rate, kW/K
T temperature,
◦
CorK
v specific volume, m
3
/kg
˙
V volumetric flow rate, m
3
/s
w specific work, kJ/kg
˙
W work input to compressor or pump, kW
X concentration of refrigerant in solution, kg/kg
Greek Letters
η efficiency
Study Problems
Vapor-Compression Refrigeration Systems
4.1 Draw temperature–entropy and pressure–enthalpy diagrams of simple vapor-compression
refrigeration cycle.
4.2 Explain the four processes that make up the simple vapor-compression refrigeration cycle.
4.3 A refrigeration cycle is used to keep a food department at −5
◦
C in an environment at 20
◦
C.
The total heat gain in the food department is estimated to be 750 kJ/h and the heat rejection
in the condenser is 1250 kJ/h. Determine (a) the power input to the compressor in kW,
(b) the COP of the refrigerator, and (c) the minimum power input to the compressor if a
reversible refrigerator was used.
4.4 A refrigeration cycle is used to keep a refrigerated space at −25
◦
C in an environment at
27
◦
C. The refrigeration load of the space is 11.5 kW and the COP of the refrigerator is
estimated to be 0.90. Determine (a) the power input, (b) the rate of heat rejected in the
condenser, and (c) the maximum possible COP of this refrigerator.
4.5 A small room is kept at 23
◦
C by a 9000 Btu/h split air conditioner when the ambient
temperature is 35
◦
C. The air conditioner is running at full load under these conditions. The
power input to the compressor is 1.6 kW. Determine (a) the rate of heat rejected in the
condenser in Btu/h, (b) the COP of the air conditioner, and (c) the rate of cooling in Btu/h
if the air conditioner operated as a Carnot refrigerator for the same power input.
Refrigeration Cycles and Systems 209
4.6 A commercial refrigerator is to cool eggplants from 28 to 12
◦
C at a rate of 660 kg/h. The
power input to the refrigerator is 10 kW. Determine the rate of cooling and the COP of
the refrigerator. The specific heat of eggplant above freezing is 3.92 kJ/kg·
◦
C.
4.7 Water is continuously cooled in a refrigerator from 17 to 3
◦
C. The heat rejected in the
condenser is 380 kJ/min and the power input is 2.2 kW. Determine the rate at which water
is cooled in L/min and the COP of the refrigerator. The specific heat of water is 4.18 kJ/kg·
◦
C.
4.8 A refrigeration system absorbs heat from a space at 5
◦
C at a rate of 25 kW and rejects heat
to water in the condenser. Water enters the condenser at 15
◦
C at a rate of 0.84 kg/s. The
COP of the system is estimated to be 1.75. Determine (a) the power input to the system,
(b) the temperature of the water at the exit of the condenser, and (c) the maximum possible
COP of the system. The specific heat of water is 4.18 kJ/kg·
◦
C.
4.9 A refrigeration system absorbs heat from a space at 40
◦
F at a rate of 17 Btu/s and rejects
heat to water in the condenser. Water enters the condenser at 60
◦
F at a rate of 1.75 lbm/s.
The COP of the system is estimated to be 1.85. Determine (a) the power input to the system
in kW, (b) the temperature of the water at the exit of the condenser, and (c) the maximum
possible COP of the system. The specific heat of water is 1.0 Btu/lbm·
◦
F.
4.10 Refrigerant-134a enters the compressor of a refrigeration system at 140 kPa as a saturated
vapor and leaves at 800 kPa and 70
◦
C. The refrigerant leaves the condenser as a saturated
liquid. The rate of cooling provided by the system is 900 W. Determine the mass flow rate
of R-134a and the COP of the system.
4.11 Refrigerant-134a enters the evaporator coils of a household refrigerator placed at the back
of the freezer section at 120 kPa with a quality of 20% and leaves at 120 kPa and −20
◦
C. If
the compressor consumes 620 W of power and the COP of the refrigerator is 1.3, determine
(a) the mass flow rate of the refrigerant and (b) the rate of heat rejected to the kitchen air.
120 kPa
−20 °C
Condenser
Evaporator
Compressor
Expansion
valve
120 kPa
x = 0.2
Q
L
Q
H
W
in
4.12 A refrigerated room is kept at −35
◦
C by a vapor-compression cycle with R-134a as the
refrigerant. Heat is rejected to cooling water that enters the condenser at 16
◦
Catarateof
0.45 kg/s and leaves at 26
◦
C. The refrigerant enters the condenser at 1.2 MPa and 50
◦
C
and leaves at the same pressure subcooled by 5
◦
C. If the compressor consumes 7.4 kW of
power, determine (a) the mass flow rate of the refrigerant, (b) the refrigeration load, (c) the
COP, and (d) the minimum power input to the compressor for the same refrigeration load.
Take specific heat of water to be 4.18 kJ/kg·
◦
C.
210 Refrigeration Systems and Applications
Q
H
1.2 MPa
5 °C subcool
Condenser
Evaporator
Compressor
Expansion
valve
1.2 MPa
50 °C
Q
L
W
in
Water
16 °C
26 °C
4.13 An air conditioner with refrigerant-134a as the refrigerant is used to keep a room at 24
◦
C
by rejecting the waste heat to the outside air at 36
◦
C. The room is gaining heat through the
walls and the windows at a rate of 125 kJ/min, while the heat generated by the computer,
TV, and lights amounts to 800 W. The refrigerant enters the compressor at 500 kPa as a
saturated vapor at a rate of 100 L/min and leaves at 1200 kPa and 50
◦
C. Determine (a) the
actual COP, (b) the maximum COP, and (c) the minimum volume flow rate of the refrigerant
at the compressor inlet for the same compressor inlet and exit conditions.
Q
H
500 kPa
Saturated vapor
Condenser
Evaporator
Compressor
Expansion
valve
1.2 MPa
50 °C
Q
L
W
in
4.14 An ideal vapor-compression refrigeration cycle with refrigerant-134a as the working fluid
operates between pressure limits of 240 kPa and 1600 kPa. Determine (a) the heat absorption
in the evaporator, (b) the heat rejection in the condenser, (c) the work input, and (d) the COP.
4.15 An ideal vapor-compression refrigeration cycle with refrigerant-134a as the working fluid
operates between pressure limits of 40 and 300 psia. Determine (a) the heat absorption
in the evaporator, (b) the heat rejection in the condenser, (c) the work input, and
(d) the COP.