Givan A.L. Flow Cytometry. First Principles
Подождите немного. Документ загружается.

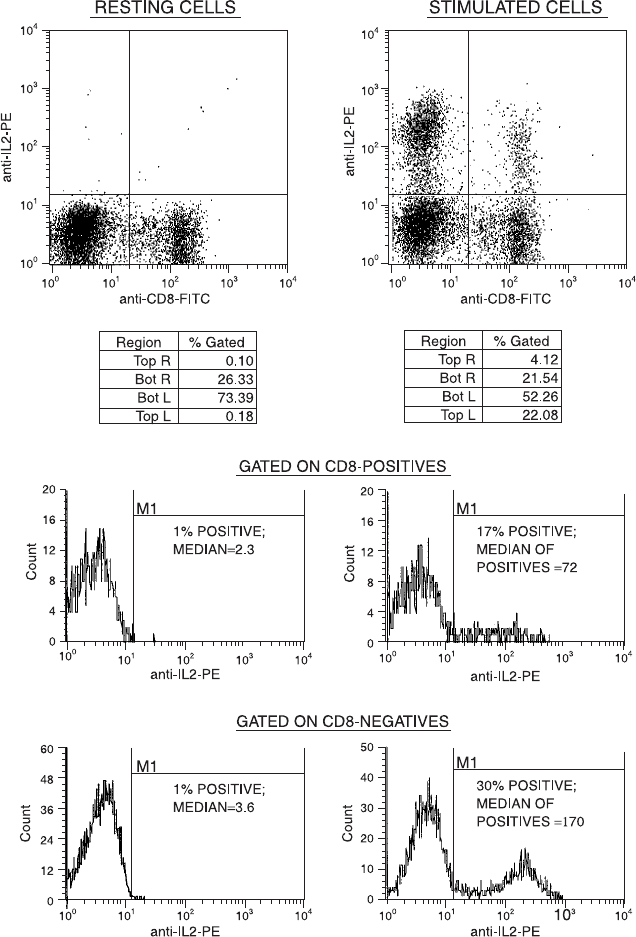
Fig. 7.2. Dot plots showing the staining of lymphocytes for intracellular interferon-g
in conjunction with an outer membrane stain (against CD8) to phenotype the cyto-
kine-producing cells. Cells were stained for CD8 and then ®xed with formaldehyde
and permeabilized with saponin. The stimulus was PMA-ionomycin. Data courtesy
of Paul Wallace.
with brefeldin A or monensin inhibition so that they build up large
amounts of easily detectable cytokines but do not burst from this dire
treatment.
As another example of intracellular staining, we can look at data
from the staining of human breast tumor cells for cytokeratin and for
the estrogen receptor (both intracellular proteins). Tumor cells were
obtained following mastectomy by mincing and sieving the tissue to
form a single-cell suspension. The suspension was then treated with
saponin to permeabilize the cells. After staining for both cytokeratin
and the estrogen receptor, cytokeratin-positivity selects the cells in
the mixture that are of epithelial tumor origin (excluding stromal
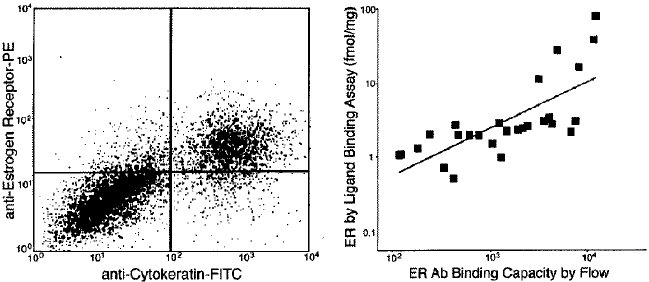
or in®ltrating in¯ammatory cells). The two-color plot in Figure 7.3
indicates that the cytokeratin-positive (but not the cytokeratin-
negative) cells express the estrogen receptor strongly (estrogen re-
ceptor positivity is associated with superior prognosis and a greater
responsiveness to endocrine therapy). Gating on the cytokeratin-
positive cells permits the analysis of tumor cells by themselves for the
estrogen receptor without concern about the variable contamination
of tumor cells by stromal cells in di¨erent samples.
Fig. 7.3. A dot plot (on the left) showing the staining of cells from a human breast
tumor for two intracellular proteins. Cytokeratin-positivity marks tumor cells in the
suspension, and estrogen receptor positivity on these cells indicates superior prog-
nosis. The plot on the right shows a correlation (in 27 breast tumors) between the
intensity of estrogen receptor staining by ¯ow cytometry and the level of estrogen
receptor binding (by radioligand binding assay). Modi®ed from Ian Brotherick et al.
(1995).
Intracellular Proteins 121
Having discussed the staining of cells for both extracellular and
intracellular proteins, and, in the process, learned something about
general ¯ow cytometric methodologies for analysis of data, we are
now ready, in the next chapter, to apply some of these general
methods to cellular components that are not proteins at all.
FURTHER READING
Chapters 12 and 13 in Darzynkiewicz, Chapter 15 in Stewart and Nicholson,
and Chapter 10 in Bauer et al. are all good discussions of intracellular
staining.
Flow Cytometry122

8
Cells from Within:
DNA in Life and Death
In the previous chapters, we have discussed how it is possible to stain
proteins on the surface and inside of cells and then to analyze these
cells for the presence and intensity of that stain. In addition to pro-
tein, another biochemical component that can be used to classify
di¨erent types of cells is, of course, DNA. It should therefore come as
no surprise that ¯ow cytometrists have developed methods for ana-
lyzing DNA content.
FLUOROCHROMES FOR DNA ANALYSIS
By comparison with the ¯uorochromes used for conjugation to anti-
bodies for staining the proteins of cells, DNA-speci®c ¯uorochromes
have important di¨erences. In particular, whereas ¯uorescein, phyco-
erythrin (PE), and others are ¯uorescent whether or not they are
bound to cells, the DNA ¯uorochromes ¯uoresce signi®cantly only
when they are bound to their target molecules. In addition, unlike the
tight binding of antibody to antigen, DNA ¯uorochromes are gener-
ally in loose equilibrium between their bound and free states. There-
fore procedures for analyzing the DNA content of cells involve
sending cells through the ¯ow cytometer without washing them to
remove the ``unbound'' ¯uorochrome. The unbound ¯uorochrome
will not add to background ¯uorescence because it is hardly ¯uores-
cent unless bound to nucleic acid. And washing would, in any case,
lower overall speci®c ¯uorescence by removing much of the ¯uoro-
chrome (both bound and unbound) from the cell.
123
Flow Cytometry: First Principles, Second Edition. Alice Longobardi Givan
Copyright
2001 by Wiley-Liss, Inc.
ISBNs 0-471-38224-8 (Paper); 0-471-22394-8 (Electronic)

Several types of ¯uorescent stain are available for the analysis
of DNA; their characteristics make them suitable for di¨erent
applications (Table 8.1). The most speci®c stains (e.g., DAPI and
the Hoechst dyes, which stain speci®cally for AT groups on DNA)
require the use of a laser with signi®cant ultraviolet (UV) output.
Hoechst dyes as well as a newly developed far-red dye called DRAQ5
(alone of all the current DNA-speci®c stains) also penetrate the outer
TABLE 8.1. Characteristics of Some Nucleic Acid Stains
Stains
Absorption
(nm)
Fluorescence
(nm) Speci®cities
Hoechst 33342 and
Hoechst 33258
346 460 DNA with AT prefer-
ence; Hoechst 33342
enters viable cells
well, Hoechst 33258
less well
DAPI 359 461 DNA with AT prefer-
ence; slightly per-
meant to viable cells
Chromomycin A3 445 575 DNA with GC
preference;
impermeant
Acridine orange 460 (RNA)
480 (DNA)
650 (RNA)
520 (DNA)
DNA and RNA; meta-
chromatic; permeant
to viable cells
Thiazole orange 509 525 DNA and RNA;
permeant
Ethidium bromide 510 595 Double-stranded nucleic
acids; impermeant
Propidium iodide 536 (also UV) 623 Double-stranded nucleic
acids; impermeant
7-Amino-
actinomycin
D (7-AAD)
555 655 DNA and RNA; GC
preference; imper-
meant to viable cells
TO-PRO, TO-TO,
PO-PO, PO-PRO,
YO-YO, and
YO-PRO series
434±747 456±770 DNA and RNA;
impermeant
SYTO series 488±621 509±634 DNA and RNA;
permeant
Flow Cytometry124
membrane of living cells and can therefore be used for staining living
cells with di¨erent DNA content for subsequent sorting for separate
culture or functional analysis. Chromomycin A3 is speci®c for the
GC bases in DNA and therefore is an appropriate stain for use in
conjunction with Hoechst 33258, as will become evident in the dis-
cussion of chromosome techniques. Propidium iodide, although not
very speci®c (it stains all double-stranded regions of both DNA and
RNA by intercalating between the stacked bases of the double helix)
and not able to penetrate an intact cell membrane, has the decided
advantage of absorbing 488 nm light and then ¯uorescing at wave-
lengths above 570 nm. This means that, in the presence of RNase,
propidium iodide can be used as a DNA stain in cytometers with
low-power argon lasers. Propidium iodide has therefore become the
most common DNA ¯uorochrome for ¯ow analysis.
More recently, a series of nucleic acid probes has been developed
by Molecular Probes (Eugene, OR); these probes have an array
of unlikely names (like TO-PRO, YO-YO, and PO-PRO, sounding
something like the three little maids from school in ``The Mikado'')
and also provide a large choice of absorption, emission, and nucleic
acid binding properties. Other ¯uorochromes that absorb 488 nm
light include acridine orange, which is metachromatic; that is, it
¯uoresces red if bound to nonhelical nucleic acid (e.g., RNA or
denatured DNA) and ¯uoresces green if bound to helical nucleic
acid (e.g., native DNA). Acridine orange has been used e¨ectively by
Darzynkiewicz and coworkers to follow the changes in RNA content
and in DNA denaturability that occur during the cell cycle. More-
over, the monoclonal antibody against bromodeoxyuridine (a thymi-
dine analog) can be conjugated to ¯uorescein, and it will then stain
DNA that has incorporated bromodeoxyuridine when cells have been
pulse-fed with this compound during DNA synthesis. Before discus-
sing the uses of these stains for chromosome and cell cycle analysis,
we should ®rst consider the most obvious use of DNA ¯uorochromes:
staining cells for their total DNA content.
PLOIDY
The amount of DNA in the nucleus of a cell (called the 2C or diploid
amount of DNA) is speci®c to the type of organism in question.
DNA in Life and Death 125
Di¨erent species have di¨erent amounts of DNA in their cells (e.g.,
human cells contain about 6 pg of DNA per nucleus; chicken cells,
about 2.5 pg of DNA per nucleus; corn [Zea mays] nuclei, about
15 pg; and Escherichia coli, between 0.01 and 0.02 pg each). How-
ever, within the animal kingdom, with three major exceptions, all
healthy cells in a given organism contain the same amount of DNA.
The three major exceptions are, ®rst, cells that have undergone
meiosis in preparation for sexual reproduction and therefore contain
the 1C or haploid amount of DNA typical of a gamete; second, cells
that are carrying out DNA synthesis in preparation for cell division
(mitosis) and therefore for a short period contain between the 2C
amount of DNA and twice that amount; and third, cells that are
undergoing apoptosis and have begun to loose pieces of fragmented
DNA. (There are other less common exceptions as well: For exam-
ple, liver cells exist as normal tetraploids, and multiploidy is the rule
rather than the exception in plant cells.) Because healthy, normal
animal cells from a given individual, with these three major and other
minor exceptions, contain the same amount of DNA, measurement
of the DNA content of cells can be used to identify certain forms of
abnormality. More speci®cally, the type of abnormality commonly
termed malignancy is often associated with genetic changes, and these
genetic changes may sometimes be re¯ected in changes in total DNA
content of the malignant cell.
It is possible to permeabilize the outer membrane of normal cells
(with detergent or alcohol) in order to allow propidium iodide to
enter the nuclei. If we then treat the normal cells with RNase in order
to ensure that any ¯uorescence results from their DNA content
(without a contribution from double-stranded RNA), we ®nd that the
nuclei ¯uoresce red with an intensity that is more or less proportional
to their DNA content. By the use of a red ®lter and a linear ampli®er
on the photomultiplier tube, we can detect that red ¯uorescence. The
channel number of the ¯uorescence intensity will be proportional to
the DNA content of the cells. The method is simple and takes about
10 minutes. Flow cytometric analysis of the red ¯uorescence from the
particles in this preparation of nuclei from normal, nondividing cells
will result in a histogram with a single, narrow peak (see the ®rst
histogram in Fig. 8.1); all the particles emit very nearly the same
amount of red ¯uorescence. This supports our knowledge that all
Flow Cytometry126
normal, nondividing nuclei from any one organism contain the same
amount of DNA.
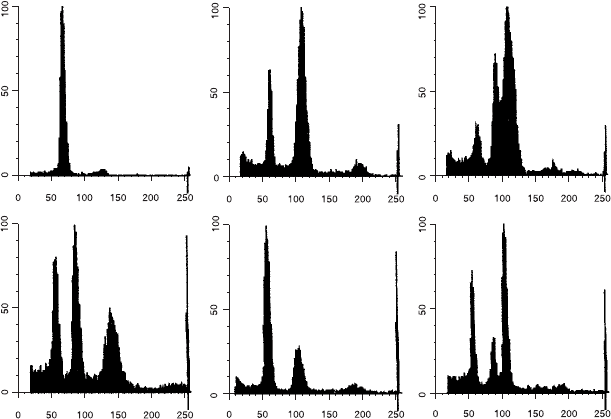
If we then look at a preparation of material from malignant tissue,
we ®nd that the ¯uorescence histogram often indicates the presence of
cells with the ``wrong'' amount of DNA, as well as cells with the
amount of DNA that is normal for the organism in question. The
normal cells are said to be euploid or normal diploid, and the abnor-
mal cells are termed aneuploid or DNA aneuploid (¯ow cytometrists
have hijacked these terms from cytologists and use them to refer to
total DNA content of cells; cytologists feel that the use of the euploid/
aneuploid classi®cation is ambiguous unless chromosomes have been
counted). Histograms from examples of some malignant tissues are
shown in Figure 8.1. The abnormal peak or peaks may have more or
less DNA than normal cells (hyperdiploid or hypodiploid). Because
our basic axiom is that all normal cells from an organism contain the
same amount of DNA, any tissue that yields a DNA ¯ow histogram
Fig. 8.1. Propidium iodide ¯uorescence histograms from nuclei of cells aspirated
from normal tissue (upper left) and malignant breast tumors. Data courtesy of Colm
Hennessy.
DNA in Life and Death 127
with more than one peak contains, by de®nition, abnormal cells. Flow
cytometry is therefore a quick and straightforward method for mea-
suring the particular type of pathology that results in cells with ab-
normal DNA content.
In the 1980s, at the same time that scientists were beginning to
realize that changes in the total DNA per nucleus could be measured
by ¯ow cytometry and that this could be an indicator of the presence
of abnormal tissue, David Hedley in Australia discovered that when
®xed tumors embedded in para½n blocks were de-waxed and rehy-
drated, released nuclei could be analyzed by ¯ow cytometry for DNA
content. Although the absolute ¯uorescence intensity of propidium
iodide±stained nuclei released from ®xed material was lower than
that from fresh material, the patterns revealed in the ¯ow histograms
were similar. The ®nding that material from para½n blocks could be
used to analyze DNA content (ploidy) of the individual cells had two
important consequences. A very large amount of archival clinical
material was suddenly amenable to DNA analysis, and because some
of the archival material was 5, 10, and 20 years old, long-term clinical
follow up of the patients was immediately available.
The correlation of DNA ¯ow histograms with prognosis became
a quick and simple proposition. As a result of Hedley's technique,
the corridors in hospitals all over the world were suddenly ®lled
with swarms of young clinicians beating paths to the doors of their
pathology departments (and then on to the ¯ow cytometry facilities).
An enormous number of publications emerged from the use of this
technique on many di¨erent types of human material. Aware of the
risk of overgeneralization and without the time or space in this book
for a full discussion of clinical correlations, I can probably safely say
here that most (but not all) of the published results showed a corre-
lation between abnormal ¯ow histograms (aneuploidy) and unfavor-
able prognosis. Furthermore, many of the publications also showed
that ¯ow histograms provide information about prognosis over and
above that provided by other, more traditional prognostic indicators.
Although the use of DNA ¯ow histograms to diagnose aneuploidy
is both easy and rapid, it does have certain drawbacks that should be
made clear. The ®rst drawback results from the nature of malignant
changes themselves: Not all malignancies will result from DNA
changes that are detectable by a ¯ow cytometer. Current knowledge
of the causes of malignancy is far from perfect. Nevertheless, it is
Flow Cytometry128
possible to imagine that some malignancies may result from changes
that are not related to DNA, and other malignant changes may
a¨ect a cell's DNA but not in a way that could ever be detected in a
¯ow histogram of propidium iodide ¯uorescence. For example, chro-
mosome translocations may lead to gross abnormalities in genetic
coding, but do not lead to any change at all in the total DNA content
of a nucleus. Translocations can be detected easily by microscopic
analysis of the individual banded chromosomes in a mitotic spread,
but translocations will never be detected by ¯ow cytometry of nuclei
stained with propidium iodide. Whereas extra copies (e.g., trisomy) of
a large chromosome may result in a measurable shift in the total
DNA content of a nucleus, trisomy of a small chromosome may not
be detectable in this type of ¯ow analysis (a large chromosome might
contain 4% of a cell's total DNA, but a small chromosome has less
than 1%). Similarly, small insertions or deletions to chromosomes
may lead to changes in DNA content that are too small to be detected
by ¯ow cytometry. Any change resulting in less than 3±5% di¨erence
in total DNA content may be di½cult to detect by ¯ow cytometry,
although, to a geneticist, a 3% deletion or insertion involves a large
number of base pairs with a potentially enormous amount of mis-
placed genetic information.
While this ®rst kind of di½culty is an intrinsic limitation of the DNA
¯ow histogram technique, a second problem is more in the nature of a
continuing question about interpretation. Although Figure 8.1 shows
examples of histograms that provide undoubted evidence of abnor-
mality, Figure 8.2 shows another series of histograms that are con-
siderably more di½cult to interpret because of problems arising with
so-called wide coe½cient of variation (CV) data. The real question
concerns our ability to rule out the existence of near-diploid abnor-
malities when the width (CV) of a peak is very broad. In theory, be-
cause all normal nuclei contain the same amount of DNA, the peak
in a ¯ow histogram of normal cells should have the width of only a
single channel (all the particles should have the same ¯uorescence
intensity and should appear in the same channel). In practice, because
staining and illumination conditions will not be exactly uniform,
the ¯uorescence intensities of normal nuclei stained with propidium
iodide have a certain range of values. One of the ways in which
otherwise quite civilized ¯ow cytometrists compete with each other is
by bragging about the small CVs on the peaks of their DNA histo-
DNA in Life and Death 129