Givan A.L. Flow Cytometry. First Principles
Подождите немного. Документ загружается.

log ampli®er had been set to give us 4 log decades for the full scale,
then a signal in channel 700 would come from a cell that is 100 times
brighter than a cell giving a signal in channel 188 (on a 4 decade
scale, every 256 channels represent a 10-fold increase in intensity; 512
channels represent a 10
2
-fold increase; the entire 1024 channels rep-
resent a 10
4
-fold increase). If we had been using a linear ampli®er,
then a signal in channel 700 would represent a cell 3.72 times brighter
than one with a signal in channel 188 (700/188 3:72).
These examples should serve to emphasize that the numerical
``read out'' from a ¯ow cytometer is relative and user-adjustable. A
knowledge of instrument electronics and the settings used is required
if we really want quantitative information about the relative bright-
ness of signals from di¨erent cells; a simple channel number is not
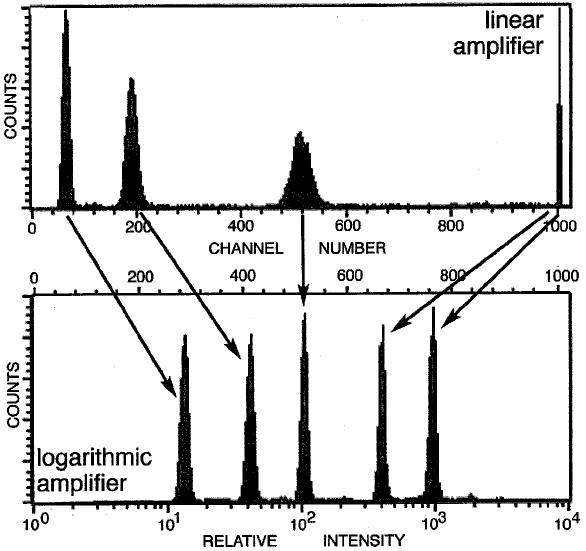
really enough. As an example, Figure 3.11 indicates real data (com-
pare with Fig. 3.9 of model data) acquired with a mixed suspension
of the same set of particles (beads of ®ve di¨erent intensities) but with
two di¨erent electronic settings (a linear ampli®er in the histogram
above and a log ampli®er below). The channel numbers for the ®ve
peaks and the distribution of the peaks across the 1024 channels are
very di¨erent in the two cases (next time you run beads or cells on a
cytometer, try this yourself ).
One other capability we have with cytometry electronics is the
de®nition of a threshold. An electronic threshold is just like a thresh-
old into a room: It de®nes an obstacle. Only cells giving signals
greater than that obstacle will be registered on the cytometer ADC.
The most common use of this threshold is in the de®nition of a for-
ward scatter channel number. Only cells with a forward scatter signal
brighter than the de®ned channel threshold will be registered by the
cytometer. With the use of a forward scatter threshold, we can avoid
problems that might come from dust, debris, and electronic noise in
the system. The dim forward scatter signals from debris and noise
are not bright enough to pass over the threshold, and ``particles'' of
this type would be completely ignored. There are other ways of using
a threshold (for instance, by using a red ¯uorescence threshold to
exclude from an ocean water sample the signals from any particles
that do not contain chlorophyll), but the use of a forward scatter
threshold is by far the most common. Thresholds should be used with
care; setting the threshold level too high can hide important data and
can even make you think that you have no cells in your sample.
Instrumentation 37
By now, we should have a reasonably clear picture of the physical
and electronic characteristics that form the basis for ¯ow cytometric
analysis. We have followed cells into the center of a stream ¯owing
through a nozzle into a light path; we have seen how re¯ection, refrac-
tion, and ¯uorescence can generate light signals from those cells as
they are hit by that light beam; we have accounted for registering of
the light emerging from the cells onto one or another photodetector
depending on the color or direction of that emerging light and the
®lters in front of the individual photodetectors; and we have de-
scribed the way that the intensities of the light from cells registered
Fig. 3.11. Intensity signals from ¯uorescent beads (of ®ve di¨erent intensities)
acquired with linear ampli®cation (top) and logarithmic ampli®cation (bottom). Log
ampli®cation permits all ®ve intensities to be ``on scale'' (that is, within the 1024
channel range). Additionally, the spread (the CV) and the peak height of the dis-
tributions for each bead are visually similar with a log but not with a linear ampli-
®er. From Givan (2001).
Flow Cytometry38
on each photodetector can be assigned to the discrete channels (1024)
of an ADC. Therefore, for each cell that has ¯owed past the illumi-
nating beam, we now have, simply, four or ®ve or more numbers
(depending on the number of photodetectors present) that describe
that cell. Those four or ®ve numbers (each on a scale of 0 to 1023)
tell us the intensity of the FSC, SSC, and ¯uorescence (red, green,
orange, and so forth) from that cell. Those numbers are, quite simply,
the only information we now have about that cell. These are the
facts that can be correlated with each other for data analysis. What
we now do with the numerical data is up to the computer software
and hardware available.
FURTHER READING
Chapter 2 in Melamed et al. and Chapters 1 and 4 in Shapiro are good
general descriptions of cytometer characteristics.
Chapter 3 in Melamed et al. and Chapter 3 in Van Dilla et al. discuss
hydrodynamics and ¯ow chamber design in depth.
Chapter 2 in Watson has a good discussion of ¯uid ¯ow dynamics and of the
avoidance of coincidence events.
Chapter 5 in Darzynkiewicz covers ¯ow cytometric optical measurements in
general.
Instrumentation 39

4
Information:
Harnessing the Data
DATA STORAGE
Having left our ¯ow cytometry system with light signals from a single
cell recorded in appropriate channels on the analog-to-digital con-
verter (ADC), we are now faced with the prospect of losing all these
data as soon as we start recording data from our next cell. What is
required is a way to store the data permanently for later correlation
and analysis at our leisure. At this point we leave cytometry sensu
stricto and ®nd ourselves in the realm of computer ware (soft and
hard).
The main challenge encountered with storage of data from ¯ow
cytometry arises from the ability of a ¯ow system to generate large
amounts of data very quickly. In a four-parameter con®guration
(four photodetectors), each particle ¯owing past the light beam gen-
erates four signals. If we want to analyze 10,000 cells from each
sample (this sounds like a lot to someone used to microscopy, but
¯ow cytometrists can analyze 10,000 cells in, say, 10 seconds, and
therefore are easily persuaded that a large number of cells gives
statistically better information), then each sample that is run through
the ¯ow cytometer will generate 40,000 numbers. If each of those
numbers covers the range of 0±1023, then 10 bits (2
10
1024) of in-
formation are required to specify each of those numbers. Because bits
come in packets of 8 (and 8 bits are known as one ``byte''), we need
two bytes of storage space to specify the intensity of each parameter.
This comes to 80,000 bytes for a ®le that describes four parameters
about each of 10,000 cells (plus a few extra bytes for housekeeping
41
Flow Cytometry: First Principles, Second Edition. Alice Longobardi Givan
Copyright
2001 by Wiley-Liss, Inc.
ISBNs 0-471-38224-8 (Paper); 0-471-22394-8 (Electronic)

arrangements). A six-parameter cytometer will generate proportion-
ally more data, that is, 120,000 bytes from that same sample.
Therefore (staying with our downmarket four-parameter data ®le),
the information from just seventeen 10,000-cell samples will ®ll a 1.4
MB ¯oppy disk. Floppy disks are readily available and may be the
answer to data storage problems if the experiments are small; they
will be an expensive and cumbersome answer if the experiments are
large. Although all ¯ow cytometrists start out with small experi-
ments, most progress rapidly to experiments with 20 or 30 or more
samples (think of using 96 well microtiter plates for processing cells).
In fact, one of the surest rules of ¯ow cytometry (a rule even better
known to imaging scientists) is that data will, in less time than pre-
dicted, ®ll all available storage capacity. When you ®nd yourself
continually running out of ¯oppy disks, you will begin to try to think
of other options for data storage. The other options for ¯ow cytometry
data storage are just the same as for any other kind of computer data
storage: These options change with time, but currently include, for
example, hard drives, zip cartridges, and CD-ROMs (Table 4.1).
Options at any given computer will be determined or limited by the
peripheral hardware available, but most systems will have a large-
TABLE 4.1. The Number of Flow Data Files (10,000 Cells/4-Parameter
Data/1024-Channel Resolution) that Can Be Stored to Various Types of Mediaa
Medium Capacity Cost (US$)
Cost per MB
(US$)
Number of ®les
per disk
Floppy disks 1.4 MB $0.50 $0.36 17
Zip cartridges 100 MB
250 MB
$10
$15
$0.10
$0.06
1,250
3,125
Jaz cartridges 1 GB $100 $0.10 12,500
Hard drives 10 GB
50 GB
$300
$1200
$0.03
$0.02
125,000
625,000
CD-ROMs 600 MB $1 $0.0017 7,500
a The ``number of ®les per disk'' is given as the number of samples (of 10,000 cells each) whose
list mode data (4-parameter/1024-channel resolution) after acquisition can be stored to media of
the indicated size. The capacity in bytes of the di¨erent media is representative but will vary
with the formats of di¨erent computing systems. Similarly, di¨erent acquisition software will
require more or less extra storage space for the housekeeping information that is stored with
each sample. Prices of media are illustrative, but will vary considerably from place to place and
over time.
Flow Cytometry42
capacity hard drive, which might store the information from many
samples. Although increasingly inexpensive, hard drives have two
main drawbacks. The ®rst is that you cannot take them home with
you, and therefore someone else who has access to the system can
trash your data (and, given enough time, probably will do just that).
The second problem with a hard drive is derived from that rule about
data ®lling all available storage capacity: No matter how large the
capacity of the hard drive, it will become full sooner than expected.
The solution to both of these problems is to have removable back-
up capability. This back-up device could consist of zip cartridges or
¯oppy disks; both of these options are appropriate for immediate
data storage. For long-term archiving, the least expensive (and slow-
est) option is computer tape. Recordable CD-ROMs currently com-
bine low cost, moderate speed, and a reputation for stability; the
price of rewritable CD-ROM burners has come down, but generally
this medium has been used for permanent archiving on write-once
disks. For example, when six zip cartridges have been ®lled, their
data could be transferred permanently to a CD-ROM and the zip
cartridges re-used. Considerations in choice of medium will involve
the cost of the medium, the cost of the drive, the speed of writing and
accessing the data, and, importantly, the convenience of organizing
data ®les on disks of various sizes. With any luck, you will have
backed your data from the hard drive to the removable medium of
choice and will have the data safely in your pocket when someone
``accidentally'' clears the system. For these reasons, back-up capabil-
ity of some type is especially necessary for multiuser ¯ow cytometers.
DATA ANALYSIS
Now that data have been stored, we come to analysis, which is the
real point of everything we have done so far. Methods for data
analysis vary. They vary with the inclinations of the software pro-
grammer; they also vary with the budget of the cytometer facility.
They may be strictly commercial, or they may be homemade. These
days, commercial manufacturers of cytometers compete with each
other on the basis of their software systems as much as on the basis of
their cytometer technology. In addition, independent entrepreneurs,
with increasing frequency, have begun to program for analysis of
Harnessing the Data 43
¯ow data and have successfully entered into the commercial market.
Moreover, there are people (for example, various scientists at the Los
Alamos Labs in New Mexico or Joe Trotter at the Scripps Research
Institute, San Diego, California) who have developed ¯ow analysis
software that they distribute without charge. It is increasingly true
that the software available for analysis plays a large role in what the
user sees as an acceptable cytometer package. Samples may be run
through a cytometer and the information from those particles stored
very quickly; analysis and re-analysis of that information may then
require a great deal of time. Therefore, it is not surprising that soft-
ware is an important aspect of ¯ow cytometry.
In theory, data from all ¯ow cytometry systems are now stored in
so-called ¯ow cytometry standard (FCS) format. This means that,
although data stored after acquisition on one cytometer may not
be analyzable on software from another cytometer (because manu-
facturers have been discouragingly slow at fully embracing the stan-
dard), the format is one that can be learned, and, in principle, anyone
with good programming skills could write software for analysis of
¯ow cytometry data. The FCS format also means that independent
programmers can and do write programs that will handle data ac-
quired on any cytometer. In practice, most people use commercial
packages for data acquisition and storage because these packages are
commonly purchased along with the cytometer. Although the same
packages provide methods for data analysis, there are times when
additional analysis software from an independent source may be help-
ful. This might be to provide advanced analysis methods, to provide
especially pretty pictures for slides and publication, to store data to a
database, or to allow analysis on one or another home computing
system.
The data stored in FCS format are usually ``list mode'' data. As
described above, this means that, in a four-parameter cytometer, four
numbers are stored for each cell. A 10,000 cell data ®le will consist of
a long list of 40,000 numbers, with each set of four numbers describ-
ing each cell in the sequence in which it passed through the laser
beam. By retrieving the stored data, each cell can be analyzed again,
and the intensity of each of the four signals for that cell will be
known and can be correlated with each other or with the intensity of
the four signals from any (or all) other cell(s). This type of list mode
Flow Cytometry44
data is useful because no cytometric information has been lost, and it
can all be examined again in future computer analyses.
There are other types of data storage that have the advantage of
requiring less storage space. So-called single-parameter data storage
involves the storage of the intensity pro®les for the population of cells
in a sample for each parameter separately; the only information
stored is, for example, the distribution of forward scatter signal in-
tensities for the cells in the sample; the distribution of side scatter
signal intensities for the cells in the sample; the distribution of red
¯uorescence signal intensities for the cells in the sample; and the dis-
tribution of green ¯uorescence signal intensities for the cells in the
sample. In this case, however, no information has been stored about
whether the bright green cells are the cells that are bright red or
whether they are the cells that are not red. With this kind of storage,
we will not know whether the cells with a bright forward scatter
signal are red or green or both red and green. Therefore, if we have
stored data as single-parameter information, we tie up little storage
capacity but we severely restrict our options for future analysis.
Unless storage capacity is very limited and the information required
from data analysis is also very limited, list mode data storage is by
far the best and indeed the only recommended option. Another rule
about ¯ow cytometry data analysis is that you are always going
to want more information out of a sample than you thought was
required when you planned and carried out the experiment. So use
list mode data storage unless there is a very good reason for doing
otherwise.
Having stored list mode data for all the particles in a sample,
software allows the correlation of the data in all possible directions.
We can readily look at any one parameter in isolation and analyze
the light intensity histogram from the cells in a sample with respect to
that parameter. Because we have stored the channel numbers char-
acterizing the signals from each cell, the software can plot a histo-
gram (number of cells at each channel as in the height histogram; see
Fig. 3.10) with all the cells placed according to the channel number
characterizing the intensity of their signals. In this way we could look
at the intensity distribution of, for example, green ¯uorescence signals
from 10,000 cells in one sample. And then we could look at the in-
tensity distribution of red ¯uorescence signals from the same 10,000
Harnessing the Data 45
cells. We can, in fact, generate a histogram for each of the parameters
measured. Some software will plot data according to channel number;
other software will convert the channel data and use a ``relative
intensity'' scale (think of the upper and lower horizontal axes in Fig.
3.9). In the latter case, the software is making assumptions about the
accuracy, linearity, and ampli®cation gain on the photodetectors.
Once we have plotted the histogram distribution (number of cells on
the y-axis at each de®ned light signal intensity on the x-axis), the
software will allow us to analyze this distribution to extract certain
kinds of information: for example, what percentage of the cells fall
within a speci®ed intensity range, what the most common intensity
(channel number) is for the group of cells (the ``mode'' channel),
what the mean intensity channel is for the group of cells, or what the
median intensity is for that group (Fig. 4.1).
Just how these values are obtained will vary with the particular
software in question. ``Cursors'' or ``markers'' can be used to de®ne
regions of intensity that may be of interest. For example, we could
place a cursor so that it separates the low-intensity range of green
¯uorescence from the high-intensity range of green ¯uorescence, and
we could then ask how many cells fall within the high-intensity range.
A value for the percentage of positively stained cells can be deter-
mined by placing a cursor at a position de®ned by the background
¯uorescence of unstained cells. By convention at the 1±3% level (that
is, at an intensity that clips the bright edge of the unstained cells and
makes 1±3% of them ``positive''), this kind of cursor is usually the best
way to describe a mixed population that consists of both unstained
cells and brightly stained cells.
If we are, on the other hand, concerned with the changing ¯uores-
cence intensity of a uniform population of cells, we would be better
served by using mode or median or mean characteristics of that
population (the use of a ``percent positive'' value is, in fact, highly
misleading if we are looking at a population of cells that are uni-
formly but dimly ¯uorescent). The mode value, being simply the
channel number describing the intensity of the most frequent group
of cells (the peak of the histogram), may vary erratically and be
poorly reproducible if the population distribution is very broad. The
mean value will be incorrect if signi®cant numbers of cells are in the
highest channel (255 or 1023) or lowest channel (0) of the histogram.
The median value for the population is most reproducible because it
Flow Cytometry46
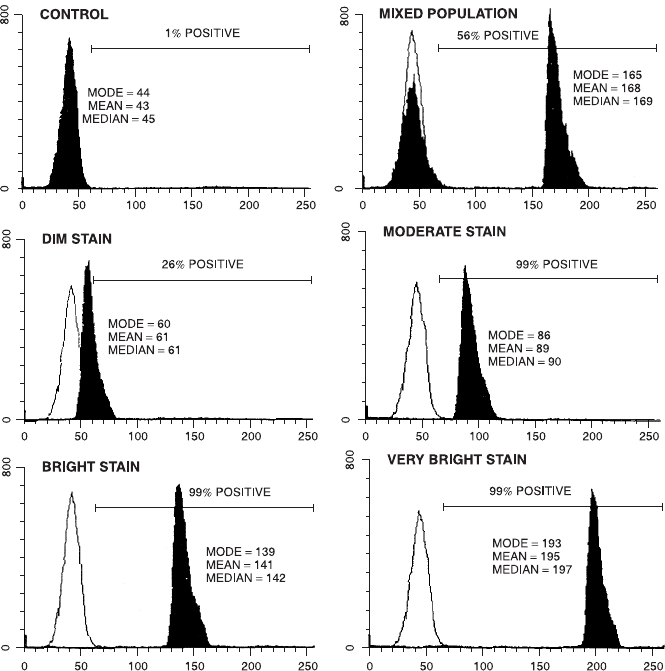
Fig. 4.1. Methods for describing the histogram distribution of signal intensities from
a population of cells. The plots show the number of cells on the vertical axis against
channel numbers (related to scatter or ¯uorescence intensity) on the horizontal axis.
Control (unstained) cells are indicated as the clear distributions overlayed with the
black distributions from the stained cells. If cursors or markers are placed to delin-
eate a region of positive intensity (relative to the 1% level on an unstained control),
the ``% positive'' value can usefully describe a mixed population of stained and
unstained particles. This value will be misleading if used to describe a uniform
population of dimly stained cells. The ``mode,'' ``mean,'' or ``median'' channel num-
ber can be used to compare uniform populations of cells of varying ¯uorescence
intensity.
Harnessing the Data 47