Griffiths D. Head First Statistics
Подождите немного. Документ загружается.


you are here 4 381
We interrupt this chapter to bring you...
Hello, and welcome back to Who Wants
To Win A Swivel Chair, Statsville’s favorite
quiz show. We’ve got some more fiendishly
difficult questions on tonight’s show.
382 WHO WANTS TO WIN A SWIVEL CHAIR
We’ve got some more great questions lined
up for you today, so let’s get on with the show. In
this round I’m going to ask you forty questions, and you
need to get thirty or more right to get through to the
next round. Or you can walk away and take a consolation
prize. For each question there are four possible answers.
The title of this round is “Even More About Me.”
Good luck!
Here are the first five questions for Round Two.
The questions are all about the game show host.
D: $4,000
B: $2,000
C: $3,000
3. On average, how much does he spend on suits each month
A: $1,000
D: Bird on a Wire
B: Curse of the Were-Rabbit
C: Mousehunt
2. What is the favorite film of his cat
A: A Fish Called Wanda
D: All the President’s Men
B: The Italian Job
C: Lawrence of Arabia
1. What is his favorite film
A: The Day of The Jackal
D: Four times a month
B: Twice a month
C: Three times a month
4. How often does he have his hair cut?
A: Once a month
D: www.starbuzzcoffee.com
B: www.gregs-list.net
C: www.you-cube.net
5. What is his favorite web site
A: www.fatdanscasino.com

you are here 4 383
How would you find the probability of getting at least 30 out of
40 questions correct? What steps would you need to go through
to get the right answer? How would you find the mean and
variance?
We’re not asking you to find the probability—just say how you’d
go about finding it.
Should we play, or walk away?
As before, it’s unlikely you’ll know the game show host well enough to
answer questions about him. It looks like you’ll need to give random
answers to the questions again.
So what’s the probability of getting 30 or more questions right out of 40?
That will help us determine whether to keep playing, or walk away.

384 WHO WANTS TO WIN A SWIVEL CHAIR
How would you find the probability of getting at least 30 out of
40 questions correct? What steps would you need to go through
to get the right answer? How would you find the mean and
variance?
We’re not asking you to find the probability—just say how you’d
go about finding it.
There are 40 questions, which means there are 40 trials. The outcome of each trial can be a success or failure,
and we want to find the probability of getting a certain number of successes. In order to do this, we need to use
the binomial distribution. We use n = 40, and as each question has four possible answers, p is 1/4 or 0.25..
If X is the number of questions we get right, then we want to find P(X > 30). This means we have to calculate
and add together the probabilities for P(X = 30) up to P(X = 40).
We can find the mean and variance using n, p and q, where q = 1 - p. The mean is equal to np, and the variance is
equal to npq. This gives us a mean of 40 x 0.25 = 10, and a variance of 40 x 0.25 x 0.75 = 7.5.
But doing all of those
calculations is going to be
horrible. Isn’t there an
easier way?
Using the binomial distribution can be a lot of work.
In order to find the probability that we answer 30 or more questions
correctly, we need to add together 11 individual probabilities. Each of
these probabilities is tricky to find, and it would be very easy to make a
mistake somewhere along the way.
What we really need is an easier way of calculating binomial
probabilities.
you are here 4 385
Wouldn't it be dreamy if there was a
way of making other distributions as easy
to work with as the normal? But I know it's
just a fantasy…

386 WHO WANTS TO WIN A SWIVEL CHAIR
Normal distribution to the rescue
We’ve seen that life with the binomial distribution can be tough at times. Some of
the calculations can be tricky and repetitive, which in turn means that it’s easy to
make mistakes and spend a lot of time only to come up with the wrong answer.
Sound hopeless? Don’t worry, there’s an easy way out.
In certain circumstances, you can use the normal distribution to approximate the
binomial distribution.
You’re saying the normal
distribution can approximate
the binomial? I thought the
Poisson did that. What gives?
The Poisson distribution can approximate the binomial in
some situations, but the normal can in others.
Knowing how to approximate the binomial distribution with other distributions is
useful because it can cut down on all sorts of complexities, and in some situations
the Poisson distribution can help us work out some tricky binomial probabilities.
In certain other circumstances, we can use the normal distribution to approximate
the binomial instead. There are some huge advantages with this, as it means that
instead of performing calculations, we can use normal probability tables to simply
look up the probabilities we need.
All we need to do is figure out the circumstances under which this works.
It’s been a while since we looked at how we could use the
Poisson distribution to approximate the binomial. Under what
circumstances is it appropriate?
B(n, p) can be approximated by the Poisson when n > 50 and p < 0.1.
you are here 4 387
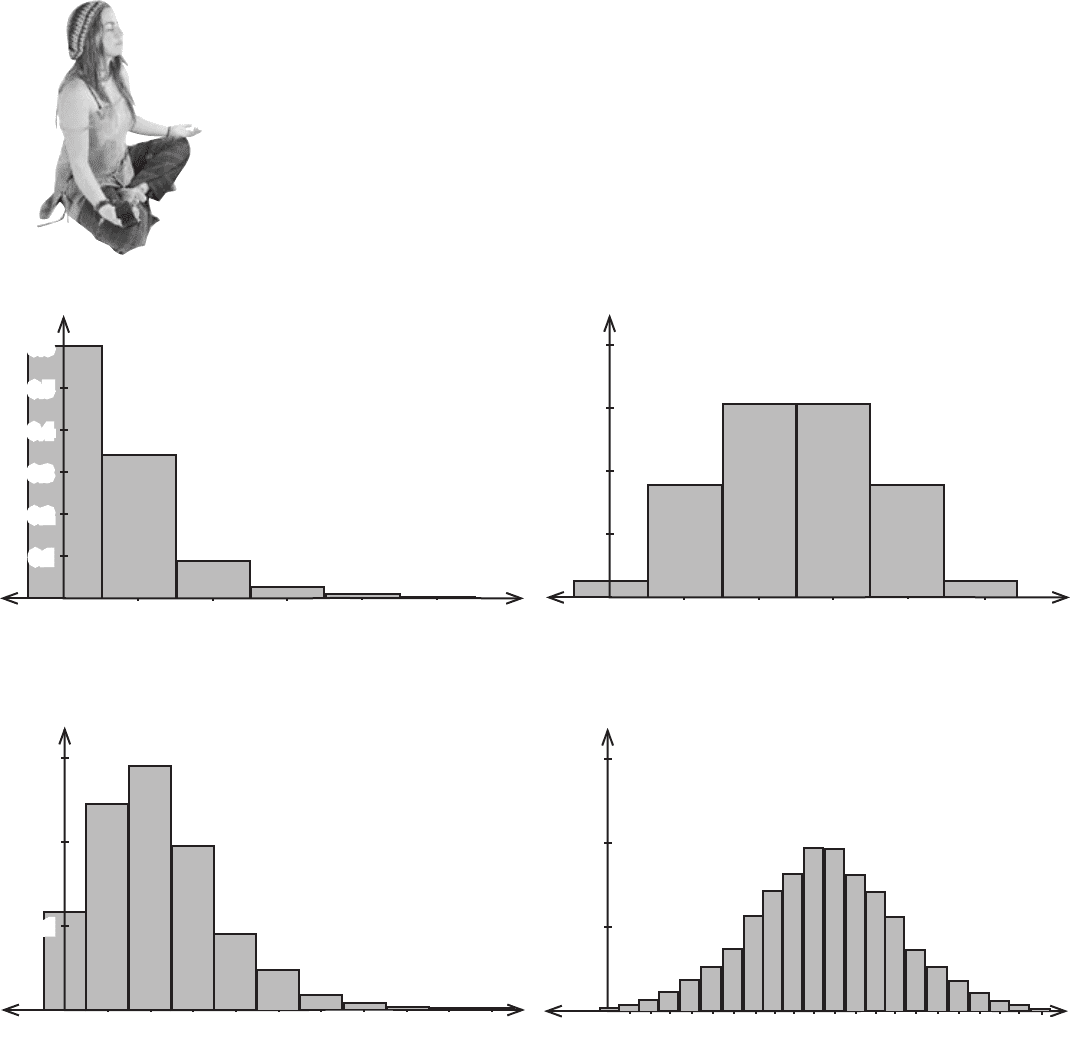
BE the Distribution
Below you’ll see some binomial
distributions for different values of n
and p. Your job is to play like you’re
the distribution and say
which one you think can best
be approximated by the normal.
Take a good look at the shape of
each distribution and say which
one is most normal.
n = 5
p = 0.1
1 2
3
4 5
0.2
0.1
0.3
0.4
0.5
0.6
0
n = 5
p = 0.5
1 2
3
4
0.2
0.1
0.3
0.4
0
5
n = 20
p = 0.1
1 2 3 4
0.2
0.1
0.3
0
5 6 7
8 9 10
1715131110 12973 5
n = 20
p = 0.5
2 4 6 8
0.2
0.1
0.3
0 14 16 18 201 19
21
388 WHO WANTS TO WIN A SWIVEL CHAIR
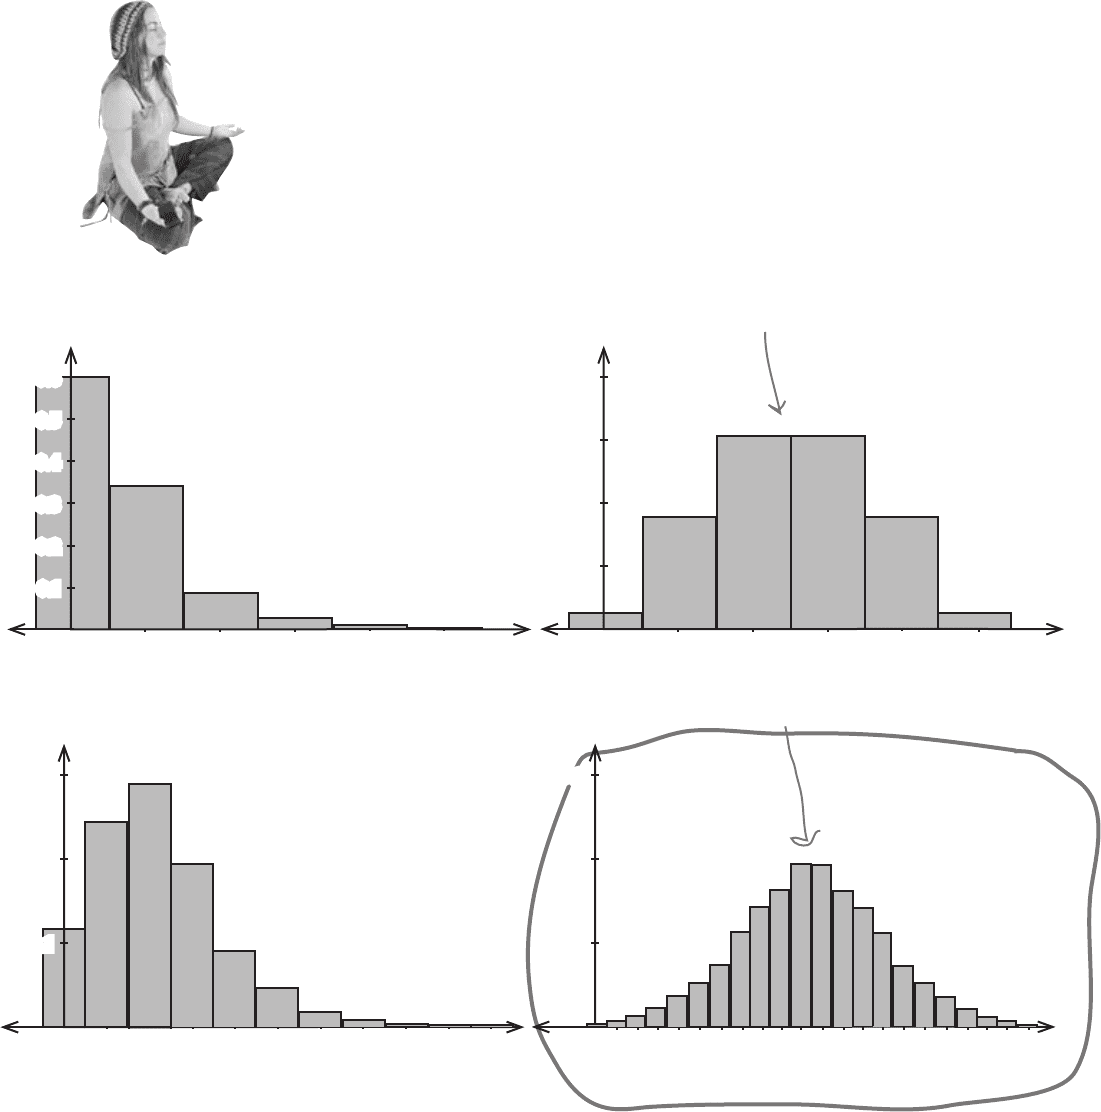
BE the Distribution Solution
Below you’ll see some binomial
distributions for different values of n
and p. Your job is to play like you’re
the distribution and say which
one you think can best be
approximated by the normal.
Take a good look at the shape of
each distribution and say which
one is most normal.
Out of all these distributions, this is the one that can best be
approximated by the normal distribution. When n = 20 and p = 0.5,
the shape of the distribution is very similar to that of the normal.
This distribution is symmetrical, but it’s
difficult to pick out a smooth bell-shaped
curve. It’s unlikely that using the normal
distribution to approximate this would be
accurate enough.
n = 5
p = 0.1
1 2
3
4 5
0.2
0.1
0.3
0.4
0.5
0.6
0
n = 20
p = 0.1
1 2 3 4
0.2
0.1
0.3
0 5 6 7 8 9 10
n = 5
p = 0.5
1 2
3
4
0.2
0.1
0.3
0.4
0
5
1715131110 12973 5
n = 20
p = 0.5
2 4 6 8
0.2
0.1
0.3
0 14 16 18 201 19
21
you are here 4 389
Under certain circumstances, the shape of the binomial distribution looks
very similar to the normal distribution. In these situations, we can use the
normal distribution in place of the binomial to give a close approximation of its
probabilities. Instead of calculating lots of individual probabilities, we can look up
whole ranges in standard normal probability tables.
So under what circumstances can we do this?
We saw in the last exercise that the binomial distribution looks very similar to the
normal distribution where p is around 0.5, and n is around 20. As a general rule,
you can use the normal distribution to approximate the binomial when np and nq
are both greater than 5.
Finding the mean and variance
Before we can use normal probability tables to look up probabilities, we need to know what the
mean and variance is so that we can calculate the standard score. We can take these directly from
the binomial distribution. When we originally looked at the binomial distribution, we found that:
μ = np and σ
2
= npq
We can use these as parameters for our normal approximation.
Approximating the Binomial Distribution
If X ~ B(n, p) and np > 5 and nq > 5, you can use X ~ N (np, npq) to
approximate it.
Vital StatisticsVital Statistics
When to approximate the binomial distribution with the normal
Some text
books use a
criteria of
np > 10 and
nq > 10.
If you’re taking a statistics
exam, make sure you
check the criteria used by
your exam board.
n is the number of values,
p is the probability of
success, and q is 1 - p.
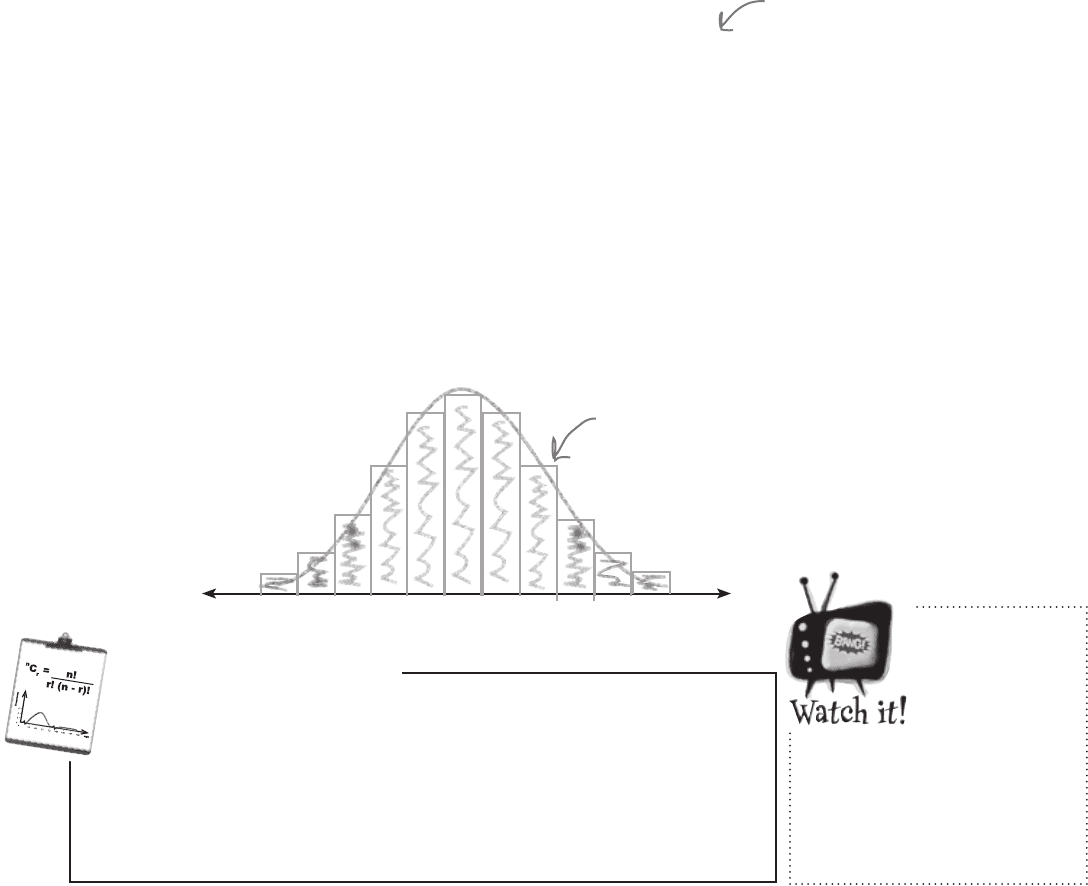
We can use the normal distribution to
approximate binomial probabilities when np
and nq are both greater than 5. These
values of n, p, and q give us a nice, smooth
shape that’s pretty close to the normal.
np
npq

390 WHO WANTS TO WIN A SWIVEL CHAIR
Before we use the normal distribution for the full 40 questions for Who Wants To Win A Swivel
Chair, let’s tackle a simpler problem to make sure it works. Let’s try finding the probability that
we get 5 or fewer questions correct out of 12, where there are only two possible choices for
each question.
Let’s start off by working this out using the binomial distribution. Use the binomial distribution
to find P(X < 6) where X ~ B(12, 0.5).