Griffiths D. Head First Statistics
Подождите немного. Документ загружается.

you are here 4 461
estimating populations and samples
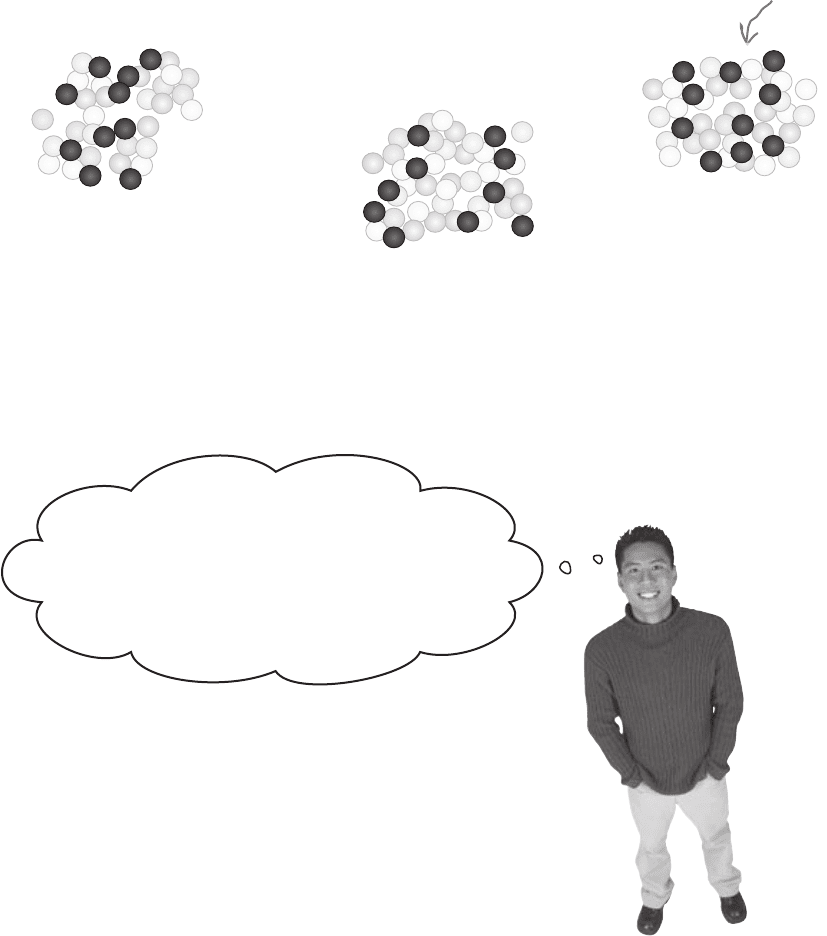
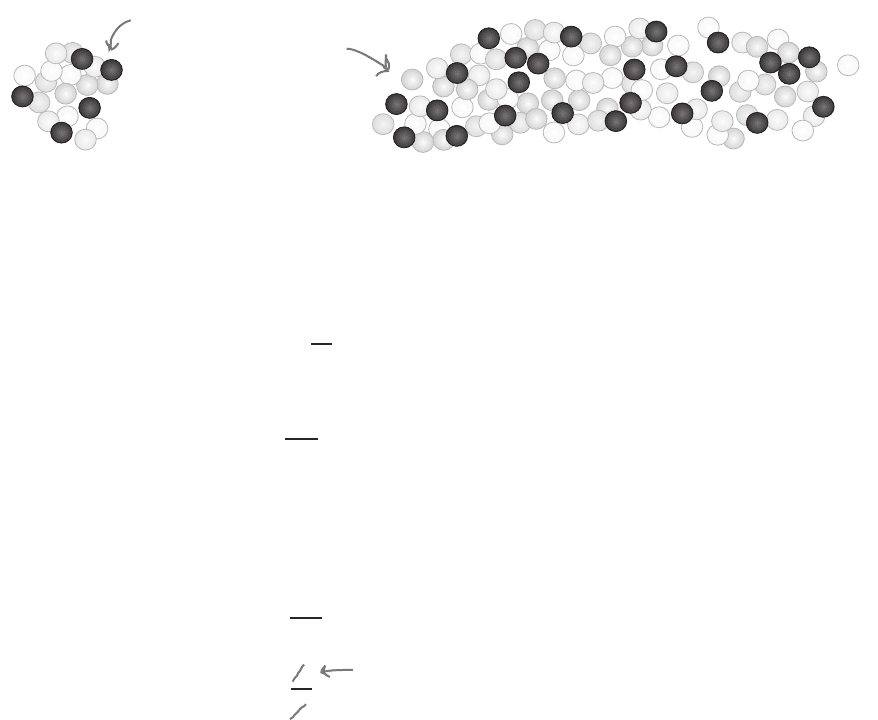
There are many possible samples we could have taken of size n. Each
possible sample would comprise n gumballs, and the number of red
gumballs in each would follow the same distribution. For each sample, the
number of red gumballs is distributed as B(n, p), and the proportion of
successes is given by X/n.
Each sample contains
n elements, just like
the previous one.
Different samples
X ~ B(n, p)
P
s
= X/n
We can form a distribution out of all the sample proportions using all of the
possible samples. This is called the sampling distribution of proportions,
or the distribution of P
s
.
X ~ B(n, p)
P
s
= X/n
X ~ B(n, p)
P
s
= X/n
I get it. The sampling distribution of proportions
is really a probability distribution made up of
the proportions of all possible samples of size
n
.
If we know how the proportions are distributed,
we’ll be able to use it to find probabilities for the
proportion of one particular sample.
Using the sampling distribution of proportions,
you can find probabilities for the proportion
of successes in a sample of size n, chosen at
random.
This means that we can use it to find the probability that the
proportion of red gumballs in one particular jumbo box of gumballs
will be at least 40%.
But before we can do that, we need to know what the expectation
and variance is for the distribution.
462 Chapter 11
So what’s the expectation of P
s
?
So far we’ve seen how we can form a distribution from the proportions of all
possible samples of size n. Before we can use it to calculate probabilities, we need
to know more about it. In particular, we need to know what the expectation and
variance is of the distribution.
Let’s start with the expectation. Intuitively, we’d expect the proportion of red
gumballs in the sample to match the proportion of red gumballs in the population.
If 25% of the gumball population is red, then you’d expect 25% of the gumballs in
the sample to be red also.
E(P
s
) = E(X)
n
= np
n
= p
Now X is the number of red gumballs in the sample. If we count the number of
red gumballs as the number of successes, then X ~ B(n, p).
You’ve already seen that for a binomial distribution, E(X) = np. This means that
E(P
s
) = E
(
X
)
n
= E(X)
n
E(X) = np
Intuitively, you’d expect
the proportion of red
gumballs to be the same
both in the sample and the
population.
So what’s the expectation of P
s
?
We want to find E(P
s
), where P
s
= X/n. In other words, we want to find the expected
value of the sample proportion, where the sample proportion is equal to the number
of red gumballs divided by the total number of gumballs in the sample. This gives us
This result ties in with what we intuitively expect. We can expect the proportion of
successes in the sample to match the proportion of successes in the population.
expectation and variance of P
s
you are here 4 463
estimating populations and samples
And what’s the variance of P
s
?
Before we can find out any probabilities for the sample proportion, we also
need to know what the variance is for P
s
. We can find the variance in a similar
way to how we find the expectation.
So what’s Var(P
s
)? Let’s start as we did before by using P
s
= X/n.
Var(P
s
) = Var
(
X
)
n
= Var(X)
n
2
As we’ve said before, X is the number of number of red gumballs in
the sample. If we count the number of red gumballs as the number of
successes, then X ~ B(n, p). This means that Var(X) = npq, as this is the
variance for the binomial distribution. This gives us
Taking the square root of the variance gives us the standard deviation of P
s
,
and this tells us how far away from p the sample proportion is likely to be. It’s
sometimes called the standard error of proportion, as it tells you what the
error for the proportion is likely to be in the sample.
Standard error of proportion =
√
pq
n
The standard error of proportion gets smaller as n gets larger. This means
that the more items there are in your sample, the more reliable your sample
proportion becomes as an estimator for p.
So how can we use the expectation and variance values we found to calculate
probabilities for the proportion? Let’s take a look.
This comes from Var(aX) = a
2
Var(X).
In this case, a = 1/n.
Var(P
s
) = Var(X)
n
2
= npq
n
2
= pq
n
Var(X) = npq
464 Chapter 11
Find the distribution of P
s
So far we’ve found the expectation and variance for P
s
, the sampling
distribution of proportions. We’ve found that if we form a distribution from
all the sample proportions, then
E(P
s
) = p Var(P
s
) = pq
n
We can use this to help us find the probability that the proportion of red
gumballs in a sample of 100 is at least 40%.
But how? Don’t we need to
know what the distribution
of P
s
is first?
Right, the distribution of P
s
actually depends on
the size of the samples.
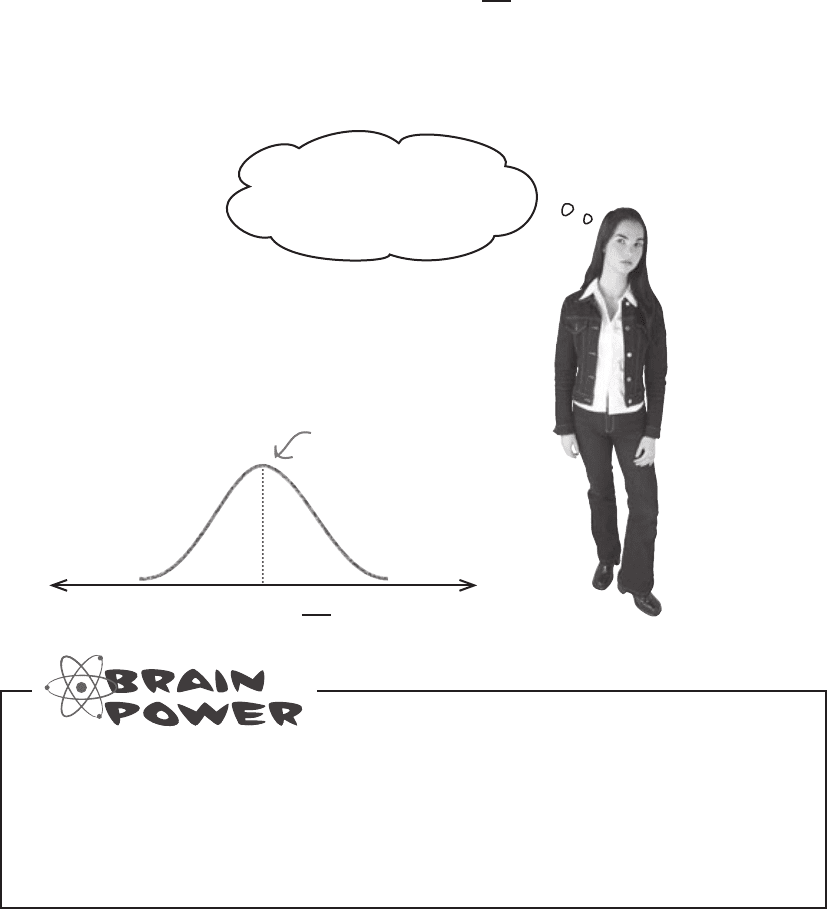
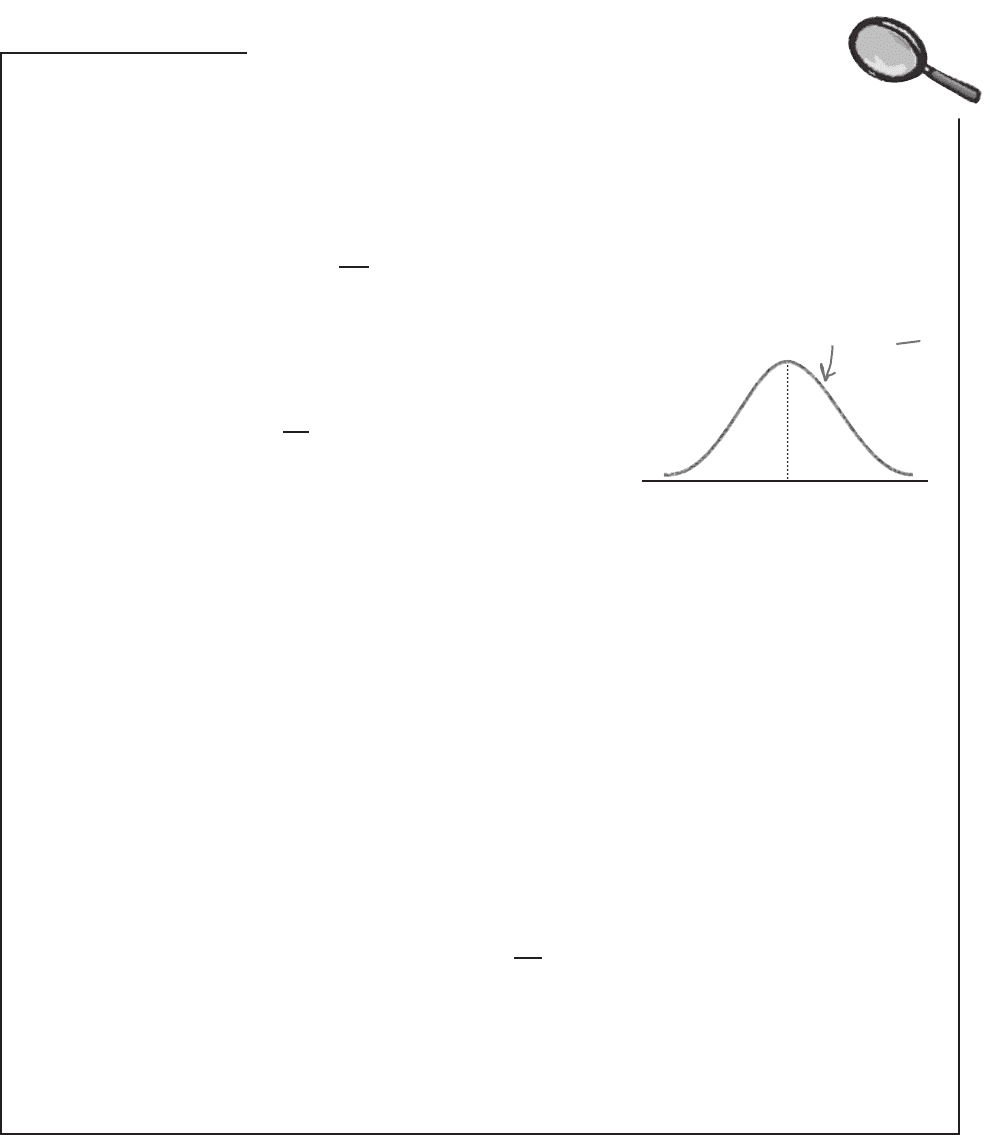
Here’s a sketch of the distribution for P
s
when n is large.
Take a look at the sketch for the distribution of P
s
where n is large. How do you
think P
s
is distributed?
Expectation = p
distribution of P
s
variance = pq
n
you are here 4 465
estimating populations and samples
P
s
follows a normal distribution
When n is large, the distribution of P
s
becomes approximately normal.
By large, we mean greater than 30. The larger n gets, the closer the
distribution of P
s
gets to the normal distribution.
We’ve already found the expectation and variance of P
s
, so this means
that if n is large,
P
s
~ N
(
p,
pq
)
n
As P
s
follows a normal distribution for n > 30, this means that we can use
the normal distribution to solve our gumball problem. We can use the
normal distribution to calculate the probability that the proportion of red
gumballs in a jumbo box of gumballs will be at least 40%.
There’s just one thing to remember: the sampling distribution needs a
continuity correction.
In other words, if you use the normal distribution to approximate
probabilities for P
s
, make sure you apply a continuity correction of
±1/2n. The exact continuity correction depends on the value of n.
P
s
—continuity correction required
The number of successes in each of the samples is discrete, and as it’s
used to calculate proportion, you need to apply a continuity correction
when you use the normal distribution to find probabilities.
We’ve seen before that if X represents the number of successes in the
sample, then P
s
= X/n. The normal continuity correction for X is ±(1/2).
If we substitute this in place of X in the formula P
s
= X/n, this means
that the continuity correction for P
s
is given by
Continuity correction = ±(1/2)
n
= ±1
2n
If n is very
large, the
continuity
correction can
be left out.
As n gets larger, the
continuity correction becomes very
small, and this means that it makes
very little difference to the overall
probability. Some textbooks omit the
continuity correction altogether.
Sometimes
statisticians
disagree about
how large n
needs to be.
If you’re taking a statistics exam,
make sure that you check how
your exam board defines this.

466 Chapter 11
Q:
What’s a sampling distribution?
A: A sampling distribution is what you get
if you take lots of different samples from a
single population, all of the same size and
taken in the same way, and then form a
distribution out of some key characteristic of
each sample. This means that the sampling
distribution of proportions is what you get if
you form a sampling distribution out of the
proportions for each of the samples.
Q:
Do we actually have to gather all
possible samples?
A: No, we don’t have to physically form all
of the samples. Instead we imagine that we
do, and then come up with expressions for
the expectation and variance.
Q:
So a sampling distribution has an
expectation and variance? Why?
A: A sampling distribution is a probability
distribution in the same way as any
other probability distribution, so it has an
expectation and variance.
The expectation of the sampling population
of proportions is like the average value of
a sample proportion; it’s what you expect
the proportion of a sample taken from a
particular population to be.
Q:
Why isn’t the variance of P
s
the
same as the population variance σ
2
?
A: The variance for the sampling
distribution of proportions describes how
the sample proportions vary. It doesn’t
describe how the values themselves vary.
The variance has a different value because it
describes a different concept.
Q:
So what use does the sampling
distribution of proportions have?
A: It allows you to work out probabilities
for the proportion of a sample taken from a
known population. It gives you an idea of
what you can expect a sample to be like.
Q:
What does the standard error of
proportion really mean?
A: The standard error is the square root
of the variance for the sampling distribution.
In effect, it tells you how far away you can
expect the sample proportion to be from the
true value of the population proportion. This
means it tells you what sort of error you can
expect to have.
The sampling distribution of proportions is
what you get if you consider all possible samples
of size n taken from the same population and form
a distribution out of their proportions. We use P
s
to
represent the sample proportion random variable.
The expectation and variance of P
s
are defined as
E(P
s
) = p
Var(P
s
) = pq/n
where p is the population proportion.
The standard error of proportion is the standard
deviation of this distribution. It’s given by
√Var(P
s
)
If n > 30, then P
s
follows a normal distribution, so
P
s
~ N(p, pq/n)
for large n. When working with this, you need to
apply a continuity correction of
± 1
2n
no dumb questions and bullet points

you are here 4 467
estimating populations and samples
25% of the gumball population are red. What’s the probability that in a box of 100 gumballs, at
least 40% will be red? We’ll guide you through the steps.
1. If P
s
is the proportion of red gumballs in the box, how is P
s
distributed?
2. What’s the value of P(P
s
≥ 0.4)?
Hint: Remember to apply a
continuity correction.

468 Chapter 11
25% of the gumball population are red. What’s the probability that in a box of 100 gumballs, at
least 40% will be red? We’ll guide you through the steps.
Let’s use p to represent the probability that a gumball is red. In other words, p = 0.25.
Let’s use P
s
to represent the proportion of gumballs in the box that are red.
P
s
~ N(p, pq/n), where p = 0.25, q = 0.75, and n = 100. As pq/n is equal to 0.25 x 0.75 / 100 = 0.001875,
this gives us
P
s
~ N(0.25, 0.001875)
1. If P
s
is the proportion of red gumballs in the box, how is P
s
distributed?
2. What’s the value of P(P
s
≥ 0.4)? Hint: Remember that you need to apply a continuity correction.
P(P
s
≥ 0.4) = P(P
s
> 0.4 - 1/(2 x 100))
= P(P
s
> 0.395)
As P
s
~ N(0.25, 0.001875), we need to find the standard score of 0.395 so that we can look up the result in
probability tables. This gives us
z = 0.395 - 0.25
√0.001875
= 3.35
P(Z > z) = 1 - P(Z < 3.35)
= 1 - 0.9996
= 0.0004
In other words, the probability that in a box of 100 gumballs, at least 40% will be red, is 0.0004.
A probability of
0.0004? Forget it. I’m
getting popcorn instead.
exercise solution
you are here 4 469
estimating populations and samples
Sampling Distribution of Proportions Up Close
The sampling distribution of proportions is the distribution formed by
taking the proportions of all possible samples of size n. The proportion
of successes in a sample is represented by P
s
, and it is is distributed as
E(P
s
) = p
Var(P
s
) = pq
n
When n is large, say bigger than 30, the distribution of P
s
becomes
approximately normal, so
P
s
~ N
(
p,
pq
)
n
Knowing the probability distribution of P
s
is useful because it means that
given a particular population, we can calculate probabilities for the proportion
of successes in the sample. We can approximate this with the normal
distribution, and the larger the size of the sample, the more accurate the
approximation.
The sampling distribution continuity correction
When you use the normal distribution in this way, it’s important to apply
a continuity correction. This is because the number of successes in the
sample is discrete, and it’s used in the calculation of proportion.
If X represents the number of successes in the sample, then P
s
= X/n. The
continuity correction for X is ±(1/2), so this means the continuity correction is
given by
Continuity correction = ±1
2n
In other words, if you use the normal distribution to approximate
probabilities for the sampling proportion, make sure you apply a continuity
correction of ±1/2n.
p
Variance = pq
n

470 Chapter 11
How many gumballs?
Using the sampling distribution of proportions, you’ve successfully
managed to find the probability of getting a certain proportion of
successes in one particular sample. This means that you can now use
samples to predict what the population will be like, and also use your
knowledge of the population to make predictions about samples.
There’s just one more problem...
The Mighty Gumball CEO has one more problem for you to work on. In
addition to selling jumbo boxes, gumballs are also sold in handy pocket-
sized packets that you can carry with you wherever you go.
According to Mighty Gumball’s statistics for the population, the mean
number of gumballs in each packet is 10, and the variance is 1. The
trouble is they’ve had a complaint. One of their most faithful customers
bought 30 packets of gumballs, and he found that the average number of
gumballs per packet in his sample is only 8.5.
The CEO is concerned that he will lose one of his best customers, and he
wants to offer him some form of compensation. The trouble is, he doesn’t
want to compensate all of his customers. He needs to know what the
probability is of this happening again.
I’m impressed. Really
impressed. Now, there’s
just one more thing that
needs sorting out...
What do you need to know in order to solve this sort of problem?
distribution of sample means