Griffiths D. Head First Statistics
Подождите немного. Документ загружается.

you are here 4 531
using hypothesis tests
Step 2: Choose your test statistic
Now that you’ve determined exactly what it is you’re going to test, you
need some means of testing it. You can do this with a test statistic.
The test statistic is the statistic that you use to test your hypothesis. It’s
the statistic that’s most relevant to the test.
What’s the test statistic for SnoreCull?
In our hypothesis test, we want to test whether SnoreCull cures 90% of
people or more. To test this, we can look at the probability distribution
according to the drug company, and see whether the number of
successes in the sample is significant.
If we use X to represent the number of people cured in the sample, this
means that we can use X as our test statistic. There are 15 people in the
sample, and the probability of success according to the drug company
is 0.9. As X follows a binomial distribution, this means that the test
statistic is actually:
X ~ B(15, 0.9)
I’m confused. Why are
we saying the probability
of success is 0.9? Surely
we don’t know that yet.
We choose the test statistic according to H
0
, the null
hypothesis.
We need to test whether there is sufficient evidence against the null
hypothesis, and we do this by first assuming that H
0
is true. We then look
for evidence that contradicts H
0
. For the SnoreCull hypothesis test, we
assume that the probability of success is 0.9 unless there is strong evidence
against this being true.
To do this, we look at how likely it is for us to get the results we did,
assuming the probability of success is 0.9. In other words, we take the
results of the sample and examine the probability of getting that result.
We do this by finding a critical region.
This is the test statistic
for our hypothesis test.
Decide on the
hypothesis you’re going
to test
Choose your test
statistic
Determine the critical
region for your decision
Find the p-value of the
test statistic
See whether the
sample result is within
the critical region
Make your decision
You
are
Here
We came up with this
test statistic back
on page 524.
532 Chapter 13
If 90% of people in the sample had
been cured, we could easily have assumed
that the drug company’s claims are
correct.
The fewer people who are cured,
the more likely it is that the
drug company claims are wrong.
The critical region of a hypothesis test is the set of values that present the
most extreme evidence against the null hypothesis.
Let’s see how this works by taking another look at the doctor’s sample. If 90%
or more people had been cured, this would have been in line with the claims
made by the drug company. As the number of people cured decreases, the
more unlikely it becomes that the claims of the drug company are true.
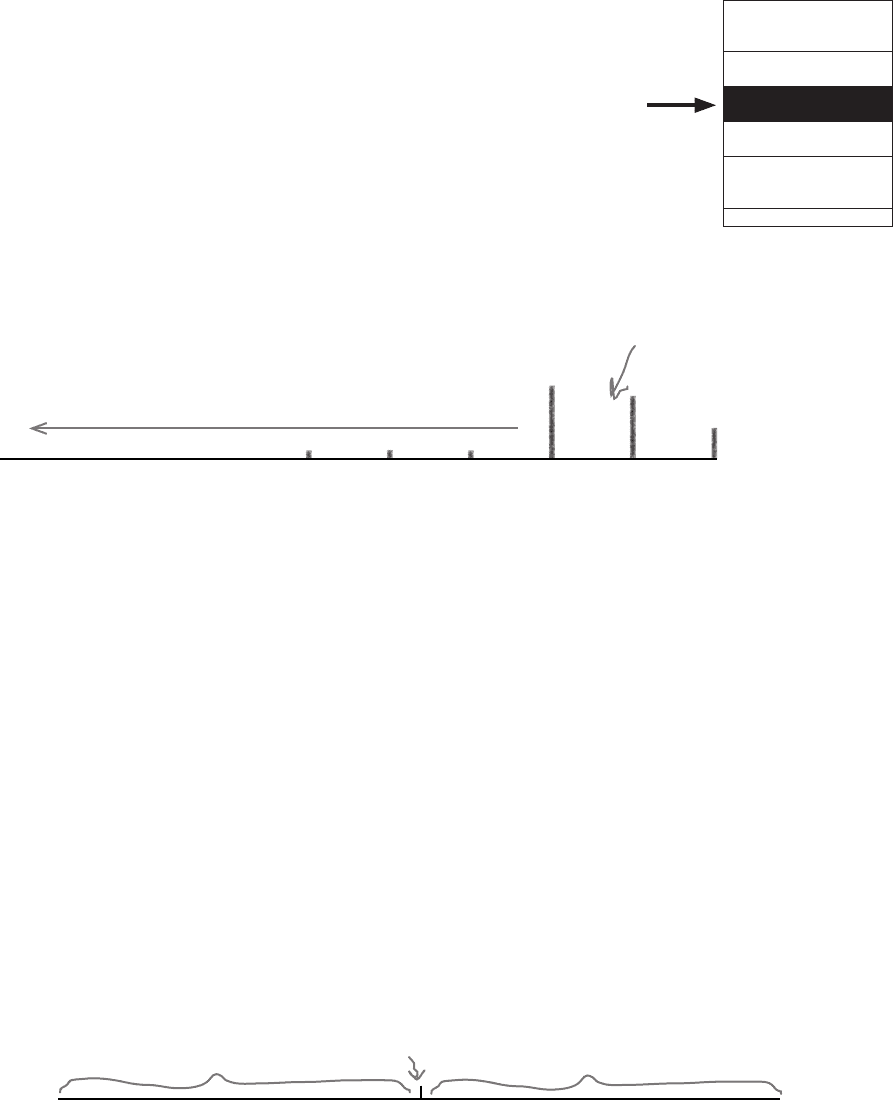
Here’s the probability distribution:
Step 3: Determine the critical region
At what point can we reject the drug company claims?
The fewer people there are in the sample who are successfully cured by
SnoreCull, the stronger the evidence there is against the claims of the drug
company. The question is, at what point does the evidence become so strong
that we confidently reject the null hypothesis? At what point can we reject the
claim that SnoreCull cures 90% of snorers?
What we need is some way of indicating at what point we can reasonably
reject the null hypothesis, and we can do this by specifying a critical region.
If the number of snorers cured falls within the critical region, then we’ll say
there is sufficient evidence to reject the null hypothesis. If the number of
snorers cured falls outside the critical region, then we’ll accept that there isn’t
sufficient evidence to reject the null hypothesis, and we’ll accept the claims
of the drug company. We’ll call the cut off point for the critical region c, the
critical value.
So how do we choose the critical region?
11 12 13 1410
15
c
If the number of people cured by SnoreCull falls in
this area, then we don’t have sufficient evidence
to reject H
0
. We’re only checking whether there’s
evidence that p < 0.9.
If the number of people cured by SnoreCull falls
in this critical region, then we can safely reject
the claims of the drug company, H
0
. Our alternate
hypothesis is that p < 0.9, so we look to this region
for evidence.
Cutoff point,
or critical
value
Decide on the
hypothesis you’re going
to test
Choose your test
statistic
Determine the critical
region for your decision
Find the p-value of the
test statistic
See whether the
sample result is within
the critical region
Make your decision
You
are
Here
finding critical regions
you are here 4 533
using hypothesis tests
Before we can find the critical region of the hypothesis test, we first
need to decide on the significance level. The significance level of
a test is a measure of how unlikely you want the results of the sample
to be before you reject the null hypothesis H
o
. Just like the confidence
level for a confidence interval, the significance level is given as a
percentage.
As an example, suppose we want to test the claims of the drug
company at a 5% level of significance. This means that we choose
the critical region so that the probability of fewer than c snorers
being cured is less than 0.05. It’s the lowest 5% of the probability
distribution.
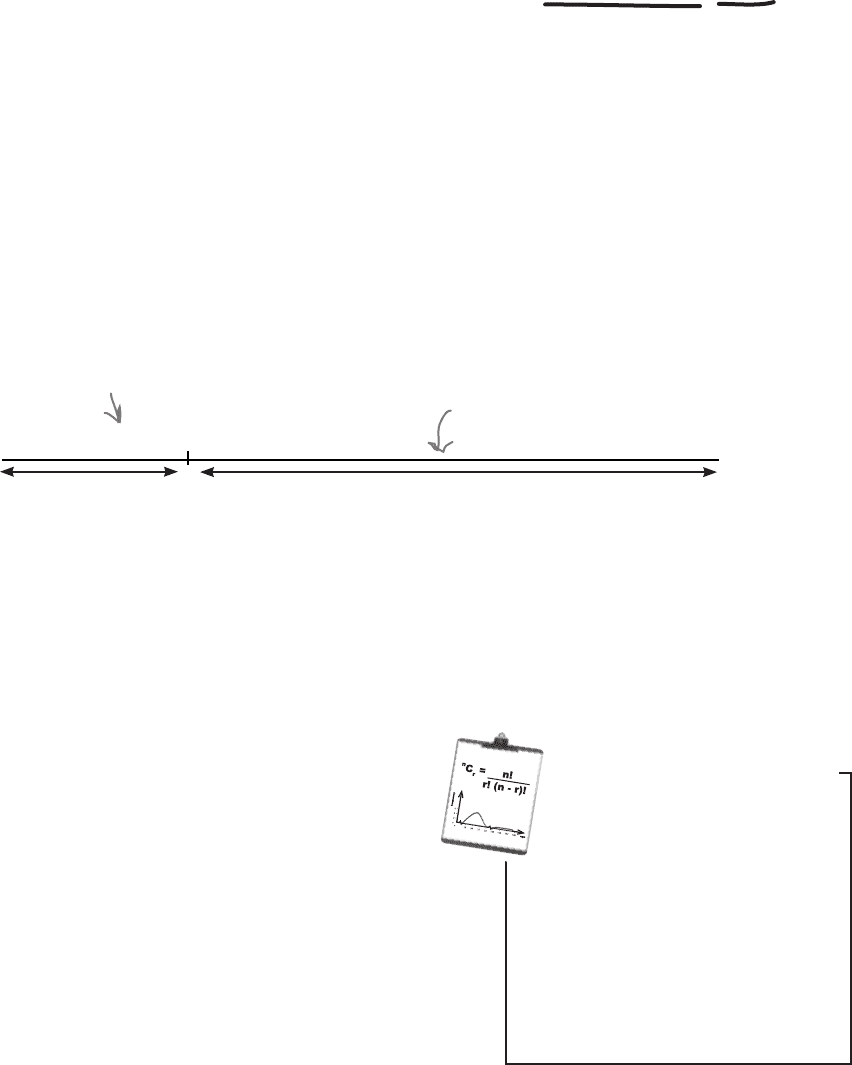
c
5% 95%
Critical region
If the number of snorers cured by
SnoreCull falls in the critical region, then
we’ll reject the null hypothesis.
The significance level is normally represented by the Greek letter α. The
lower α is, the more unlikely the results in your sample need to be before
we reject H
o
.
So what significance level should we use?
Let’s use a significance level of 5% in our hypothesis test. This
means that if the number of snorers cured in the sample
is in the lowest 5% of the probability distribution, then we
will reject the claims of the drug company. If the number of
snorers cured lies in the top 95% of the probability distribution,
then we’ll decide there isn’t enough evidence to reject the null
hypothesis, and accept the claims of the drug company.
If we use X to represent the number of snorers cured, then we
define the critical region as being values such that
P(X < c) < α
where
α = 5%
Significance level
The significance level is
represented by α. It’s a
way of saying how unlikely
you want your results to be
before you’ll reject H
0
.
Vital StatisticsVital Statistics
To find the critical region, first decide on the significance level
If H
0
is true, we are 95% certain that the number
of snorers cured will fall within this region

534 Chapter 13
Critical Regions Up Close
When you’re constructing a critical region for your test, another thing you need to
be aware of is whether you’re conducting a one-tailed or two-tailed test. Let’s
look at the difference between the two, and what impact this has on the critical
region?
One-tailed tests
A one-tailed test is where the critical region falls at one end
of the possible set of values in your test. You choose the level
of the test—represented by α—and then make sure that the
critical region reflects this as a corresponding probability.
The tail can be at either end of the set of possible values, and
the end you use depends on your alternate hypothesis H
1
.
If your alternate hypothesis includes a < sign, then use the
lower tail, where the critical region is at the lower end of the
data.
If your alternate hypothesis includes a > sign, then use the
upper tail, where the critical region is at the upper end of
the data.
We’re using a one-tailed test for the SnoreCull hypothesis
test with the critical region in the lower tail, as our alternate
hypothesis is that p < 0.9.
c
α
100% - α
A one-tailed test
at the α level
Here we’re using the lower tail.
c
α
100% - α
The critical region this
time is in the upper tail,
still at the α level.
Two-tailed tests
A two-tailed test is where the critical region is split over both
ends of the set of values. You choose the level of the test α,
and then make sure that the overall critical region reflects this
as a corresponding probability by splitting it into two. Both
ends contain α/2, so that the total is α.
You can tell if you need to use a two-tailed test by looking
at the alternate hypothesis H
1
. If H
1
contains a ≠ sign, then
you need to use a two-tailed test as you are looking for some
change in the parameter, rather than an increase or decrease.
We would have used a two-tailed test for our SnoreCull if our
alternate hypothesis had been p ≠ 0.9. We would have had to
check whether significantly more or significantly fewer than
90% of patients had been cured
c
2
100% - α
c
1
α/2
α/2
This is a two-tailed test, where
the critical region is split over
the two tails.
critical regions in depth

you are here 4 535
using hypothesis tests
Step 4: Find the p-value
Now that we’ve looked at critical regions, we can move on to step 4, finding
the p-value.
A p-value is the probability of getting a value up to and including the one
in your sample in the direction of your critical region. It’s a way of taking
your sample and working out whether the result falls within the critical
region for your hypothesis test. In other words, we use the p-value to say
whether or not we can reject the null hypothesis.
How do we find the p-value?
How we find the p-value depends on our critical region and our test statistic.
For the SnoreCull test, 11 people were cured, and our critical region is
the lower tail of the distribution. This means that our p-value is P(X 11),
where X is the distribution for the number of people cured in the sample.
As the significance level of our test is 5%, this means that if P(X 11) is
less than 0.05, then the value 11 falls within the critical region, and we can
reject the null hypothesis.
c
0.05 0.95
If P(X ≤ 11) is less than 0.05, then that means that 11 is
inside the critical region, and we can reject H
0
.
We know from step 2 that X ~ B(15, 0.9). What’s P(X ≤ 11)?
Decide on the
hypothesis you’re going
to test
Choose your test
statistic
Determine the critical
region for your decision
Find the p-value of the
test statistic
See whether the
sample result is within
the critical region
Make your decision
You
are
Here

536 Chapter 13
We know from step 2 that X ~ B(15, 0.9). What’s P(X ≤ 11)? Is 11
inside or outside the critical region?
P(X ≤ 11) = 1 - P(X ≥ 12)
= 1 - (
15
C
12
x0.1
3
x0.9
12
+
15
C
13
x0.1
2
x0.9
13
+
15
C
14
x0.1x0.9
14
+ 0.9
15
)
= 1 - (0.1285 + 0.2669 + 0.3432 + 0.2059)
= 1 - 0.9445
= 0.0555
We’ve found the p-value
To find the p-value of our hypothesis test, we had to find P(X 11). This
means that the p-value is 0.0555.
Do I always calculate
p-values in the same way?
What if my critical region
had been the upper tail?
A p-value is the probability of getting the results in the
sample, or something more extreme, in the direction of
the critical region.
In our hypothesis test for SnoreCull, the critical region is the lower tail of
the probability distribution. In order to see whether 11 people being cured
of snoring is in the critical region, we calculated P(X 11), as this is the
probability of getting a result at least as extreme as the results of our sample
in the direction of the lower tail.
c
0.05 0.95
We want to find whether 11 people being cured is in the
critical region here, so we use P(X ≤ 11) to evaluate this.
Had our critical region been the upper tail of the probability distribution
instead, we would have needed to find P(X 11). We would have counted
more extreme results as being greater than 11, as these would have been
closer to the critical region.
sharpen solution
15
C
15
= 1, and so does 0.1
0
,
so we’re just left with 0.9
15
.
you are here 4 537
using hypothesis tests
S
nore
C
ull
S
nore
C
ull
48 T
ableTS
Now that we’ve found the p-value, we can use it to see whether the result
from our sample falls within the critical region. If it does, then we’ll have
sufficient evidence to reject the claims of the drug company.
Our critical region is the lower tail of the probability distribution, and
we’re using a significance level of 5%. This means that we can reject the
null hypothesis if our p-value is less that 0.05. As our p-value is 0.0555, this
means that the number of people cured by SnoreCull in the sample doesn’t
fall within the critical region.
I win!
c
5% 95%
This is the
critical region.
The p-value is 0.056, so it’s
just outside the critical region.
Step 6: Make your decision
We’ve now reached the final step of the hypothesis test. We can decide
whether to accept the null hypothesis, or reject it in favor of the alternative.
The p-value of the hypothesis test falls just outside the critical region of
the test. This means that there isn’t sufficient evidence to reject the null
hypothesis. In other words:
We accept the claims of the drug company
Step 5: Is the sample result in the critical region?
Decide on the
hypothesis you’re going
to test
Choose your test
statistic
Determine the critical
region for your decision
Find the p-value of the
test statistic
See whether the
sample result is within
the critical region
Make your decision
You
are
Here
Decide on the
hypothesis you’re going
to test
Choose your test
statistic
Determine the critical
region for your decision
Find the p-value of the
test statistic
See whether the
sample result is within
the critical region
Make your decision
You
are
Here

538 Chapter 13
But those results
aren’t what the doctor
wants. Can’t we test at a
different level?
Once you’ve fixed the significance level of the test,
you can’t change it.
The test needs to be completely impartial. This means that you decide
what level you need the test to be at, based on what level of evidence
you require, before you look at what evidence you actually have.
If you were to look at the amount of evidence you have before deciding
on the level of the test, this could influence any decisions you made.
You might be tempted to decide on a specific level of test just to get the
result you want. This would make the outcome of the test biased, and
you might make the wrong decision.
So what did we just do?
Let’s summarize what we just did.
First of all, we took the claims of the drug company, which the doctor had
misgivings about. We used these claims as the basis of a hypothesis test. We
formed a null hypothesis that the probability of curing a patient is 0.9, and
then we applied this to the number of people in the doctors sample.
We then decided to conduct a test at the 5% level, using the success rate in
the doctor’s sample. We looked at the probability of 11 people or fewer being
cured, and checked to see whether the probability of this was less than 5%,
or 0.05. In other words, we looked at the probability of getting a result this
extreme, or even more so.
Finally, we found that at the 5% level, there wasn’t strong enough evidence to
reject the claims of the drug company.
hypothesis testing in review

you are here 4 539
using hypothesis tests
Q:
What significance level should I normally test at?
A: It all depends how strong you want the evidence to be before
you reject the null hypothesis. The stronger you want the evidence to
be, the lower your significance level needs to be.
The most common significance level is 5%, although you sometimes
see tests at the 1% level. Testing at the 1% means that you require
stronger evidence than if you test at the 5% level.
Q:
Does the significance level have anything in common with
the level of confidence for confidence intervals?
A: Yes, they have0 a lot in common. When you construct a
confidence interval for a population parameter, you want to have
a certain degree of confidence that the population parameter lies
between two limits. As an example, if you have a 95% level of
confidence, this means that the probability that the population
parameter lies between the two limits is 0.95.
The level of significance reflects the probability that values will lie
outside a certain limit. As an example, a significance level of 5%
means that your critical region must have a probability of 0.05.
I still have doubts.
I wonder what would
happen if I took a
larger sample...
In a hypothesis test, you take a claim and test it
against statistical evidence.
The claim that you’re testing is called the null
hypothesis test. It’s represented as H
0
, and it’s the
claim that’s accepted unless there’s strong statistical
evidence against it.
The alternate hypothesis is the claim we’ll accept
if there’s strong enough evidence against H
0
. It’s
represented by H
1
.
The test statistic is the statistic you use to test your
hypothesis. It’s the statistic that’s most relevant to
the test. You choose the test statistic by assuming
that H
0
is true.
The significance level is represented by α. It’s a way
of saying how unlikely you want your results to be
before you’ll reject H
0
.
The critical region is the set of values that presents
the most extreme evidence against the null
hypothesis test. You choose your critical region by
considering the significance level and how many tails
you need to use.
A one-tailed test is when your critical region lies
in either the upper or the lower tail of the data. A
two-tailed test is when it’s split over both ends.
You choose your tail by looking at your alternate
hypothesis.
A p-value is the probability of getting the result
of your sample, or a result more extreme in the
direction of your critical region.
If the p-value lies in the critical region, you have
sufficient reason to reject your null hypothesis. If
your p-value lies outside your critical region, you
have insufficient evidence.

540 Chapter 13
What if the sample size is larger?
So far the doctor has conducted her trial using a sample of just 15 people,
and on the basis of this, there was insufficient evidence to reject the
claims of the drug company.
It’s possible that the size of the sample wasn’t large enough to get an
accurate result. The doctor might get more reliable results by using a
larger sample.
Here are the results from the doctor’s new trial:
What’s the null hypothesis of this new problem?
What’s the alternate hypothesis?
We want to determine whether the new data will
make a difference in the outcome of the test.
Let’s run through another hypothesis test, this time with the larger
sample.
Cured? Yes No
Frequency
80 20
I want to conduct a new
hypothesis test using
these new results.
a new sample for hypothesis testing