Griffiths D. Head First Statistics
Подождите немного. Документ загружается.


you are here 4 561
using hypothesis tests
Introducing power
So far we’ve looked at the probability of getting different types of error in
our hypothesis test. One thing that we haven’t looked at is power.
The power of a hypothesis test is the probability that we will reject H
0
when H
0
is false. In other words, it’s the probability that we will make the
correct decision to reject H
0
.
That sounds complicated. I
hope it’s not as difficult to
find as P(Type II error).
Once you’ve found P(Type II error), calculating the
power of a hypothesis test is easy.
Rejecting H
0
when H
0
is false is actually the opposite of making a Type II
error. This means that
Power = 1 - β
where β is the probability of making a Type II error.
So what’s the power of SnoreCull?
We’ve found the probability of getting a Type II error is 0.102. This
means that we can find the power of the SnoreCull hypothesis test by
calculating
Power = 1 - P(Type II error)
= 1 - 0.102
= 0.898
In other words, the power of the SnoreCull hypothesis test is 0.898. This
means that the probability that we will make the correct decision to reject
the null hypothesis is 0.898.

562 Chapter 13
The doctor’s happy
In this chapter, you’ve run through two hypothesis tests, and
you’ve proved that there’s sufficient evidence to reject the claims
made by the drug company. You’ve been able to show that based
on the doctor’s sample, there’s sufficient evidence that SnoreCull
doesn’t cure 90% of snorers, as the drug company claims.
I thought that the claims sounded too
good to be true, and you’ve proved that
there are strong statistical grounds
for showing I’m right. I’ll sleep quieter
at night knowing that.
But it doesn’t stop there
Keep reading, and we’ll show you what
other sorts of hypothesis tests you can use.
We’ll see you over at Fat Dan’s Casino...
S
nore
C
ull
S
nore
C
ull
48 T
ableTS
snorecull is a fraud!

you are here 4 563
using hypothesis tests
The drug company and their cough syrup manufacturer are having a dispute. The factory says
that the amount of syrup that gets poured into their bottles follows a distribution
X ~ N(355, 25), where X is the amount of syrup in the bottle measured in mL. The drug company
conducted tests on a large sample and found that the mean amount of syrup in 100 bottles
is 356.5 mL. Test the hypothesis that the factory mean is correct at a 1% level of significance
against the alternative that the mean amount of syrup in a bottle is greater than 355 mL.
We’re going to guide you through this exercise in two parts. Here are the first three steps.
Step 1: Decide on the hypothesis you’re going to test. What’s the null hypothesis? What’s the alternate
hypothesis?
Step 2: Choose your test statistic.
Step 3: Determine the critical region for your decision. Does the critical region lie in the lower or upper tail of the
distribution? What’s the significance level? What’s the critical value?
Hint: Your hypothesis concerns the mean,
so what’s the distribution of X? How
do you standardize this?
(part 1)

X ~ N(μ, σ
2
/n), so this means that under the null hypothesis, X ~ N(355, 25/100) or X ~ N(355, 0.25).
If we standardize this, we get
Z = X - 355
0.25
= X - 355
0.5
Step 1: Decide on the hypothesis you’re going to test. What’s the null hypothesis? What’s the alternate
hypothesis?
We want to test whether the mean amount of syrup in the bottles is 355 mL like the factory says. This
gives us
H
0
: μ = 355
H
1
: μ > 355
Step 2: Choose your test statistic.
Step 3: Determine the critical region for your decision. Does the critical region lie in the lower or upper tail of the
distribution? What’s the significance level? What’s the critical value?
The alternate hypothesis is μ > 355, which means the critical region lies in the upper tail. We want to test
at the 1% significance level, so the critical region is defined by P(Z > c) = 0.01. Using probability tables,
this gives us c = 2.32. In other words, the critical region is given by Z > 2.32.
The drug company and their cough syrup manufacturer are having a dispute. The factory says
that the amount of syrup that gets poured into their bottles follows a distribution
X ~ N(355, 25), where X is the amount of syrup in the bottle measured in mL. The drug company
conducted tests on a large sample and found that the mean amount of syrup in 100 bottles
is 356.5 mL. Test the hypothesis that the factory mean is correct at a 1% level of significance
against the alternative that the mean amount of syrup in a bottle is greater than 355 mL.
We’re going to guide you through this exercise in two parts. Here are the first three steps.
(part 1)
564 Chapter 13
exercise solution

you are here 4 565
using hypothesis tests
This exercise continues where the last left off. Here are the final three steps of the hypothesis
test. What do you conclude?
Step 4: Find the p-value of the test statistic. Use the distribution Z = (X - 355)/0.5, the mean amount of syrup in
the sample, and remember that this time you’re seeing if your test statistic lies in the upper tail of the distribution, as
this is where the critical region is.
Step 5: See whether the sample result is within the critical region. Remember that you’re testing at the 1%
significance level.
Step 6: Make your decision. Is there enough evidence to reject the null hypothesis at the 1% level of significance?
(part 2)

566 Chapter 13
This exercise follows on from the last. Here are the final three steps of the hypothesis test. What
do you conclude?
Step 4: Find the p-value of the test statistic. Use the distribution Z = (X - 355)/0.5, the mean amount of syrup in the
sample, and remember that this time you’re seeing if your test statistic lies in the upper tail of the distribution as this
is where the critical region is.
Z = (X - 355)/0.5
= (356.5 - 355)/0.5
= 1.5/0.5
= 3
The p-value for this is given by P(Z > 3), as the critical region is in the upper tail. Looking this up in
probability tables gives us
p-value = 0.0013
Step 5: See whether the sample result is within the critical region. Remember that you’re testing at the 1%
significance level.
The p-value 0.0013 is less than 0.01, the significance level, so that means that the sample result is within
the critical region
Step 6: Make your decision. Is there enough evidence to reject the null hypothesis at the 1% level of significance?
As the sample result lies in the critical region, there’s sufficient evidence to reject the null hypothesis. We
can accept the alternate hypothesis that μ > 355 ml.
A Type I error is when you reject the null hypothesis when it’s actually
correct. The probability of getting a Type I error is α, the significance level of
the test.
A Type II error is when you accept the null hypothesis when it’s wrong. The
probability of getting a Type II error is represented by β.
To find β, your alternate hypothesis must have a specific value. You then
find the range of values outside the critical region of your test, and then find
the probability of getting this range of values under H
1
.
exercise solution
(part 2)

this is a new chapter 567
the χ
2
distribution
14
There’s Something
Going On...
Sometimes things don’t turn out quite the way you expect.
When you model a situation using a particular probability distribution, you have a
good idea of how things are likely to turn out long-term. But what happens if there are
differences between what you expect and what you get? How can you tell whether
your discrepancies come down to normal fluctuations, or whether they’re a sign of
an underlying problem with your probability model instead? In this chapter, we’ll
show you how you can use the χ
2
distribution to analyze your results and sniff out
suspicious results.
I thought his success
with girls would follow a
binomial distribution with
p = 0.8. I was so wrong...

568 Chapter 14
Fat Dan’s is used to making a tidy profit from its
casino-goers, but this week there’s a problem. The slot
machines keep hitting the jackpot, the roulette wheel
keeps landing on 12, the dice are loaded, and too many
people are winning off one of the blackjack tables.
The casino can’t support the loss for much longer, and
Fat Dan suspects foul play. He needs your help to get
to the bottom of what’s going on.
There may be trouble ahead at Fat Dan’s Casino
could fat dan’s casino be rigged?
you are here 4 569
the χ
2
distribution
Let’s start with the slot machines
As you’ve seen before, Fat Dan’s Casino has a full row of bright, shiny slot
machines, just waiting to be played. The trouble is that people keep on playing
them—and winning.
Here’s the expected probability distribution for one of the slot machines, where X
represents the net gain from each game played:
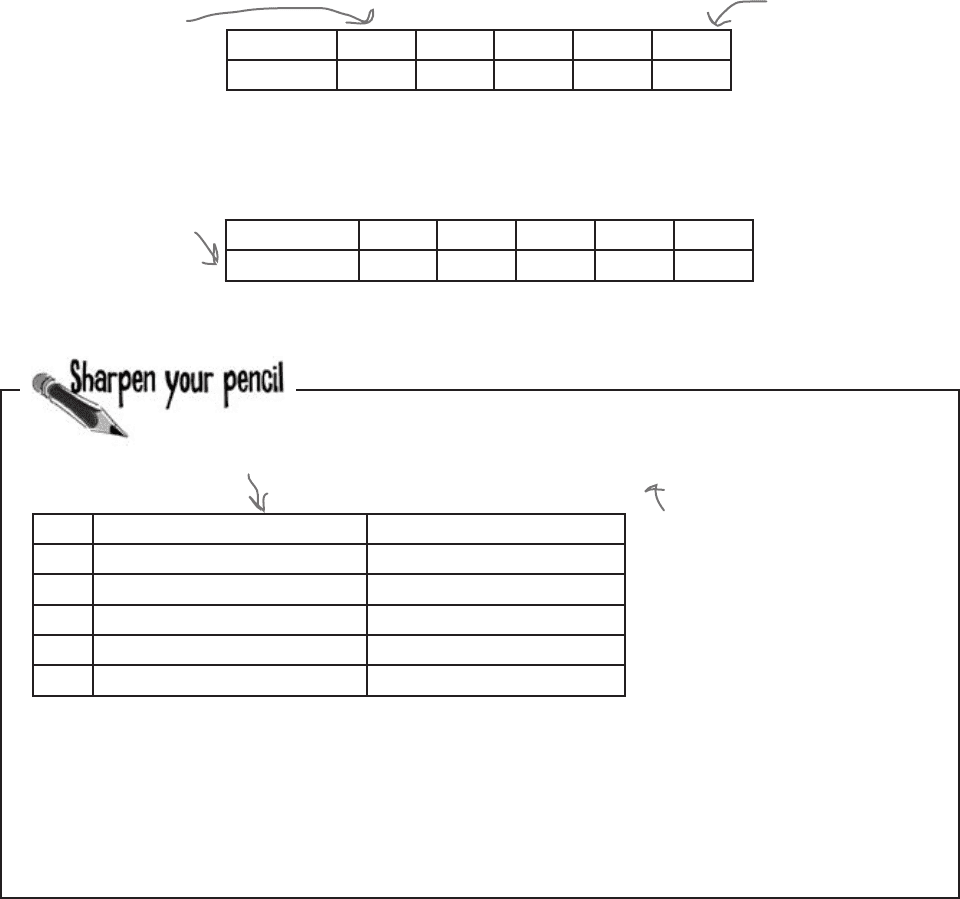
The casino has collected statistics showing the number of times people get each
outcome. Here are the frequencies for the observed net gains per game:
We need to compare the actual frequency of each value of x with
what you’d expect the frequency to be based on the probability
distribution. Fill in the table below. What do you notice?
x -2 23 48 73 98
P(X = x)
0.977 0.008 0.008 0.006 0.001
x -2 23 48 73 98
Frequency
965 10 9 9 7
x Observed frequency Expected frequency
-2
965 977
23
10
48
9
73
9
98
7
The observed frequency
is what we actually get.
Hint: The total observed frequency is
1000, as this is what you get if you
add all the observed frequencies. Use
the probability distribution to work
out what you’d expect the frequencies
to be.
It’s $2 per game, so if
you don’t win anything,
you lose your $2.
If you hit the jackpot,
your net gain is $98.
The frequency shows
you how many games had
which net gain.
570 Chapter 14
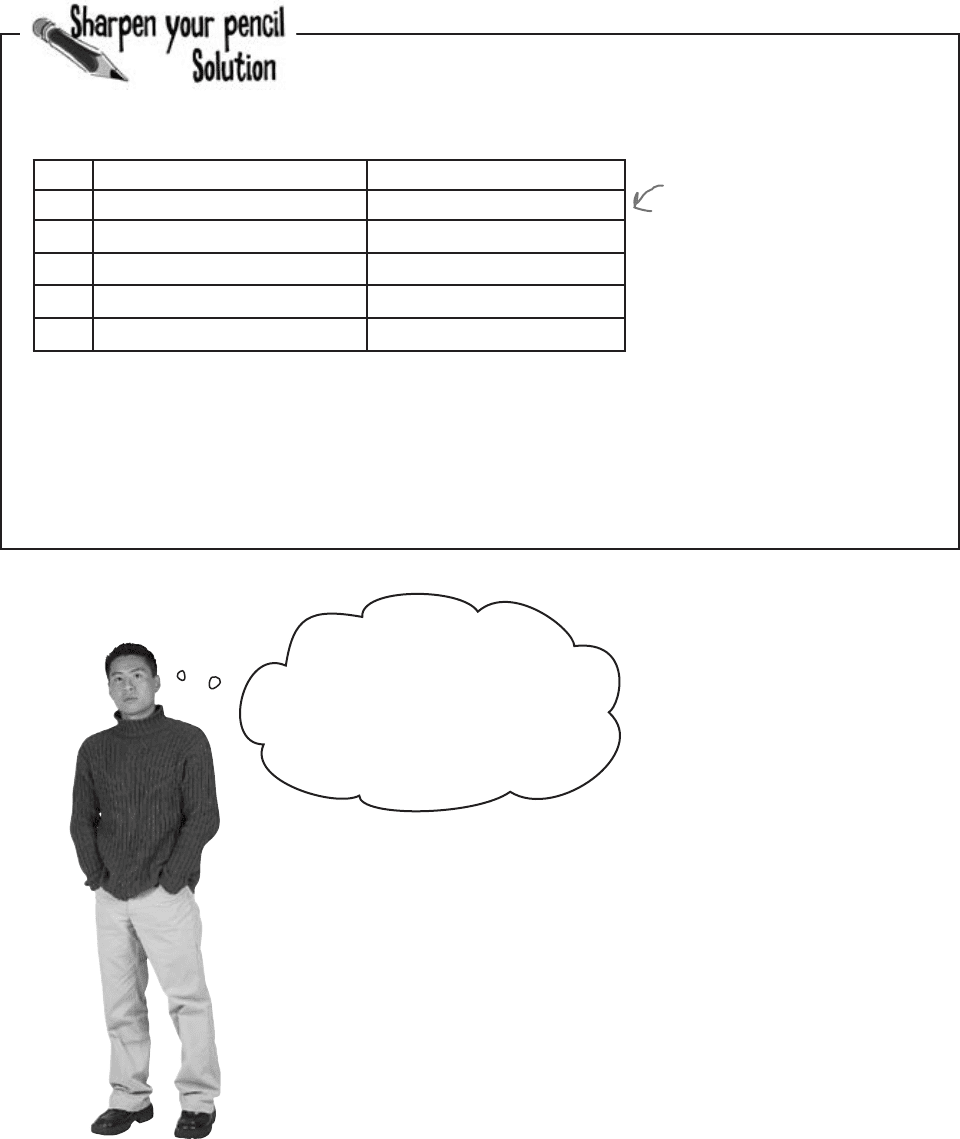
We need to compare the actual frequency of each value of x with
what you’d expect the frequency to be based on the probability
distribution. Fill in the table below. What do you notice?
Looking at the data, it looks
like there might be something
going on with the slot machine
payouts. But how can we be
certain? It’s unlikely, but this
could happen by pure chance.
x Observed frequency Expected frequency
-2
965 977
23
10
8
48
9
8
73
9
6
98
7
1
We need some way of deciding whether these results
show the slot machines have been rigged.
What we need is some sort of hypothesis test that we can use to test the
differences between the observed and expected frequencies. That way, we’ll
have some way of deciding whether the slot machines have been tampered
with to make sure they keep paying out lots of money.
The question is, what sort of distribution can we use for this hypothesis test?
There’s a difference between the number of people you’d expect to win the jackpot, based
on the probability distribution, and the number of people actually winning it. What we don’t
know is how significant these differences are.
We found the expected frequencies
by multiplying the probability of
each outcome by 1000, the total
frequency.
sharpen your pencil solution