Griffiths D. Head First Statistics
Подождите немного. Документ загружается.

you are here 4 591
the χ
2
distribution
We still need to calculate degrees of freedom
Before we can use the χ
2
distribution to find the significance of the observed
frequencies, there’s just one more thing we need to find. We need to find ν, the
number of degrees of freedom.
You saw earlier that the number of degrees of freedom is the number of pieces
of independent information we are free to choose, taking into account any
restrictions. This means that we look at how many expected frequencies we have
to calculate independently, and subtract the number of restrictions.
First of all, let’s look at the total number of expected frequencies we had to
calculate. We had to figure out the expected frequencies for the three croupiers
and the three possible outcomes. This means that we worked out 3
×
3 = 9
expected frequencies.
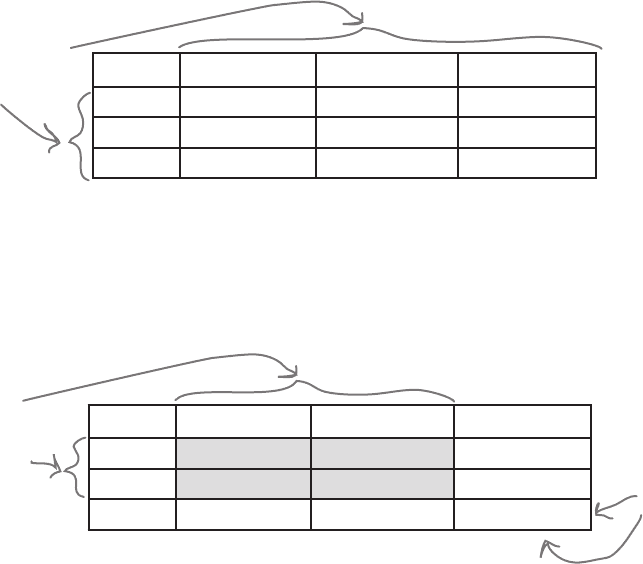
Croupier A Croupier B Croupier C
Win
Draw
Lose
We had to figure out
3x3 = 9 expected
frequencies.
Now for each row and for each column, we only actually had to calculate two of
the expected frequencies. We knew what the total frequency should be, so we could
choose the third to make sure that the frequencies added up to the right result. In
other words, we only actually had to calculate 4 of the expected frequencies; the
other 5 had to fit in with the total frequencies we already knew about.
Croupier A Croupier B Croupier C
Win
Draw
Lose
We only had to calculate these
expected frequencies - we
could figure out the others
using the total frequency of
each row and column.
Since we had to calculate 4 expected frequencies, this makes the number of
degrees of freedom. There were 4 pieces of independent information we had
to calculate; once we’d done that, the rest were known automatically. In other
words, ν = 4.
Another way of looking at this is that we needed to find 9 values overall, and
there were 5 values that we didn’t have to calculate independently. Using our
formula from before, this gives us ν = 9 – 5 = 4.
We could figure
the last row and
column out using
the totals.

592 Chapter 14
Conduct a hypothesis test with a 1% significance level to see whether the outcome of the
game is independent of the croupier manning the table. Here’s a reminder of the steps, but
remember you’ve worked out some of these already.
1. Decide on the hypothesis you’re going to test, and its alternative.
2. Find the expected frequencies and the degrees of freedom.
3. Determine the critical region for your decision.
4. Calculate the test statistic Χ
2
.
5. See whether the test statistic is within the critical region.
6. Make your decision.
another long exercise

you are here 4 593
the χ
2
distribution
We’ve left you lots of space
for your calculations.

594 Chapter 14
Conduct a hypothesis test with a 1% significance level to see whether the outcome of the
game is independent of the croupier manning the table. Here’s a reminder of the steps, but
remember you’ve worked out some of these already.
1. Decide on the hypothesis you’re going to test, and its alternative.
2. Find the expected frequencies and the degrees of freedom.
3. Determine the critical region for your decision.
4. Calculate the test statistic Χ
2
.
5. See whether the test statistic is within the critical region.
6. Make your decision.
Step 1:
We want to test whether the outcome of the game is independent of the croupier manning the table. This
means we can use:
H
0
: There is no relationship between the outcome of the game and the croupier manning the table.
H
1
: There is a relationship between the outcome of the game and the croupier manning the table
Step 2:
We found the expected frequencies in the exercise back on page 590, and we’ve just seen that the number
of degrees of freedom is 4.
Step 3:
From probability tables, χ
2
1%
(4) = 13.28. This means that the critical region is given by X
2
> 13.28.
Step 4:
We also calculated the test statistic X
2
using the expected frequencies back on page 590. We found that
X
2
= 5.004.
Step 5:
The critical region is given by X
2
> 13.28, so this means that X
2
is outside the critical region.
Step 6:
As X
2
is outside the critical region, we accept the null hypothesis. There is insufficient evidence that there’s
a relationship between game outcome and croupier.
and another long exercise solution

you are here 4 595
the χ
2
distribution
Take a look at how we calculated the degrees
of freedom for a 3x3 table. How do you think
we could generalize this? See if you can work
this out, then turn the page.
Q:
I’m still not sure I understand how
you found the degrees of freedom for the
croupiers. Why are there four degrees of
freedom?
A: We found the degrees of freedom by
looking at how many expected frequencies
we had to calculate, and working out how
many of these we could have calculated by
just looking at the total observed frequencies
for each row and column.
There are three croupiers and three
outcomes. If you use a contingency table to
calculate these, the row and column totals
for the expected frequencies must match
those of the observed frequencies. This
means that once you’ve calculated the first 2
expected frequencies for any row or column,
the final one is determined by the overall
total. Therefore, you only need to calculate
2×2 expected frequencies from scratch. This
gives you your four degrees of freedom.
Q:
Are there any other uses of the χ
2
distribution besides testing goodness of
fit and independence?
A: These are the two main uses of the
χ
2
distribution. The thing to remember is
that you can use it to test the goodness of
fit of virtually any probability distribution. As
an example, you can use it to test whether
observed frequencies fit a particular binomial
distribution.
Q:
Should I test at any particular
level?
A: It depends on your situation. Just as
with other hypothesis tests, the smaller the
level of significance, the stronger you need
your evidence to be before you reject your
null hypothesis.
Testing at the 5% and 1% level of
significance is common.
I wonder what happens
if you have a different size
contingency table? How
do you find the number of
degrees of freedom then?
596 Chapter 14
Generalizing the degrees of freedom
So far we’ve looked at the degrees of freedom for a 3×3 contingency table,
but how do we generalize the result?
Imagine you’re comparing two variables, and you have h rows of one variable
and k columns of another. You know what the row and column totals should
be. Now imagine you want to find the number of degrees of freedom.
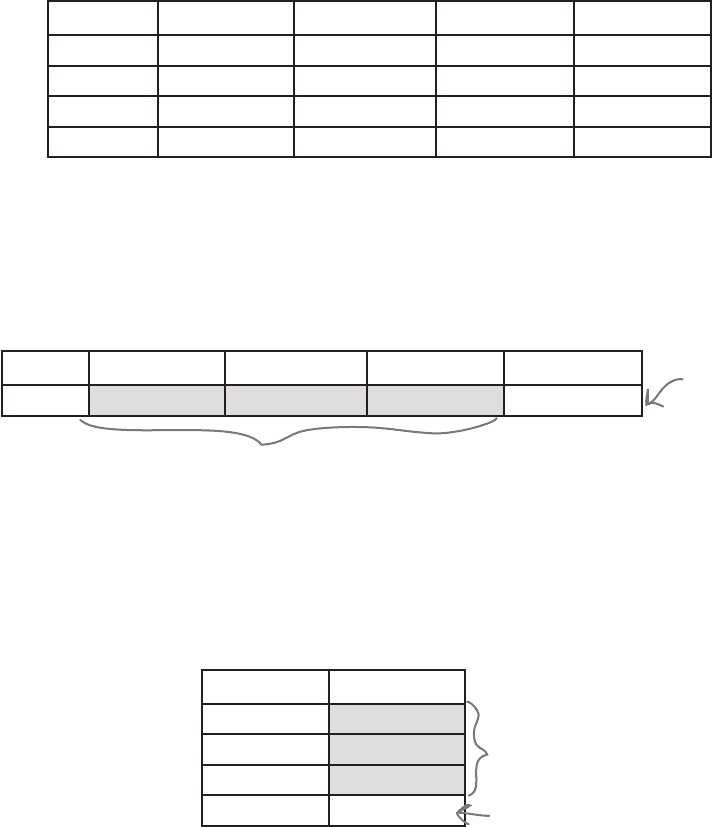
Column 1 ... Column k-1 Column k
Row 1
...
Row h-1
Row h
For each row, there are k columns. You know what the total of each row
should be, so you only actually need to calculate the expected frequency of
(k – 1) of the columns. You automatically know what the kth column is
because you know the total frequency of the row.
Column 1 ... Column k-1 Column k
Row 1
You need to calculate these.
You can figure
out column k using
the row total.
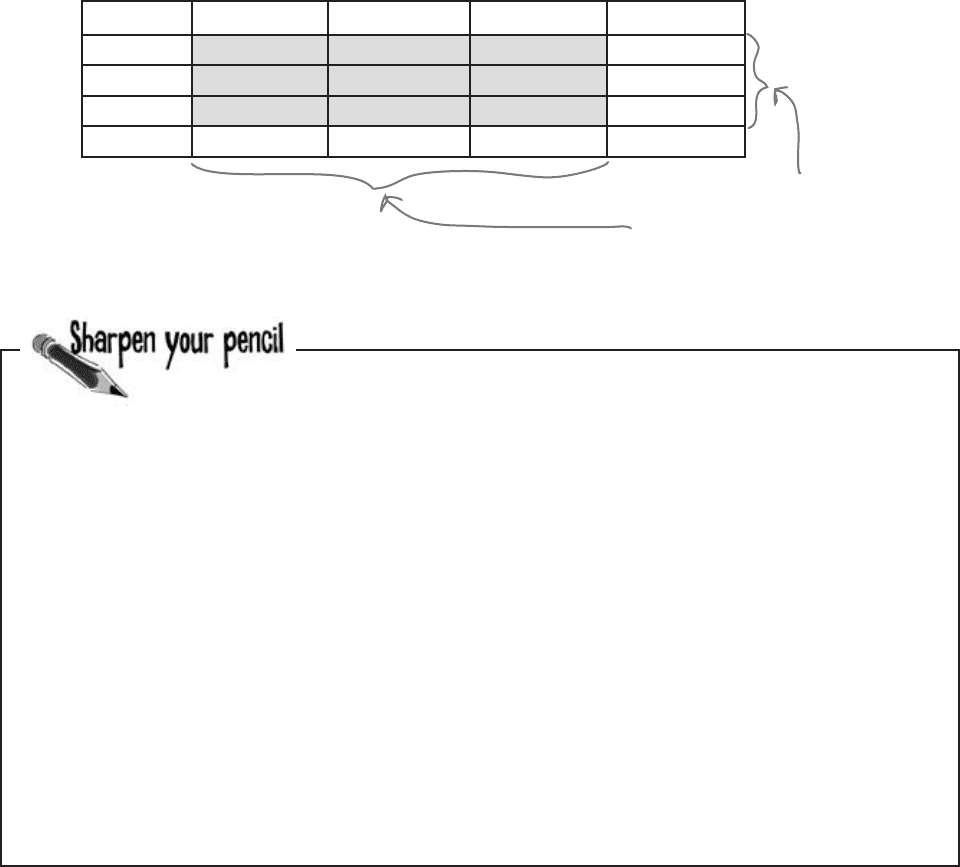
It’s a similar process for the columns. Each column has h rows, and you
know what the total of each column should be. This means that you have
to calculate (h – 1) of the rows for each column. You automatically know
what the value of the hth row is because you know the total frequency of the
column.
Column 1
Row 1
...
Row h – 1
Row h
You need to calculate
the frequencies of
these h-1 rows.
You can figure out row h
using the column total.
calculating degrees of freedom in general
you are here 4 597
the χ
2
distribution
Column 1 ... Column k-1 Column k
Row 1
...
Row h-1
Row h
ν = (h - 1)
×
(k - 1)
And the formula is...
If we put this together, the total number of expected frequencies
you have to calculate is (k - 1)
×
(h - 1). In other words, if you have a
table with dimensions h by k, you can find the degrees of freedom by
calculating
You have to calculate (h-1) x (k-1)
expected frequencies, so there are
(h-1) x (k-1) degrees of freedom.
Fat Dan has hired two more croupiers. What are the degrees of
freedom now? The outcomes of the game remain the same.

598 Chapter 14
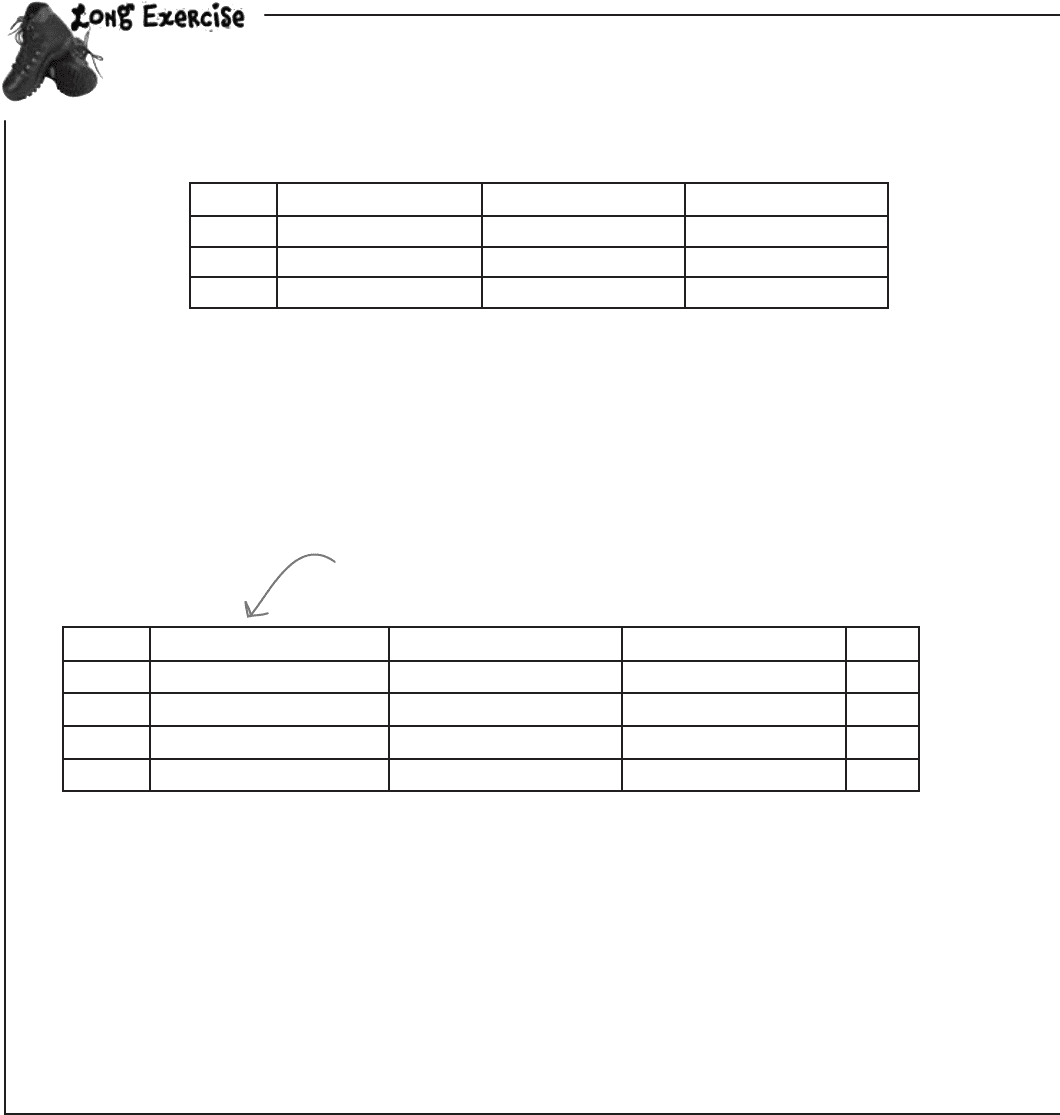
Fat Dan has hired two more croupiers. What are the degrees of
freedom now? The outcomes of the game remain the same.
As Fat Dan has hired 2 more croupiers, this means that we now have a 3x5 contingency table.
Croupier A Croupier B Croupier C Croupier D Croupier E
Win
Draw
Lose
A, B, and C are the original croupiers,
and Fat Dan has hired two more.
The number of degrees of freedom is given by (h-1) x (k-1), where h is the number of rows, and k is the number
of columns. This gives us
ν = 2 x 4
= 8
The χ
2
distribution allows you to conduct goodness
of fit tests and test independence between
variables.
It takes a test statistic
Χ
2
=
Σ
(O - E)
2
E
where O refers to observed frequencies, and E
refers to expected frequencies.
If we’re using test statistic Χ
2
with the χ
2
distribution, we write
Χ
2
~ χ
2
α
(ν)
where ν is the number of degrees of freedom, and
α is the level of significance.
In a goodness of fit test, ν is the number of
classes minus the number of restrictions.
In a test for independence for two variables, if your
contingency table has h rows and k columns,
ν = (h – 1)
×
(k – 1)
sharpen solution

you are here 4 599
the χ
2
distribution
You’ve saved the casino
Thanks to your mastery of the χ
2
distribution, you’ve managed to
unearth which of the casino games look like they’ve been rigged. You
discerned explainable discrepancies between what you got and what you
expected, and you also detected suspicious activity at certain levels of
significance.
Fat Dan is delighted with your efforts. Thanks to you, he knows which of
his casino games need to be investigated, and the blackjack croupiers get
to keep their jobs. Next time you’re in town, tell Fat Dan—he’ll supply
you with extra chips, all on the house.
Well done!
Fat Dan’s promised you
a bunch of casino chips
on the house!
B
a
c
k
i
n
B
u
s
i
n
e
s
s
!
600 Chapter 14
Fat Dan thinks that one or more of his croupiers are somehow influencing the results of the roulette
wheel. Here’s data showing the observed frequency with which the ball lands in each color pocket
for each of the croupiers. Conduct a test at the 5% level to see whether pocket color and croupier
are independent, or whether there is sufficient evidence to show there might be something going on.
Step 1: Decide on the hypothesis you’re going to test, and its alternative.
Step 2: Find the expected frequencies and the degrees of freedom. Use the table of expected frequencies below.
Step 3: Determine the critical region for your decision.
Croupier A Croupier B Croupier C
Red
375 367 357
Black
379 336 362
Green
46 37 41
Croupier A Croupier B Croupier C Total
Red
1099
×
800/2300=382.3 1099
×
740/2300=353.6
Black
1077
×
800/2300=374.6
Green
124
×
800/2300=43.1
Total
800
Hint: Complete the row and column totals first these are
the same as for the observed frequencies above.
chapter-ending long exercise