Griffiths D. Head First Statistics
Подождите немного. Документ загружается.

you are here 4 601
the χ
2
distribution
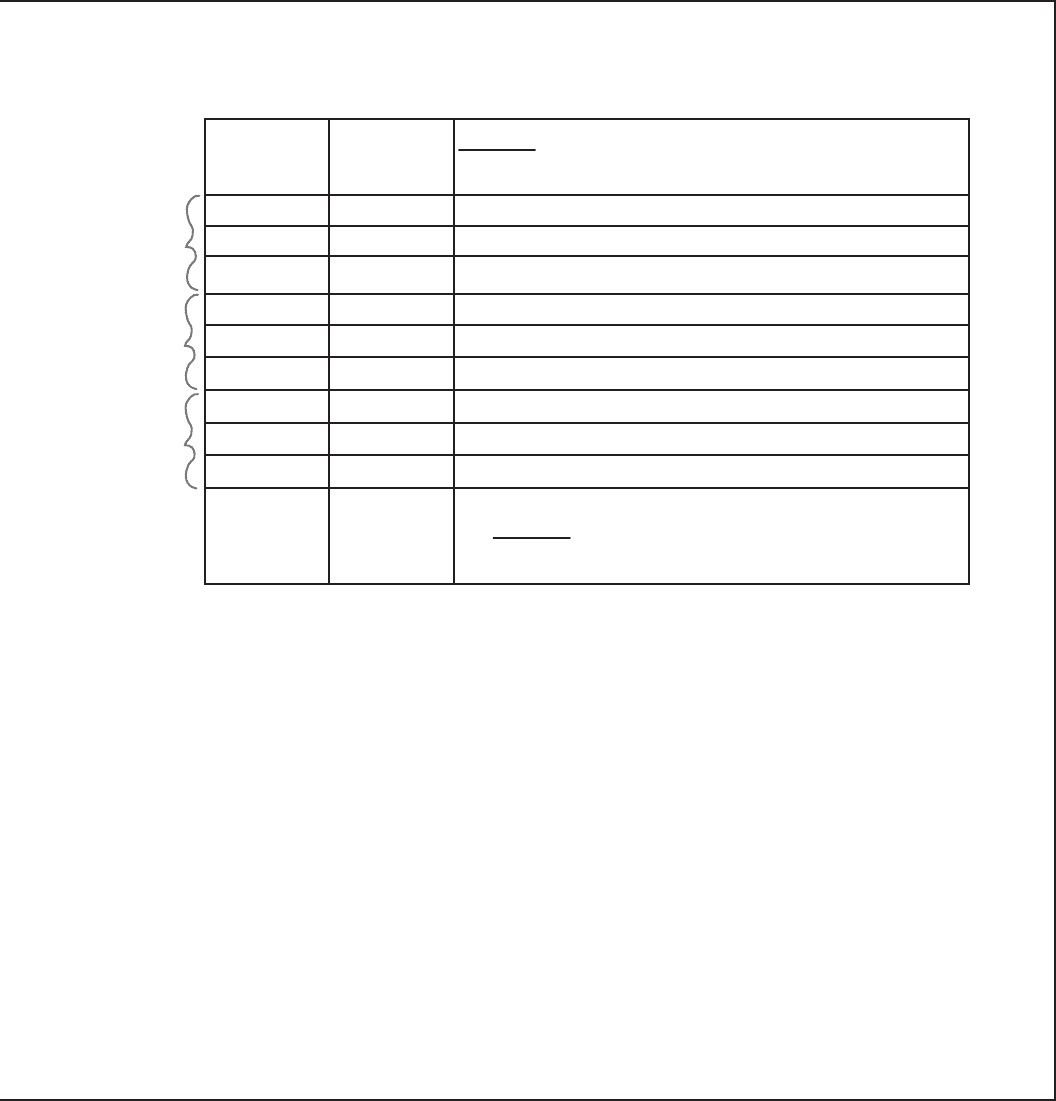
Step 4: Calculate the test statistic Χ
2
. Use the table below to help you.
Step 5: See whether the test statistic is within the critical region.
Step 6: Make your decision.
Observed Expected (O - E)
2
E
375 382.3 (375-382.3)
2
/382.3 = 53.29/382.3 = 0.139
379 374.6 (379-374.6)
2
/374.6 = 19.36/374.6 = 0.005
46 43.1 (46-43.1)
2
/43.1 = 8.41/43.1 = 0.195
367 353.6 (367-353.6)
2
/353.6 = 179.56/353.6 = 0.508
336
37
357
362
41
ΣO =
ΣE =
Σ
(O - E)
2
=
E
A
B
C
602 Chapter 14
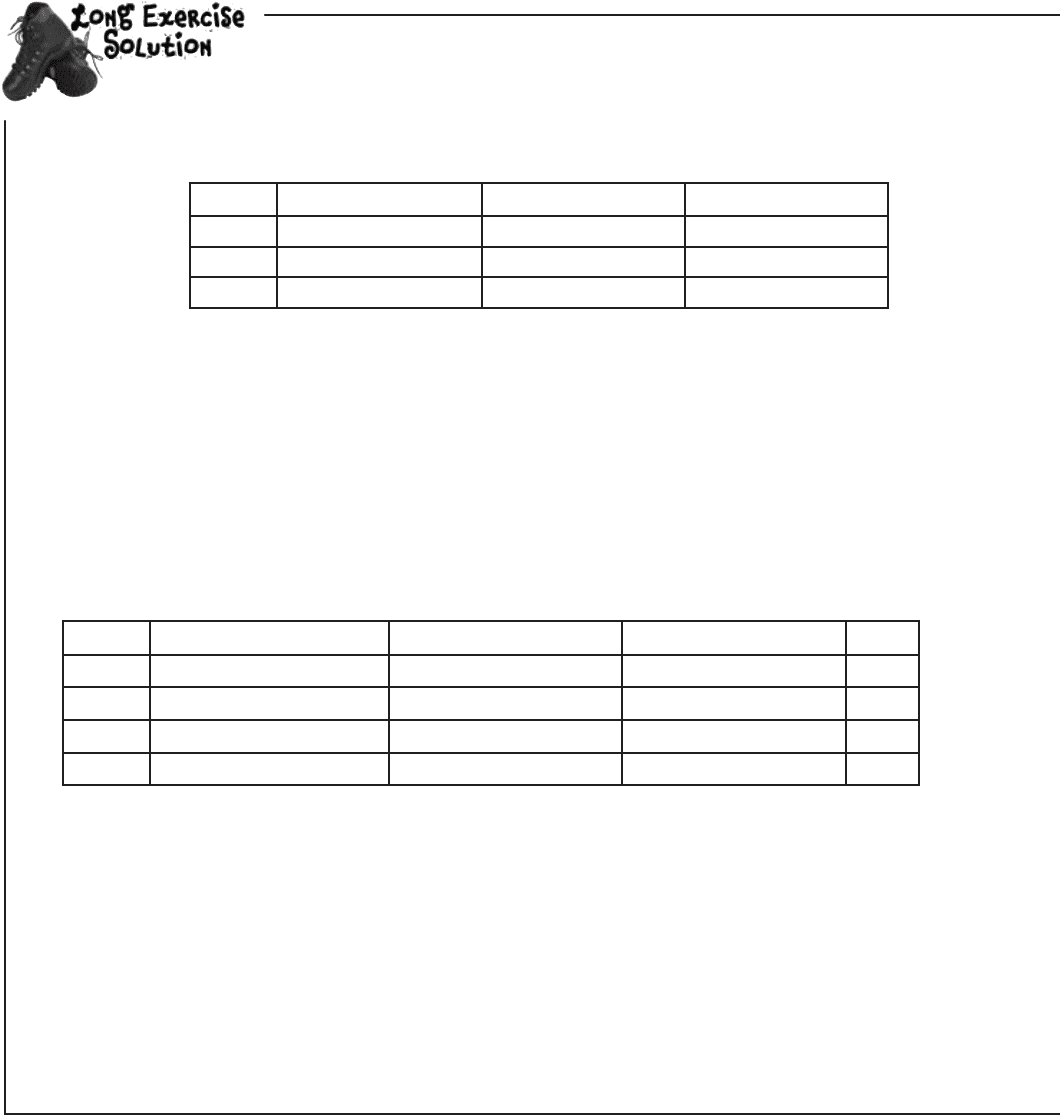
Fat Dan thinks that one or more of his croupiers are somehow influencing the results of the roulette
wheel. Here’s data showing the observed frequency with which the ball lands in each color pocket
for each of the croupiers. Conduct a test at the 5% level to see whether pocket color and croupier
are independent, or whether there is sufficient evidence to show there might be something going on.
Step 1: Decide on the hypothesis you’re going to test, and its alternative.
You want to test whether or not pocket color is independent of croupier. This gives
H
0
: Roulette wheel pocket color and croupier are independent.
H
1
: Pocket color and croupier are not independent.
Step 2: Find the expected frequencies and the degrees of freedom. Use the table of expected frequencies below.
There are 3 columns and 3 rows, and we find the number of degrees of freedom by multiplying together (number
of rows - 1) and (number of columns - 1). This gives us
ν = 2x2
= 4
Step 3: Determine the critical region for your decision.
Croupier A Croupier B Croupier C
Red
375 367 357
Black
379 336 362
Green
46 37 41
Croupier A Croupier B Croupier C Total
Red
1099
×
800/2300=382.3 1099
×
740/2300=353.6
1099x760/2300=363.1 1099
Black
1077
×
800/2300=374.6
1077x740/2300=346.5 1077x760/2300=355.9 1077
Green
124
×
800/2300=43.1
124x740/2300=39.9 124x760/2300=41.0 124
Total
800
740 760 2300
You find the expected frequencies by multiplying each row and column total, and dividing by the grand total.
From probability tables, χ
2
5%
(4) = 9.49. This means that the critical region is given by X
2
> 9.49.
chapter-ending long exercise solution

you are here 4 603
the χ
2
distribution
The critical region is given by X
2
> 9.48. As X
2
= 1.583, the test statistic is outside the critical region.
Step 4: Calculate the test statistic Χ
2
. Use the table below to help you.
Step 5: See whether the test statistic is within the critical region.
As your test statistic lies outside the critical region, this means that there is insufficient evidence at the 5%
level to reject the null hypothesis. In other words, you accept the null hypothesis that pocket color and croupier
are independent.
Step 6: Make your decision.
Observed Expected (O - E)
2
E
375 382.3 (375-382.3)
2
/382.3 = 53.29/382.3 = 0.139
379 374.6 (379-374.6)
2
/374.6 = 19.36/374.6 = 0.005
46 43.1 (46-43.1)
2
/43.1 = 8.41/43.1 = 0.195
367 353.6 (367-353.6)
2
/353.6 = 179.56/353.6 = 0.508
336
346.5 (336-346.5)
2
/346.5 = 110.25/346.5 = 0.318
37
39.9 (37-39.9)
2
/39.9 = 8.41/39.9 = 0.211
357
363.1 (357-363.1)
2
/363.1 = 37.21/363.1 = 0.102
362
355.9 (362-355.9)
2
/355.9 = 37.21/355.9 = 0.105
41
41.0 (41-41)
2
/41 = 0/41 = 0
ΣO = 2300
ΣE = 2300
Σ
(O - E)
2
= 1.583
E
A
B
C
This means that the test statistic is given by X
2
= 1.583.

this is a new chapter 605
correlation and regression
15
What’s My Line?
The more I use this
sandpaper, the less
chance there is of him
noticing my stubble.
Have you ever wondered how two things are connected?
So far we’ve looked at statistics that tell you about just one variable—like men’s height,
points scored by basketball players, or how long gumball flavor lasts—but there are other
statistics that tell you about the connection between variables. Seeing how things are
connected can give you a lot of information about the real world, information that you can
use to your advantage. Stay with us while we show you the key to spotting connections:
correlation and regression.
606 Chapter 15
Never trust the weather
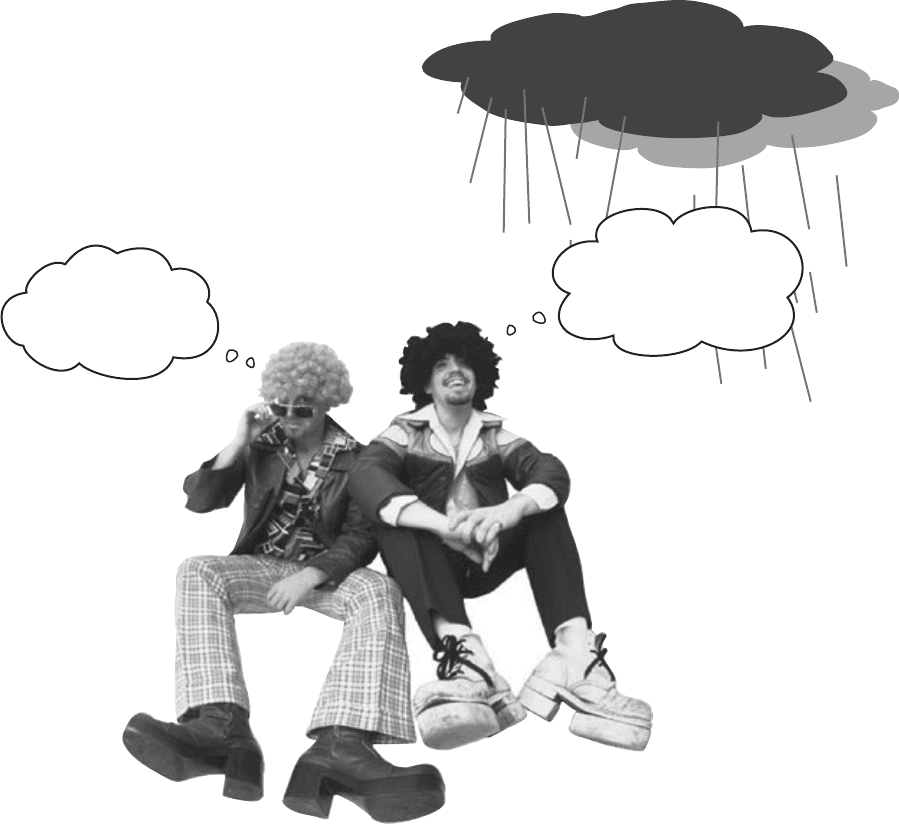
Concerts are best when they’re in the open air—at least that’s
what these groovy guys think. They have a thriving business
organizing open-air concerts, and ticket sales for the summer
look promising.
Today’s concert looks like it will be one of their best ones ever.
The band has just started rehearsing, but there’s a cloud on the
horizon...
Feel that funky
rhythm, baby.
Sweet! But is that
a rain cloud I see
up there?
Before too long the sky’s overcast, temperatures are dipping, and
it looks like rain. Even worse, ticket sales are hit. The guys are in
trouble, and they can’t afford for this to happen again.
What the guys want is to be able to predict what concert attendance
will be given predicted hours of sunshine. That way, they’ll be able to
gauge the impact an overcast day is likely to have on attendance. If
it looks like attendance will fall below 3,500 people, the point where
ticket sales won’t cover expenses, then they’ll cancel the concert
They need your help.
the sunshine-attendance connection

you are here 4 607
correlation and regression
That’s easy. We can find the mean
and standard deviation and look at the
distribution. That will tell us everything.
Let’s analyze sunshine and attendance
Here’s sample data showing the predicted hours of sunshine and concert
attendance for different events. How can we use this to estimate ticket
sales based on the predicted hours of sunshine for the day?
Most of the time, that’s exactly the sort of thing we’d
need to do to predict likely outcomes.
The problem this time is, what would we find the mean and standard
deviation of ? Would we use the concert attendance as the basis for our
calculations, or would we use the hours of sunshine? Neither one of them
gives us all the information that we need. Instead of considering just one set of
data, we need to look at both.
So far we’ve looked at independent random variables, but not ones that are
dependent. We can assume that if the weather is poor, the probability of high
attendance at an open air concert will be lower than if the weather is sunny.
But how do we model this connection, and how do we use this to predict
attendance based on hours of sunshine?
It all comes down to the type of data.
How would you go about modelling the connection
between sets of data?
Sunshine (hours)
1.9 2.5 3.2 3.8 4.7 5.5 5.9 7.2
Concert attendance (100’s)
22 33 30 42 38 49 42 55
608 Chapter 15
Exploring types of data
Up until now, the sort of data we’ve been dealing with has been univariate.
Univariate data concerns the frequency or probability of a single variable. As an
example, univariate data could describe the winnings at a casino or the weights of
brides in Statsville. In each case, just one thing is being described.
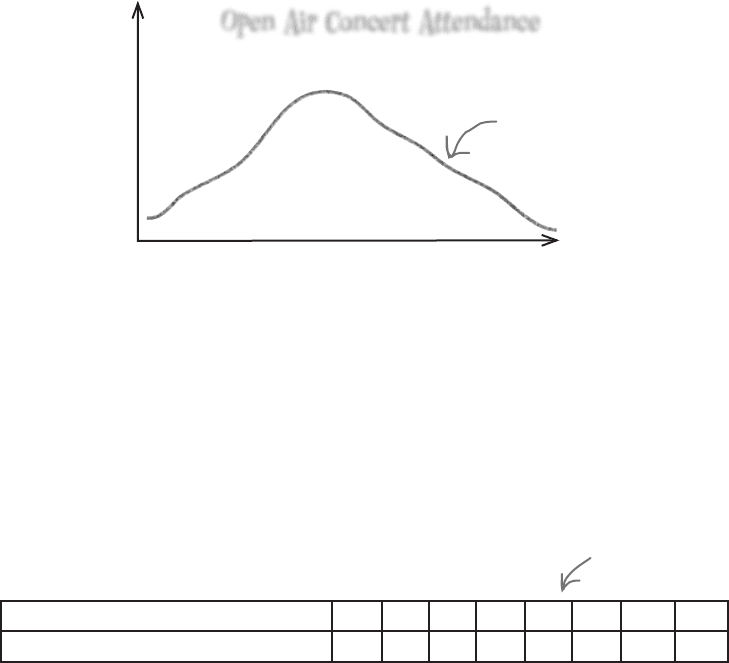
What univariate data can’t do is show you connections between sets of data. For
example, if you had univariate data describing the attendance figures at an open air
concert, it wouldn’t tell you anything about the predicted hours of sunshine on that
day. It would just give you figures for concert attendance.
So what if we do need to know what the connection is between variables? While
univariate data can’t give us this information, there’s another type of data that
can—bivariate data.
Open Air Concert Attendance
Attendance
Frequency
Univariate data for concert
attendance tells you nothing
about the hours of sunshine.
All about bivariate data
Bivariate data gives you the value of two variables for each observation, not
just one. As an example, it can give you both the predicted hours of sunshine and
the concert attendance for a single event or observation, like this.
Sunshine (hours)
1.9 2.5 3.2 3.8 4.7 5.5 5.9 7.2
Concert attendance (100’s)
22 33 30 42 38 49 42 55
Bivariate data gives you the
value of two variables for each
observation.
If one of the variables has been controlled in some way or is used to explain the
other, it is called the independent or explanatory variable. The other variable
is called the dependent or response variable. In our example, we want to use
sunshine to predict attendance, so sunshine is the independent variable, and
attendance is the dependent.
introducing bivariate data
you are here 4 609
correlation and regression
Visualizing bivariate data
Just as with univariate data, you can draw charts for bivariate data to
help you see patterns. Instead of plotting a value against its frequency or
probability, you plot one variable on the x-axis and the other variable against
it on the y-axis. This helps you to visualize the connection between the two
variables.
This sort of chart is called a scatter diagram or scatter plot, and
drawing one of these is a lot like drawing any other sort of chart.
Start off by drawing two axes, one vertical and one horizontal. Use the
x-axis for one variable and the y-axis for the other. The independent variable
normally goes along the x-axis, leaving the dependent variable to go on
the y-axis. Once you’ve drawn your axes, you then take the values for each
observation and plot them on the scatter plot.
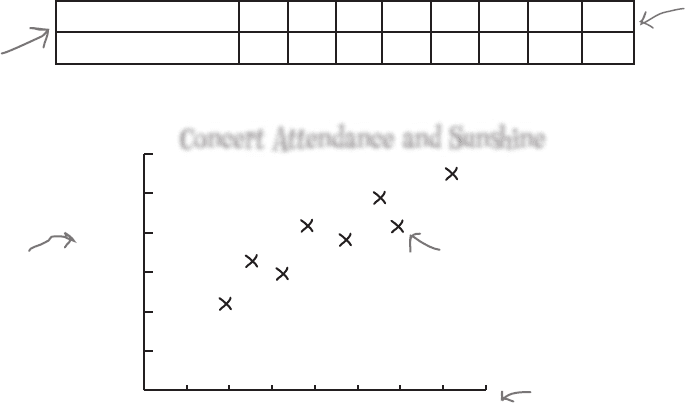
Here’s a scatter plot showing the number of hours of sunshine and concert
attendance figures for particular events or observations. As the predicted
number of hours sunshine is the independent variable, we’ve plotted it on
the x-axis. The concert attendance is the dependent variable, so that’s on the
y-axis.
x (sunshine)
1.9 2.5 3.2 3.8 4.7 5.5 5.9 7.2
y (attendance)
22 33 30 42 38 49 42 55
Here’s the data.
Can you see how the scatter diagram helps you visualize patterns in the data?
Can you see how this might help us to define the connection between open air
concert attendance and predicted number of hours sunshine for the day?
Hours sunshine goes
on the x-axis,
attendance on the
y-axis.
sunshine (hours)
attendance (100’s)
These are all the data points.
Sunshine is on the x-axis.
Attendance is
on the y-axis.
Concert Attendance and Sunshine
0 1 2 3 4 5 6 7 8
0
10
20
30
40
50
60
610 Chapter 15
sunshine (hours)
attendance (100’s)
Concert Attendance and Sunshine
0 1 2 3 4 5 6 7 8
0
10
20
30
40
50
60
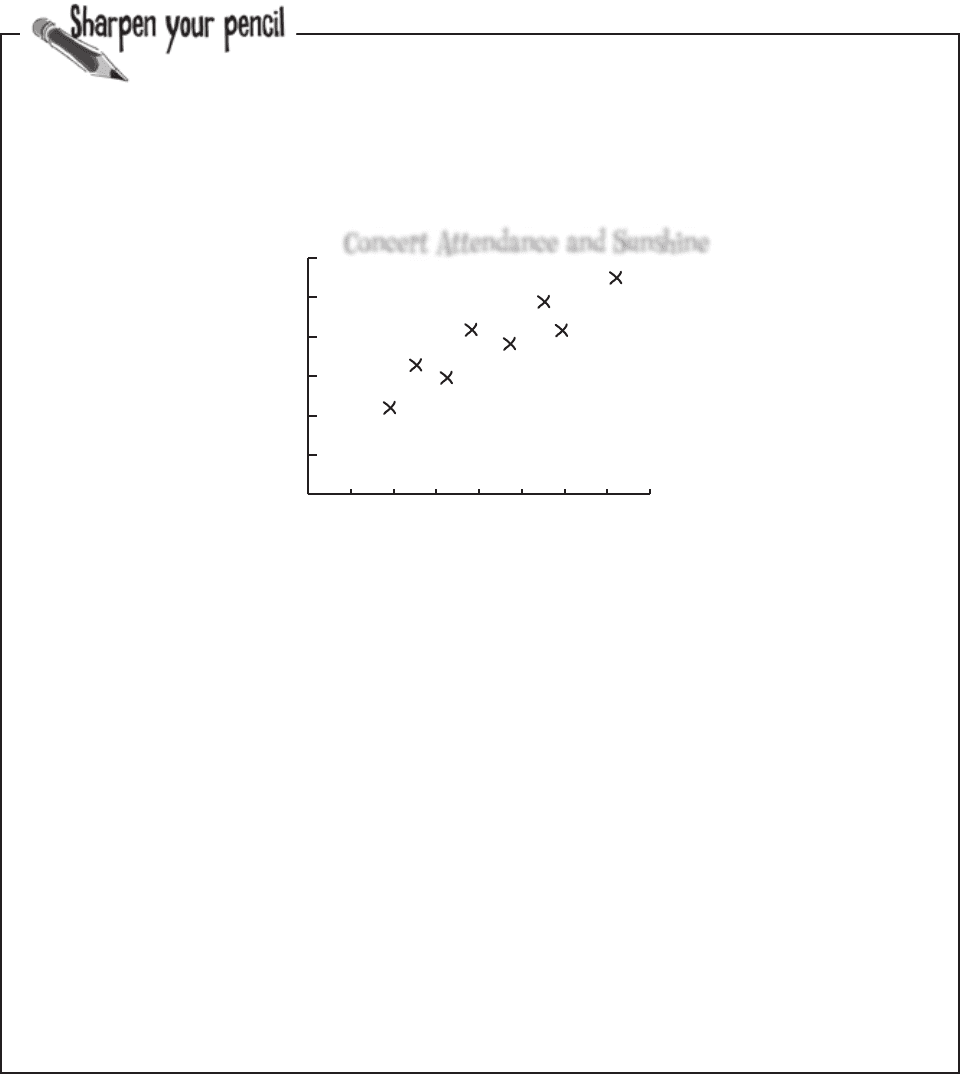
We know we haven’t shown you how to analyze bivariate data yet,
but see how far you get in analyzing the scatter diagram for the
concert organizers.
What sort of patterns do you see in the chart? How can you relate
this to the underlying data? What do you expect open air concert
attendance to be like if it’s sunny? What about if it’s overcast?
sharpen your pencil