Griffiths D. Head First Statistics
Подождите немного. Документ загружается.

you are here 4 631
correlation and regression
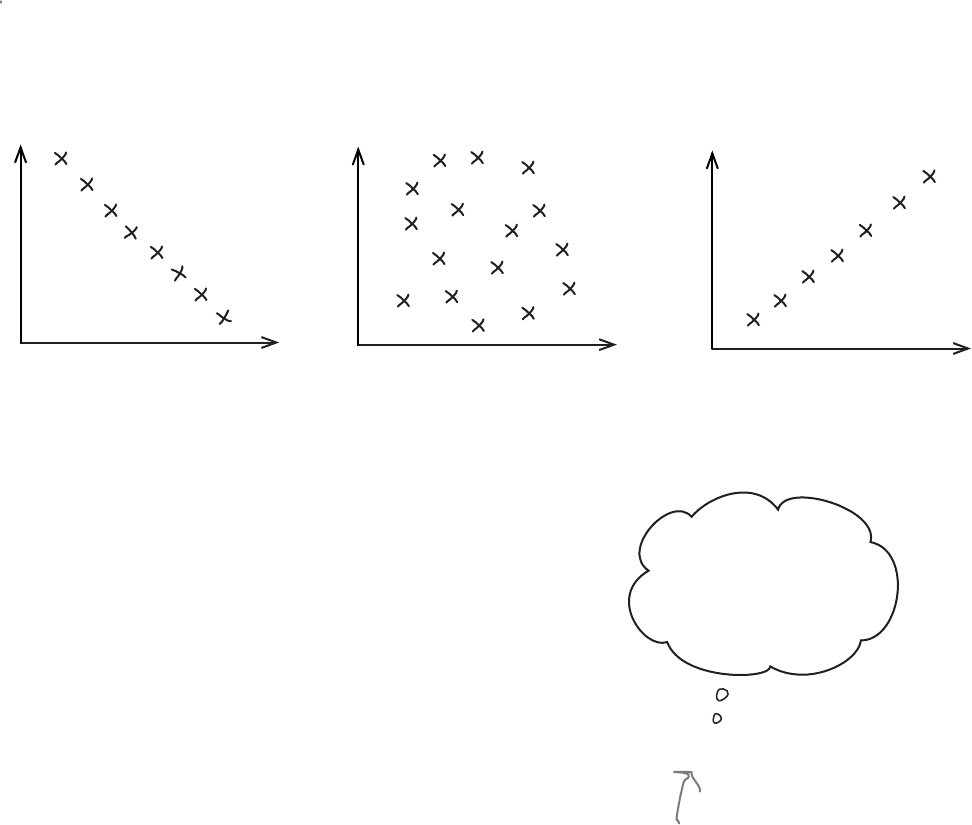
The correlation coefficient is a number between -1 and 1 that describes the
scatter of data points away from the line of best fit. It’s a way of gauging how
well the regression line fits the data. It’s normally represented by the letter r.
If r is -1, the data is a perfect negative linear correlation, with all of the
data point in a straight line. If r is 1, the data is a perfect positive linear
correlation. If r is 0, then there is no correlation.
r=-1
r=0
r=1
Usually r is somewhere between these values, as -1, 0, and 1
are all extreme.
If r is negative, then there’s a negative linear correlation
between the two variables. The closer r gets to -1, the stronger
the correlation, and the closer the points are to the line.
If r is positive, then there’s a positive linear correlation
between the variables. The closer r gets to 1, the stronger the
correlation.
In general, as r gets closer to 0, the linear correlation gets
weaker. This means that the regression line won’t be able to
predict y values as accurately as when r is close to 1 or -1. The
pattern might be random, or the relationship between the
variables might not be linear.
If we can calculate r for the concert data, we’ll have an idea
of how accurately we can predict concert attendance based
on the predicted hours of sunshine. So how do we calculate r?
Turn the page and we’ll show you how.
r
I’m the correlation
coefficient, r. I
say how strong the
correlation is between
the two variables.
Think of r as standing
for relationship.
The correlation coefficient measures how well the line fits the data

632 Chapter 15
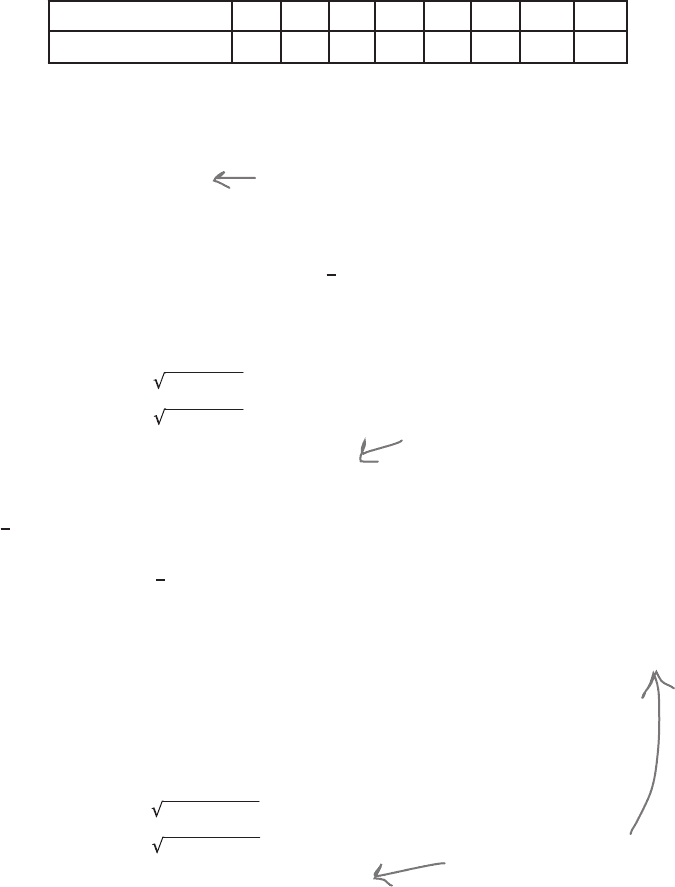
So how do we calculate the correlation coefficient, r?
We’re not going to show you the proof for this, but the correlation
coefficient r is given by
where s
x
is the standard deviation of the x values in the sample, and s
y
is
the standard deviation of the y values.
I get it. We use
the value of b to
help us calculate r.
r = b s
x
s
y
We’ve already done most of the hard work.
Since we’ve already calculated b, all we have left to find is s
x
and s
y
. What’s
more, we’re already most of the way towards finding s
x
.
When we calculated b, we needed to find the value of Σ(x - x)
2
. If we divide
this by n - 1, this actually gives us the sample variance of the x values. If we
then take the square root, we’ll have s
x
. In other words,
s
x
is the standard deviation of the x values in the
sample. s
y
is the standard deviation of the y values.
b is the slope of the line
of best fit that you’ve
already found.
This is the
standard deviation
of the x values in
the sample, it’s the
same formula you’ve
seen before
You calculated this bit
earlier, so there’s no need
to calculate it again.
The only remaining piece of the equation we have to find is s
y
, the standard
deviation of the y values in the sample. We calculate this in a similar way to
finding s
x
.
Let’s try finding what r is for the concert attendance data.
This is the standard deviation of the x values in the
sample, and you’ve done these sorts of calculations before.
calculating the correlation coefficient
There’s a formula for calculating the correlation coefficient, r
s
x
=
√
Σ(x - x)
2
n - 1
s
y
=
√
Σ(y - y)
2
n - 1
you are here 4 633
correlation and regression
Find r for the concert data
Let’s use the formula to find the value of r for the concert data. First of
all, here’s a reminder of the data:
x (sunshine)
1.9 2.5 3.2 3.8 4.7 5.5 5.9 7.2
y (attendance)
22 33 30 42 38 49 42 55
To find r, we need to know the values of b, s
x
, and s
y
so that we can use
them in the formula on the opposite page. So far we’ve found that
b = 5.32
but what about s
x
and s
y
?
Let’s start with s
x
. We found earlier that Σ(x - x)
2
= 23.02, and we know
that the sample size is 8. This means that if we divide 23.02 by 7, we’ll
have the sample variance of x. To find s
x
, we take the square root.
Σ(y - y)
2
= (22 - 38.875)
2
+ (33 - 38.875)
2
+(30 - 38.875)
2
+(42 - 38.875)
2
+ (38 - 38.875)
2
+
(49 - 38.875)
2
+ (42 - 38.875)
2
+ (55 - 38.875)
2
= (-16.875)
2
+ (-5.875)
2
+ (-8.875)
2
+ (3.125)
2
+ (-0.875)
2
+ (10.125)
2
+ (3.125)
2
+ (16.125)
2
= 780.875 (to 2 decimal places)
The only piece of the formula we have left to find is s
y
. We already know
that y = 38.875, as we found it earlier on, so this means that
We can now use this to find s
y
, by dividing by n - 1 and taking the square
root.
All we need to do now is use b, s
x
, and s
y
to find the value of the
correlation coefficient r.
This is the slope of the line we found earlier.
This is the standard deviation of the x values. It’s a sample,
so we divide by n - 1.
Finally, we use the y values in the sample
to find s
y
, the standard deviation of y.
s
x
= (23.02/7)
= 3.28857
= 1.81 (to 2 decimal places)
s
y
= (780.875/7)
= 111.55357
= 10.56 (to 2 decimal places)
634 Chapter 15
Q:
I’ve seen other ways of calculating
r. Are they wrong?
A: There are several different forms of the
equation for finding r, but underneath, they’re
basically the same. We’ve used the simplest
form of the equation so that it’s easier to
see what you’ve already calculated through
finding b.
Q:
Are the results accurate with such
a small sample?
A: A larger sample would definitely be
better, but we used a small sample just to
make the calculations easier to follow.
Q:
You haven’t proved or derived why
you calculate the values of b and r in this
way. Why not?
A: Deriving the formula for b and r is quite
complex and involved, so we’ve decided not
to go through this in the book. The key thing
is that you understand when and how to use
them.
Q:
What’s the expected concert
attendance if the predicted hours of
sunshine is 0?
A: We can’t say for certain because this
is quite a way outside the range of data we
have. The line of best fit is a pretty good
estimate for the range of data that we have,
but we can’t say with any certainty what
the concert attendance will be like outside
this range. The data might follow a different
pattern outside this range, so any estimate
we gave would be unreliable.
Q:
When we were looking at averages,
we saw that univariate data can have
outliers. What about bivariate data?
A: Yes, bivariate data can have outliers
too. Outliers are points that lie a long way
from your regression line. If you have
outliers, then this can mean that you have
anomalies in your data set, or alternatively,
that your regression line isn’t a good fit of
the data.
Q:
I’ve heard of influential
observations. What are they?
A: Influential observations are points that
lie a long way horizontally from the rest of
the data. Because of this, they have the
effect of pulling the regression line towards
them.
Q:
So is an influential observation the
same as an outlier?
A: No. Outliers lie a long way from the
line. Influential observations lie a long way
horizontally from the data.
Find r for the concert data, continued
r = bs
x
/s
y
= 5.32 x 1.81/10.56
= 0.91 (to 2 decimal places)
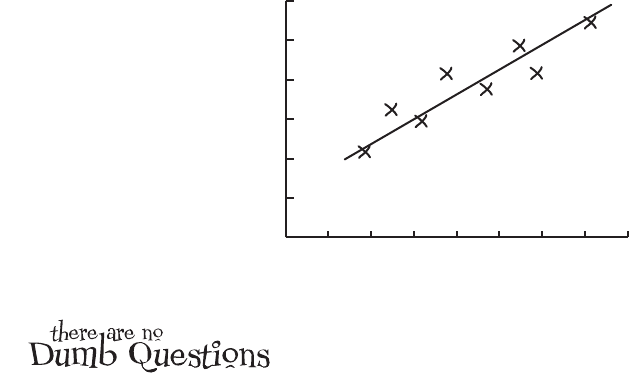
As r is very close to 1, this means that there’s strong positive
correlation between open air concert attendance and hours
of predicted sunshine. In other words, based on the data that
we have, we can expect the line of best fit, y = 15.80 + 5.32x,
to give a reasonably good estimate of the expected concert
attendance based on the predicted hours of sunshine.
sunshine (hours)
attendance (100’s)
0 1 2 3 4 5 6 7 8
0
10
20
30
40
50
60
x
y
r = 0.91
calculating r and no dumb questions
Now that we’ve found that b = 5.32, s
x
= 1.81, and s
y
= 10.56,
we can put them together to find r.

you are here 4 635
sunshine (hours)
attendance (100’s)
0 1 2 3 4 5 6 7 8
0
10
20
30
40
50
60
x
y
r = 0.91
Awesome, dude, you rock!
Here’s a free ticket for
our next event.
You’ve saved the day!
The concert organizers are amazed at the work you’ve done with
their concert data. They now have a way of predicting what
attendance will be like at their concerts based on the weather
reports, which means they have a way of maximizing their profits.
Woah dude! This
regression thang
is boogalicious!
correlation and regression
636 Chapter 15
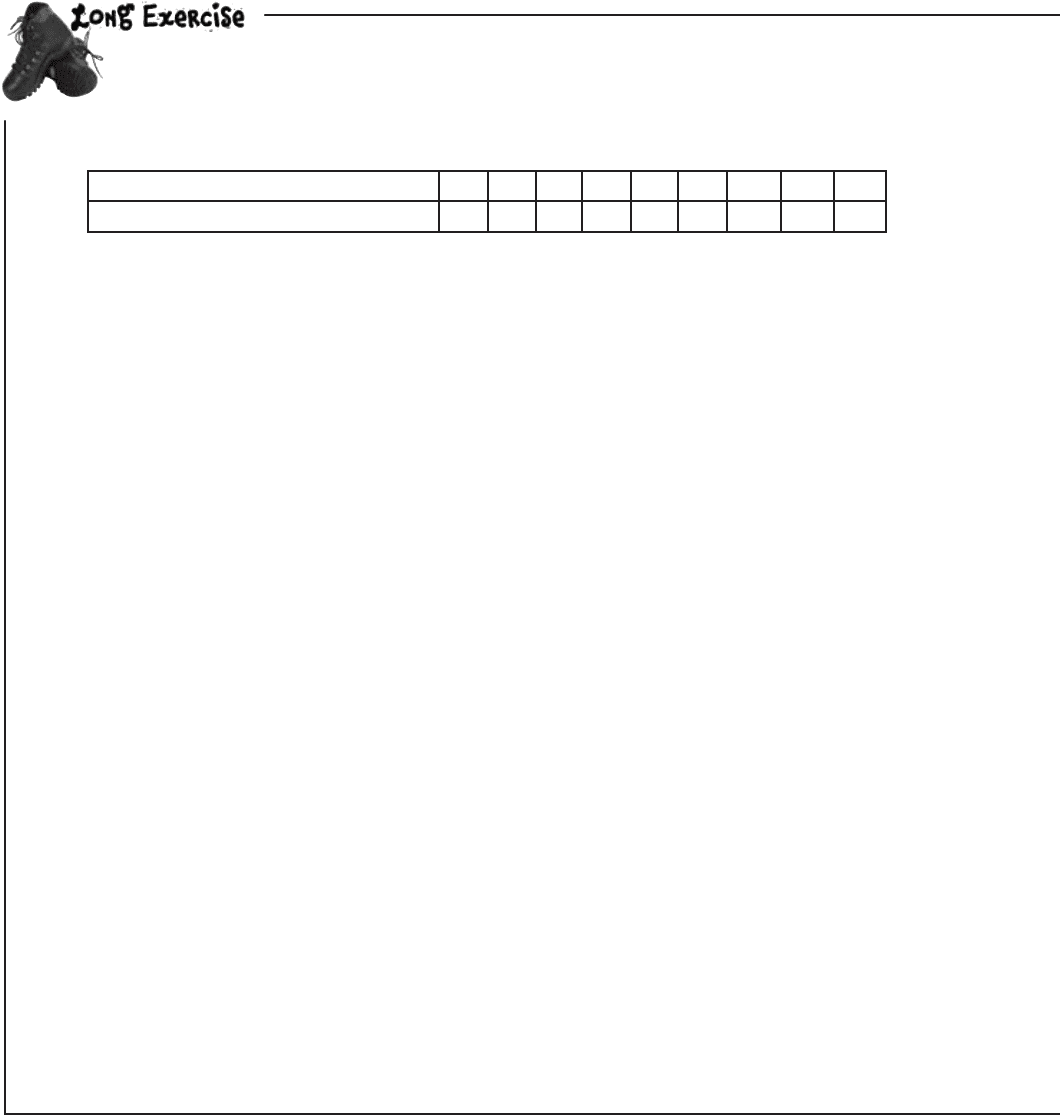
The evil Swindler has been collecting data on the effect radiation exposure has on Captain
Amazing’s super powers. Here is the number of minutes of exposure to radiation, paired with
the number of tons Captain Amazing is able to lift:
Radiation exposure (minutes)
3 3.5 4 4.5 5 5.5 6 6.5 7
Weight (tons)
14 14 12 10 8 9.5 8 9 6
Your job is to use least squares regression to find the line of best fit, and then find the correlation coefficient to
describe the strength of the relationship between your line and the data. Sketch the scatter diagram too.
If Swindler exposes Captain Amazing to radiation for 5 minutes, what weight do you expect Captain Amazing to be
able to lift?
long exercise

you are here 4 637
correlation and regression
We’ve left you
plenty of space for
your calculations

638 Chapter 15
The evil Swindler has been collecting data on the effect radiation exposure has on Captain
Amazing’s super powers. Here is the number of minutes of exposure to radiation, paired with
the number of tons Captain Amazing is able to lift:
Radiation exposure (minutes)
4 4.5 5 5.5 6 6.5 7
Weight (tons)
12 10 8 9.5 8 9 6
Your job is to use least squares regression to find the line of best fit, and then find the correlation coefficient to
describe the strength of the relationship between your line and the data. Sketch the scatter diagram too.
If Swindler exposes Captain Amazing to radiation for 5 minutes, what weight do you expect Captain Amazing to be
able to lift?
Let’s use x to represent minutes of radiation exposure and y to represent weight in tons. We need to find the
regression line y = a + bx, so let’s start by calculating x and y.
x = (4 + 4.5 + 5 + 5.5 + 6 + 6.5 + 7)/7
= 38.5/7
= 5.5
y = (12 + 10 + 8 + 9.5 + 8 + 9 + 6)/7
= 62.5/7
= 8.9 (to 2 decima
l places)
Next, let’s calculate Σ(x - x)(y - y) and Σ(x - x)
2
, and then b.
Σ(x - x)(y - y) = (4-5.5)(12-8.9) + (4.5-5.5)(10-8.9) + (5-5.5)(8-8.9) + (5.5-5.5)(9.5-8.9) +
(6-5.5)(8-8.9) + (6.5-5.5)(9-8.9) + (7-5.5)(6-8.9)
= (-1.5)(3.1) + (-1)(1.1) + (-0.5)(-0.9) + (0)(0.6) + (0.5)(-0.9) + (1)(0.1) + (1.5)(-2.9)
= -4.65 - 1.1 + 0.45 + 0 - 0.45 + 0.1 - 4.35
= -10
Σ(x - x)
2
= (4-5.5)
2
+ (4.5-5.5)
2
+ (5-5.5)
2
+ (5.5-5.5)
2
+ (6-5.5)
2
+ (6.5-5.5)
2
+ (7-5.5)
2
= (-1.5)
2
+ (-1)
2
+ (-0.5)
2
+ 0
2
+ 0.5
2
+ 1
2
+ 1.5
2
= 2.25 + 1 + 0.25 + 0 + 0.25 + 1 + 2.25
= 7
b =
Σ(x - x)(y - y)
Σ
(x - x)
2
= -10/7
= -1.43 (to 2 decimal places)
long exercise solution
you are here 4 639
correlation and regression
Now that we've found b, let's use it to find a.
a = y - bx
= 8.9 + 1.43 x 5.5
= 8.9 + 7.86
= 16.76
This means that the line of best fit is given by y = 16.76 -1.43x
The correlation coefficient, r, is given by r = bs
x
/s
y
where s
x
and s
y
are the standard deviations of the x and y
variables. We’ve found b, so we need to find s
x
and s
y
.
s
x
= Σ(x - x)
2
n - 1
= 7/6
= 1.08
Σ(y - y)
2
= (12-8.9)
2
+ (10-8.9)
2
+ (8-8.9)
2
+ (9.5-8.9)
2
+ (8-8.9)
2
+ (9-8.9)
2
+ (6-8.9)
2
= 3.1
2
+ 1.1
2
+ (-0.9)
2
+ 0.6
2
+ (-0.9)
2
+ 0.1
2
+ (-2.9)
2
= 9.61 + 1.21 + 0.81 + 0.36 + 0.81 + 0.01 + 8.41
= 21.22
s
y
= Σ(y - y)
2
n - 1
= 21.77/6
= 1.90
Putting this together gives us
r = bs
x
/s
y
= -1.43 x 1.08/1.9
= -0.81 (to 2 decimal places)
If x = 5, then we find y by calculating
y = 16.76 - 1.43x
= 16.76 - 1.43 x 5
= 9.61
In other w
ords, after 5 minutes of exposure to radiation, we'd expect Captain Amazing to be able lift 9.61 tons.
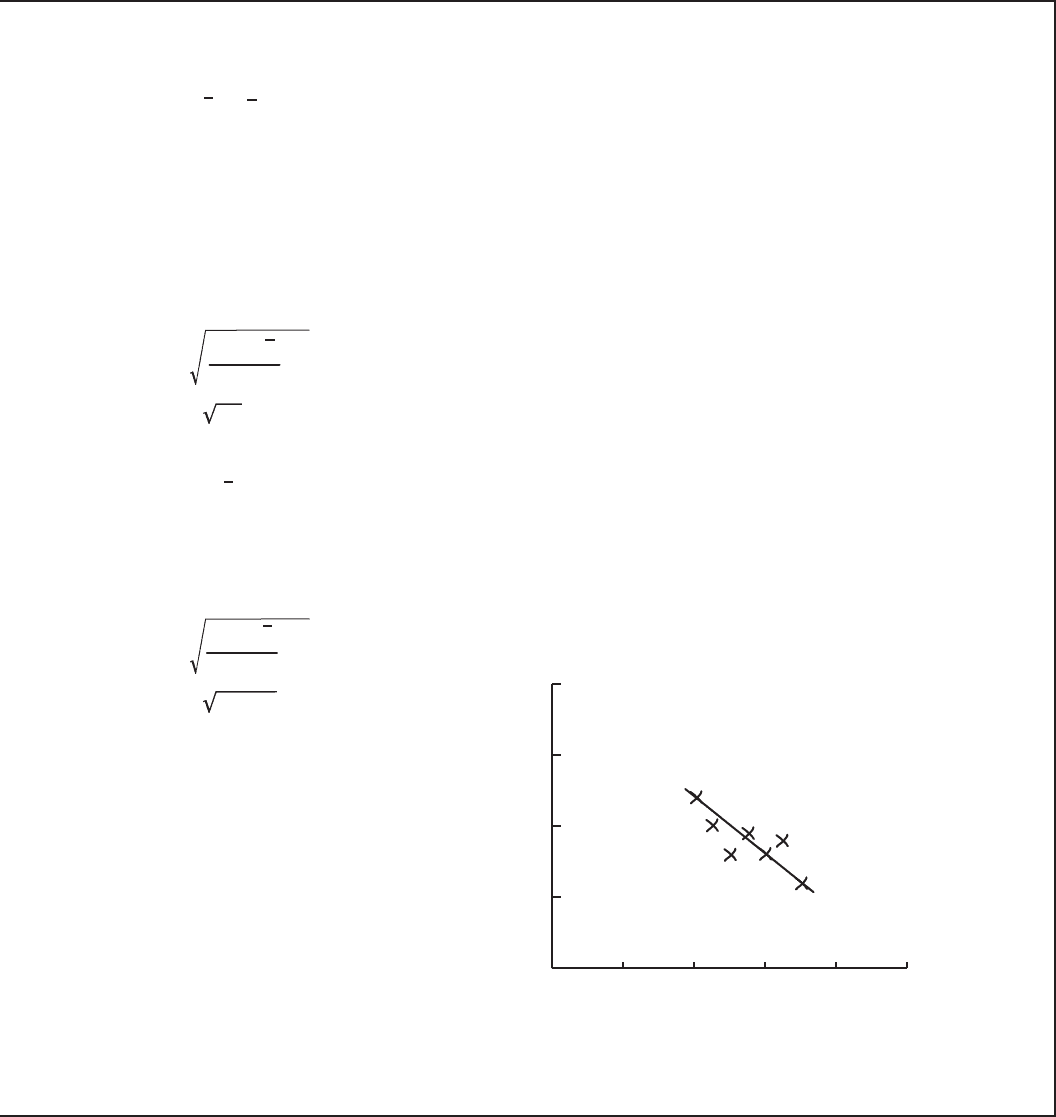
Radiation exposure (minutes)
Weight (tons)
y = 16.76 - 1.43x
r = -0.81
x
y
108642
0
5
10
15
20

640 Chapter 15
Univariate data deals with just one
variable. Bivariate data deals with two
variables.
A scatter diagram shows you patterns in
bivariate data.
Correlations are mathematical
relationships between variables. It does
not mean that one variable causes the
other. A linear correlation is one that
follows a straight line.
Positive linear correlation is when low
x values correspond to low y values,
and high x values correspond to high
y values. Negative linear correlation is
when low x values correspond to high
y values, and high x values correspond
to low y values. If the values of x and y
form a random pattern, then there’s no
correlation.
The line that best fits the data points is
called the line of best fit.
Linear regression is a mathematical way
of finding the line of best fit, y = a + bx.
The sum of squared errors, or SSE, is
given by Σ(y - y)
2
.
The slope of the line y = a + bx is
b = Σ(x - x)(y - y)
Σ(x - x)
2
The value of a is given by
a = y - bx
The correlation coefficient, r, is a number
between -1 and 1 that describes the
scatter of data away from the line of
best fit. If r = -1, there is perfect negative
linear correlation. If r = 1, there is perfect
positive linear correlation. If r = 0, there
is no correlation. You find r by calculating
r = b s
x
s
y
^
bullet points