Kallen A. Understanding Biostatistics
Подождите немного. Документ загружается.


THE COX PROPORTIONAL HAZARDS MODEL 333
where
ˆ
S
1
(t, β) =
1
n
i
z
i
e
z
i
β
Y
i
(t),
ˆ
S
0
(t, β) =
1
n
i
e
z
i
β
Y
i
(t).
If we plug this into equation (12.6) we get our final estimating equation for β. Varying the
weight function defines a whole family of proportional hazard estimating equations (and
therefore tests), of which the original Cox model used a(u) = 1, and we get a Wilcoxon-type
test if we choose a(u) = u. We will return to these models in Chapter 13, where we will further
discuss the confidence function and how it can be used in situations where the assumption
of independence between event times is not fulfilled, as is the case when we analyze
recurrent events.
Cox originally derived this model in a different way. To see how he did it, we write the
estimating equation that determines β (which we have written as an integral above) as a sum:
U
n
(β) =
i
(z
i
− ∂
β
ln
ˆ
S
0
(t
i
,β)) = 0.
The sum is over observed event times. It follows that U
n
(β) is the derivative of
ln PL(β), where
PL(β) =
t
i
e
z
i
β
ˆ
S
0
(t
i
β)
.
This is called the Cox partial likelihood. The factors in this product are the conditional
probabilities that an event, observed at time t
i
, is from the individual with covariate value z
i
,
among those who are still at risk. This follows the idea of survival analysis in general, that
observed times are analyzed conditionally on the state of the world at that time. Technically
this is not the model likelihood, but Cox treated it as if it was, from an analysis point of view.
In order to see how the partial likelihood above relates to the true likelihood, we need
to write down the latter explicitly. For this purpose we recall from Section 12.4 that the
log-likelihood for this type of data is given by
i
∞
0
ln λ
i
(t, β)dN
i
(t) −
∞
0
Y
i
(t)λ
i
(t, β)dt
.
The Cox model corresponds to the assumption that λ
i
(t, β) = λ
0
(t)e
z
i
β
for some baseline
hazard λ
0
(t). If we insert this expression for λ
i
(t, β) into the log-likelihood we get
∞
0
i
(z
i
β + ln λ
0
(t))dN
i
(t) −
∞
0
λ
0
(t)
ˆ
S
0
(β, t)dt
.
If we know β, we can use dN
+
(t)/
ˆ
S
0
(β, t) to estimate λ
0
(t)dt, and if we insert this into the
expression above, we see that the log-likelihood is
i
∞
0
(z
i
β − ln
ˆ
S
0
(β, t))dN
i
(t)

334 FROM THE LOG-RANK TEST TO THE COX PROPORTIONAL HAZARDS MODEL
plus a term that does not involve β. The derivative of this is the U
n
(β) above, which means
that the Cox partial likelihood is essentially a profiled likelihood, where we have profiled out
the unknown baseline hazard by estimating it with the Nelson–Aalen estimator.
There is one more important question we need to address. It has to do with what will
happen when the Cox model is true, but we have omitted to include one of the covariates
in the analysis. This is the same discussion as we had in Section 9.6, but for this type of
data/model. Let Z represent the observed covariates and ξ the omitted one. The explicit
assumption is that θ = e
Zβ+ξ
= ηe
Zβ
, where η = e
ξ
. Estimation in the Cox model is based
on the functions
ˆ
S
0
(t, β) and
ˆ
S
1
(t, β) previously defined. In the presence of heterogeneity the
expected values of these are given by
S
k
(t, β) =
z
k
F
c
(t−,ηe
zβ
)ηe
zβ
dP(η)
dF (z) =−
z
k
L
(e
zβ
(t))e
zβ
dF (z),
where we assume that η is independent of Z in the population. (L(u) is the Laplace transform
of the frailty distribution P(θ).) The true conditional expectation above is therefore
E(Z|T = t) =
w(t, e
zβ
)ze
zβ
dF (z)
w(t, e
zβ
)e
zβ
dF (z)
,w(t, θ) = L
(θ(t)).
With no missing covariates, we have that w(t, θ) = F
c
(t, θ), but if we have missed some
important predictor for the event in our model, and we analyze the data using a Cox model,
we will underestimate the true effect of the covariate on survival time. The next example
investigates this in more detail for the log-rank test. It may be skipped, as one can read the
next section without these details. For a heuristic explanation of this material, see Box 12.4.
Example 12.7 Assume that we have continuous distributions, that the length of the study is
τ, and that there is no other censoring. The hazard factor θ
∗
in a log-rank test is the solution
to the equation which equates the expected number of events observed in the first group to
what is expected using the combined hazard, which is the equation
rF (τ) =
τ
0
rF
c
(t)
rF
c
(t) + (1 − r)θ
∗
G
c
(t)
d(t).
Assume there is heterogeneity in the population such that if the frailty for a patient is η
without treatment, it becomes θη with treatment. This means that θ is the individual hazard
ratio, assumed constant. In that case the survival functions in the formula above are obtained
as Laplace transforms of the frailty distribution, computed for the values of the cumulative
hazards. This defines a relation between θ
∗
and θ. If we change the variable in this integral to
u = (t), this relation is
1 − L((τ)) +
(τ)
0
L(u)(rL
(u) + (1 − r)θL
(θu))
rL(u) + (1 − r)θ
∗
L(θu)
du = 0.
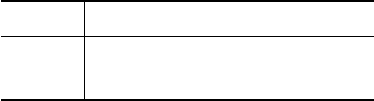
This relation is illustrated in Figure 12.7, assuming gamma frailty and that θ
∗
= 0.91. We
see that if there is considerable heterogeneity, expressed as a large variance for the frailty
distribution, we may have a true treatment effect that is as large as a reduction of almost 20%.
THE COX PROPORTIONAL HAZARDS MODEL 335
Box 12.4 Bias due to heterogeneity: a heuristic explanation
The proportional hazards model with frailty for a time-to-event variable T says that,
conditionally on the frailty η, (t|η) = ηe
zβ
0
(t). Assume that
0
(t) = λt
γ
is from a
Weibull distribution. This can also be expressed as an AFT model, which means a linear
model in ln T :
ln T = γ
−1
(−ln λ − zβ + X + Y ),
where X has the smallest extreme value (SEV) distribution and Y has the distribution
of −ln η. It is convenient to assume that the frailty has a lognormal distribution with
mean one, which means that Y ∈ N(σ
2
/2,σ
2
) and therefore that the variance of ln T is
(η
2
+ σ
2
)/γ
2
, where η
2
is the variance of the SEV distribution.
Next suppose that we ignore the frailty, but assume that
0
(t) = μt
ν
. This
means that
ln T = ν
−1
(−ln μ − xβ
∗
+ X),
and the variance of ln T is η
2
/ν
2
. Solving for ν gives ν
2
= γ
2
η
2
/(η
2
+ σ
2
). If we
estimate the regression coefficients by least squares, we should have the same estimate
in the two situations: β/γ = β
∗
/ν, which implies that
β
∗
=
β
1 + σ
2
/η
2
.
This shows that what we consider the treatment effect moves toward no effect (β
∗
= 0)
in the presence of frailty. How much depends on the magnitude of heterogeneity.
0.8
0.85
0.9
0.95
Hazard ratio θ
3210
Variance of gamma distribution
Figure 12.7 The relation between a subject-specific hazard ratio θ and the degree of het-
erogeneity in the population, when the population hazard ratio (obtained by a log-rank
test) is 0.91. The assumptions are a gamma frailty and no censored data except for a finite
study length.
336 FROM THE LOG-RANK TEST TO THE COX PROPORTIONAL HAZARDS MODEL
What we measure with the log-rank test (θ
∗
) is not necessarily what matters to the
individual patient, who is probably more interested in θ. That parameter is what determines
the effect on him, although on a relative scale, so it might not be easily translated to enti-
ties such as number of years of added life. But this discussion shows that it is important to
find prognostic variables that can explain as much as possible of the heterogeneity when we
analyze time-to-event data.
12.7 On omitted covariates and stratification in the
log-rank test
In this section we will illustrate the consequences of omitting covariates in the Cox model,
using as background a real-life example. For various reasons, the exact details of the study in
question will not be described, and they are not important for this discussion anyway. Suffice
it to say that it was a placebo-controlled study, where the outcome was survival after start of
treatment; it was a two-armed parallel group study which was randomized 2 : 1 between the
active drug and placebo. The overall log-rank analysis table comparing the two treatments
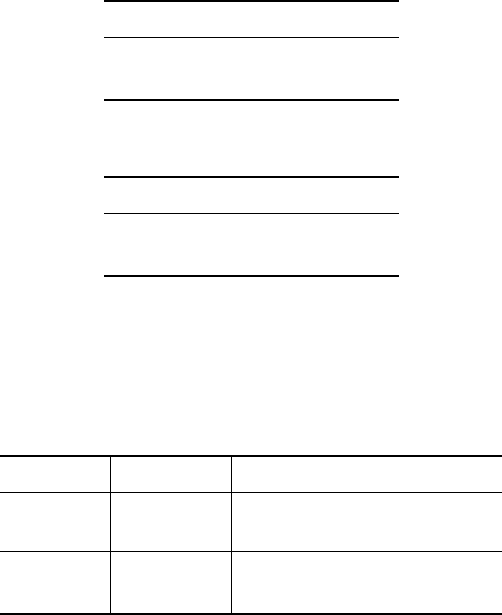
gives us the key outcome data:
N Observed Expected
Active 1129 634 654.4
Placebo
563 342 321.6
The hazard ratio was estimated to be 0.91 with 95% confidence interval (0.80, 1.04) and with
p = 0.16 for the hypothesis of no treatment effect. Although there were fewer deaths than
expected (assuming no treatment effect) in the active group, there is not enough evidence to
claim that the drug has an effect on survival.
However, we cannot rest with this. The effect we are looking for gets attenuated in the
presence of heterogeneity, and we wish to explain as much of the heterogeneity as possible,
in order to home in on the hazard ratio we are interested in. At our disposal we have six
covariates, each of which is dichotomous in nature. The one which on its own is the most
predictive of survival is related to the patient’s performance status according to a WHO scale.
We adjust for this variable in the analysis by carrying out a Cox regression with two factors,
treatment and the WHO scale, both dichotomous. Now the estimated hazard ratio is 0.855
with 95% confidence interval (0.75, 0.98), which gives us p = 0.020 for the hypothesis of
no effect. With this single adjustment we have decreased the hazard ratio so much that we
now have sufficient evidence at the conventional (two-sided) 5% significance level that the
drug has an effect on survival. There is no reason to believe that we have captured all the
heterogeneity, but all we can do with available data is see what the effect is when we include
all the covariates (additively) into a Cox regression model. The result is that the treatment
hazard ratio is estimated as 0.863 with 95% confidence interval (0.76, 0.99) and p = 0.029.
Although most of these individually have an effect on survival, including them all seems not
to explain any more heterogeneity than is explained already by the first covariate.
There is more to say about this. The original model, the log-rank test for the two treat-
ment groups, corresponds to a model in which the placebo group has hazard d(t) and
ON OMITTED COVARIATES AND STRATIFICATION IN THE LOG-RANK TEST 337
the active group has hazard θd(t). The model with the WHO covariate is such that the
hazard is
WHO scale Placebo Active
0or1 d(t) θd(t)
2or3 rd(t) rθd(t)
where r is the proportionality factor for the covariate. This is a stronger assumption than
assuming that each WHO scale subgroup has its own hazard, which is the table
WHO scale Placebo Active
0or1 d
0
(t) θd
0
(t)
2or3 d
1
(t) θd
1
(t)
The first model corresponds to the assumption d
1
(t) = rd
0
(t). The second model can be
analyzed by a stratified log-rank test, in which we compute the estimating function for each
stratum (i.e., subgroup defined by the WHO scale variable) and from which an estimating
equation for θ is obtained by equating a weighted average of these to zero. The convention
here is to take equal weights for the strata, and the result of this analysis is summarized in the
following table:
WHO scale Treatment N Observed Expected
0or1
Active 387 283 299.3
Placebo 174 135 118.7
2or3
Active 739 351 365.5
Placebo 389 207 192.5
The corresponding hazard estimate is 0.867 with 95% confidence interval (0.76, 0.99)
and p = 0.034. We see that the result is very similar to the Cox regression result presented
above. However, if we instead stratify on all six covariates the results of the two methods
differ more, and in a crucial way: the treatment hazard ratio is estimated to be 0.89 with 95%
confidence interval (0.77, 1.02) and p = 0.087. Numerically the difference is not large, but
the p-value moves over to the other side of the conventional cut-off limit of 5%. It therefore
becomes important to understand whether the first analysis was based on faulty assumptions,
or whether the explanation for the discrepancy is to be found elsewhere. In exploring this we
will highlight an important risk with a stratified analysis.
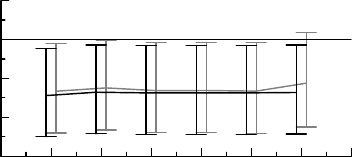
Figure 12.8 shows the estimates and confidence intervals for the two models (Cox regres-
sion in black, stratified test in gray) at different degrees of stratification, in such a way that
we start with the WHO scale variable as a single covariate, and then add one new covariate at
each step according to how predictive they are for survival on their own. Not much happens,
with one important exception, which is when we add the last covariate to the stratified test
(a covariate that is not even shown to be predictive on its own). In this test we have stratified
on six dichotomous variables, which means that we divide the population into 2
6
= 64 cells.
Four of these are empty, and 23% of the remaining cells have at most 3 patients. In such small
338 FROM THE LOG-RANK TEST TO THE COX PROPORTIONAL HAZARDS MODEL
0.7
0.8
0.9
1
1.1
Hazard ratio
76543210
No of covariates added
Figure 12.8 Illustration of how confidence intervals for hazard ratio change as we increase
the number of variables to stratify on. The gray data are for the stratified test, the black data
for the (additive) Cox regression model.
cells it is not unlikely that only one treatment will be represented, a risk that is augmented
by the fact that we had a 2 : 1 randomization. In fact, 11 cells have only one treatment and
of these, 9 contain only active drug. These cells do not contribute to the stratified test, which
means that we effectively loose 27 patients on active drug and 2 on placebo in the analysis.
Among these there are in total 14 deaths (one on placebo) that no longer contribute to the
analysis. This is a loss of power and explains much of the effect we see when we add the sixth
covariate to the analysis. It means that drawing conclusions from this test is not a sensible
thing to do, however prespecified the analysis may have been.
The lesson is simple. Do not over-stratify! You must make certain that no cells are too
small. This is of course true for all stratified tests. The idea behind stratification is this: we
have a heterogeneous population, and in order to apply a test which assumes a homogeneous
population we divide the population up into strata, such that within each stratum the population
is homogeneous. Thereafter we pool the strata. However, the quest for homogeneity strives
toward small strata, and in a small stratum there is a severe risk that the treatment groups
are unbalanced. Unbalanced comparisons are less effective than balanced ones, so we loose
power as the number of strata increases. On the other hand, if we take fewer strata, these
may be heterogeneous with treatment bias as a result. Note that if we stratify when we do
not need to, when our population is actually homogeneous, we may have a substantial loss
of power, at least if some cells become small. In all, this makes the application of stratified
tests problematic if one is forced, as is often the case in the pharmaceutical industry, to
prespecify in detail the analysis to be performed, in order to gain credibility (in the eyes of the
regulatory agencies).
12.8 Comments and further reading
The rat data we have used in this chapter to illustrate different methods was originally given
in Mantel et al. (1977,Table 1), and is reproduced in Hougaard (2000,Table 1.5). The original
paper is of independent interest, because it illustrates how the log-rank test is related to the
Mantel–Haenszel technique in a very explicit way.
Much of the material in this chapter is covered in major books on the statistical analysis
of survival data, some of which were referenced in the last chapter. An overview of how
traditional non-parametric tests are expressed and analyzed in a counting process theory
REFERENCES 339
context is given by Gill (1983). The accelerated hazards model is less used, but is discussed
by Chen and Wang (2000). Gray’s analysis in a competitive environment is discussed in
Gray (1988).
The power calculation in Box 12.2 is based on the validity of the proportional hazards
model. In the design stage we assume a certain (subject-specific) hazard ratio, but when we do
the analysis, in order to achieve this assumption, we may need to include a series of predictive
variables in the analysis model (Schoenfeld, 1983). In other words, we use the formula for
the log-rank test when we compute the number of patients needed, and also if we plan
for a more extensive Cox regression model. If we apply the log-rank test and ignore
the predictors, the loss of power comes from the fact that the treatment effect is time-
dependent and we estimate a parameter which corresponds to a smaller effect than
the true one.
The original article by David R. Cox (1972) on the proportional hazards model has had a
huge number of citations and its author has received a large number of honors. Our derivation
of his model is not the traditional one and is deliberately sketchy; missing details may be
found in papers by Sasieni (1993) and Tsiatis (1981). The value of this derivation is that
it emphasizes the underlying connection between the model and the problem of explaining
heterogeneity. It emphasizes that on an individual level we may well have proportional hazards,
even when it does not appear so from the overall population (Kaplan–Meier) perspective. The
traditional derivation can be found in most books on survival analysis, many of which contain
numerous applications. There are different ways to extend the Cox model (Therneau and
Grambsch, 2000) to situations where its basic assumptions are not fulfilled, some of which
will be touched upon in the next chapter.
The heuristic idea for the bias (if that is the proper word) in the presence of frailty, or
omitted covariates, in the Cox model, described in Box 12.4, is essentially taken from Keiding
et al. (1997). A fuller discussion of this bias is given by Henderson and Oman (1999). The
amount of bias depends on the frailty distribution, and is actually more pronounced with
complete data than if there are censored data. Another discussion about the balancing act
between stratification with small cells versus the problem of heterogeneity can be found in
Akazawa et al. (1997) with a related discussion in Stavola and Cox (2008) for a Poisson
process setting.
References
Akazawa, K., Nakamura, T. and Palesch, Y. (1997) Power of logrank test and Cox regression model in
clinical trials with heterogeneous samples. Statistics in Medicine, 16, 583–597.
Chen, Y.Q. and Wang, M.C. (2000) Analysis of accelerated hazards models. Journal of the American
Statistical Association, 95(450), 608–618.
Cox, D.R. (1972) Regression models and life-tables (with discussion). Journal of the Royal Statistical
Society, Series B, 34, 187–220.
Gill, R.D. (1983) Censoring and Stochastic Integrals vol. Mathematical Centre Tracts 124. Amsterdam:
Mathematisch Centrum.
Gray, R.J. (1988) A class of K-sample tests for comparing the cumulative incidence of competing risks.
Annals of Statistics, 16, 1141–1154.
Henderson, R. and Oman, P. (1999) Effect of frailty on marginal regression estimates in survival analysis.
Journal of the Royal Statistical Society, Series B, 61(2), 367–379.
340 FROM THE LOG-RANK TEST TO THE COX PROPORTIONAL HAZARDS MODEL
Hougaard, P. (2000) Analysis of Multivariate Survival Data Statistics for Biology and Health. New
York: Springer.
Keiding, N., Andersen, P.K. and Klein, J.P. (1997) The role of frailty models and accelerated failure time
models in describing heterogeneity due to omitted covariates. Statistics in Medicine, 16, 215–224.
Mantel, N., Bohidar, N. and Ciminera, J. (1977) Mantel-Haenszel analyses of litter-matched time-
to-response data, with modifications for recovery of interlitter information. Cancer Research, 37,
3863–3868.
Sasieni, P. (1993) Some new estimators for Cox regression. Annals of Statistics, 21(4), 1721–1759.
Schoenfeld, D.A. (1983) Sample-size formula for the proportional-hazards regression model. Biomet-
rics, 39, 499–503.
Stavola, B.L.D. and Cox, D.R. (2008) On the consequence of overstratification. Biometrika, 95(4),
992–996.
Sun, J. (2006) The Statistical Analysis of Interval-Censored Failure Time Data Statistics for Biology
and Health. New York: Springer.
Therneau, T.M. and Grambsch, P.M. (2000) Modeling Survival Data: Extending the Cox Model Statistics
for Biology and Health. New York: Springer.
Tsiatis, A.A. (1981) A large sample study of Cox’s regression model. Annals of Statistics, 9(1), 93–108.

APPENDIX: COMMENTS ON INTERVAL-CENSORED DATA 341
12.A Appendix: Comments on interval-censored data
With interval-censored data there are some adjustments that need to be made to the way we
compute things. The Kaplan–Meier e-CDF can be computed only when we know the situation
at each time point, so we need to find another way to obtain an e-CDF. Suppose, then, that
we have n patients, for each of whom we have an interval (l
i
,r
i
], such that the event has
occurred somewhere within that interval. By going to the limit r
i
− l
i
→ 0 we can include
exact observations, and by taking r
i
=+∞we can also include right-censored events. For
this discussion we assume that all intervals are proper, finite intervals. Let t
1
<t
2
<...<t
m
denote the unique elements from the list of left and right interval limits.
An e-CDF F
n
(t) will be a step function with jumps at the t
j
of magnitude
j
= F
n
(t
j
) −
F
n
(t
j−1
). To determine
j
, let I
i
j
be the indicator variable which is one if the censor interval
for subject i contains the point t
j
(i.e., if (t
j−1
,t
j
] ⊂ (l
i
,r
i
]), otherwise zero. The contribution
of subject i to the e-CDF at point t
j
∈ (l
i
,r
i
] is then given by
j
/(F (r
i
) − F (l
i
). But the
average over all individuals at that point is the actual jump size, so we have the relation
j
=
1
n
n
i=1
I
i
j
j
k
I
i
k
k
.
This defines the jump sizes and therefore what is called the Turnbull e-CDF for interval-
censored data. We may note that
j
can only be non-zero if t
j−1
is a left end point of the
original data and t
j
a right end point, but not necessarily from the same censored interval.
(The intervals (t
j−1
,t
j
] are called Turnbull intervals, and identifying them first is helpful for
computational reasons.)
Given the Turnbull e-CDF
mn
(t), we can define the log-rank test for interval-censored
data as follows. Instead of observed event times, use predicted event times, so that
N
+
(t) =
n+m
i=1
I
i
(t)
mn
(t)
k
I
i
(t
k
)
mn
(t
k
)
,
where I
i
(t) is an indicator for the interval (l
i
,r
i
]. We can also define the predicted number at
risk by
Y
+
(t) = n
t
k
≥t
mn
(t
k
).
Together with similar estimates for one group alone we derive a log-rank test, or Wilcoxon test,
for interval-censored data that is analogous to what they are for right-censored data, except
that we use these predicted entities instead of observed ones. The extension to parameter
estimation is immediate.
We can alternatively construct a generalized log-rank test for interval-censored data
based on the expression 1 +
∞
0
ln(
c
(t))dF (t), which underlies the log-rank test. It is
estimated by
1 +
1
n
i
ln
c
mn
(t
i
) =
1
n
i
(1 + ln
c
mn
(t
i
)).

342 FROM THE LOG-RANK TEST TO THE COX PROPORTIONAL HAZARDS MODEL
A primitive function of 1 + ln x is x ln x, which means that a generalization from complete
data to interval-censored data can be done by using
1
n
i
c
mn
(l
i
)ln(
c
mn
(l
i
)) −
c
mn
(r
i
)ln(
c
mn
(r
i
))
c
mn
(l
i
) −
c
mn
(r
i
)
.
In the limit this reduces to the previous expression. For the details necessary for practical
implementation of this, see Sun (2006), for example.