Kosevich A.M. The crystal lattice
Подождите немного. Документ загружается.

158
5 Acoustics of Elastic Superlattices: Phonon Crystals
The periodic function U(x) should be expanded in the following Fourier series
U(x)=
∑
m
U
m
e
2πmx/d
, (5.2.7)
where
U
m
=
1
L
U(x)e
−2πimx/d
dx =
1
d
d
0
U(ξ)e
−2πimξ/d
dξ, (5.2.8)
and U
0
= 0 as it follows from (5.2.2). The lowest degenerated frequency corresponds
to the wave vectors k = ±π/d. We seek a solution to (5.2.6) in the form of a linear
combination
u =(u
0
+
e
iπmx/d
+ u
0
−
e
−iπmx /d
)e
iqx
, (5.2.9)
with a frequency ω slightly differing from sπ/d at small q (further q π/d).
We substitute (5.2.9) into (5.2 .6), multiply in turn by exp −i(π/d + q)x and
exp −i(π/d −q)x and perform the integration with respect to x. Then we ob-
tain in the main approximation the following set of equations for coefficients u
0
+
and
u
0
−
:
ω
2
−
πs
d
2
−
2πs
2
d
q
u
0
+
+
π
d
2
U
1
u
0
−
= 0,
ω
2
−
πs
d
2
+
2πs
2
d
q
u
0
−
+
π
d
2
U
∗
1
u
0
+
= 0.
(5.2.10)
The condition of solvability of set (5.2.10) gives a dispersion relation removing the
degeneration at the boundaries of the Brillouin zone:
ω
2
=
π
d
2
s
2
±
s
4
2qd
π
2
+ |U
1
|
2
1/2
. (5.2.11)
A gap is opening at the Brillouin zone (q = 0):
δω =
π |U
1
|
cd
, (5.2.12)
where (d
1
< d)
|U
1
=
1
πd
δs
2
1
− δs
2
2
|sin
πd
1
d
≈
2s
πd
|s
1
−s
2
|sin
πd
1
d
. (5.2.13)
The forbidden gap appears only at different sound velocities in two neighboring layers.
The higher gaps at the degeneration point can be calculated analogously if one takes
pairs of waves with a difference of the wave vectors k −k
= 2π( n −n
),wheren and
5.3 Dispersion Relation for a Simple Superlattice Model
159
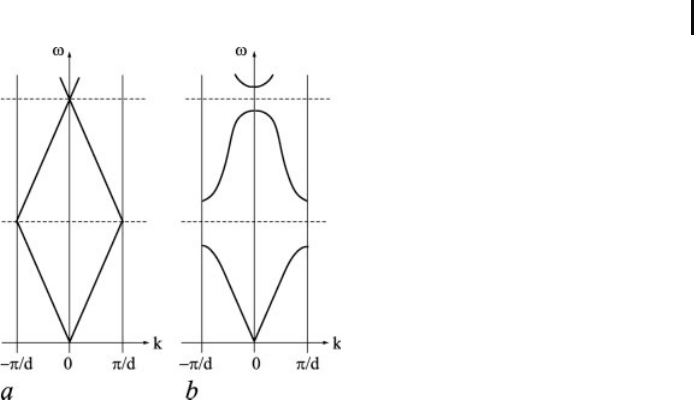
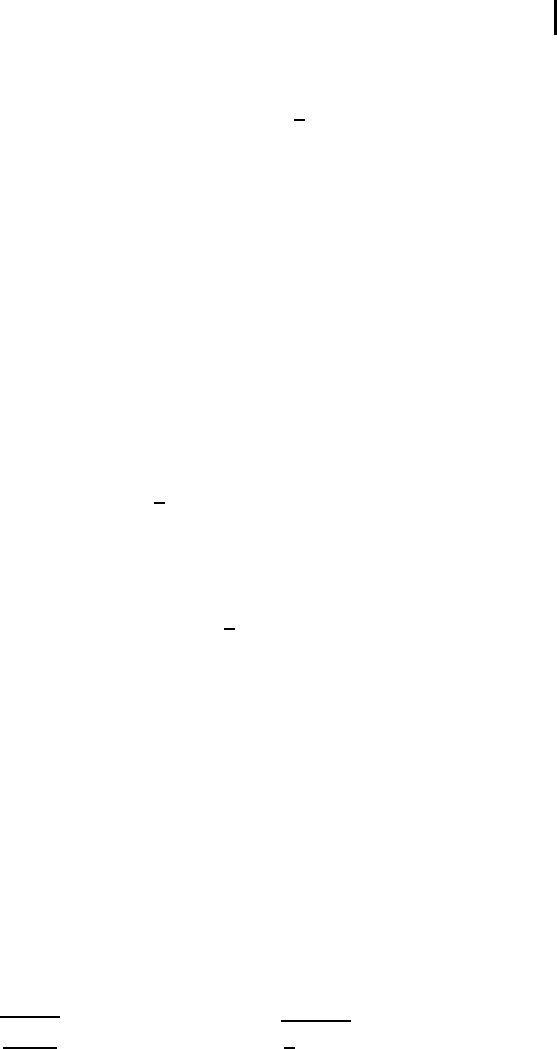
Fig. 5.3 Dispersion curves inside one Brillouin zone: (
a
)inthezero
approximation (without gaps), (
b
) deformation of curves by small pertur-
bations.
n
are integers. A set of allowed bands and gaps appears in a SL. Two lowest bands
of frequencies allowed are schematically shown in Fig. 5.3b. A frequency spectrum
of the SL differs essentially both from the usual sound spectrum ω = sk,wheres is
the sound velocity and from the vibration spectrum of a crystal lattice. The number of
vibration branches in the crystal is determined by the number of atoms in the crystal
unit cell, but in a SL a number of vibration branches appears. The total number of
vibration branches in a SL is limited only to the value d/a, that is to the number of
atoms in one period of the SL (inside one unit cell of the SL).
5.3
Dispersion Relation for a Simple Superlattice Model
We return to (5.2.1) and note that each of the eigensolutions to (5.2.1) in a periodic
structure with a perio d d is characterized by the quasi-wave number k. Natural oscil-
lations of the field in the unit cell with the number n can be written in the form
u
n
(x)=u
0
(x)e
iknd
, u
0
(x + d)=u
0
(x). (5.3.1)
We write down solutions to the pair of equations (5.2.1) in the interval of one unit cell
with the number n (nd < x < (n + 1)d)
u
n
(x)=a
(n)
1
e
ik
1
ξ
+ a
(n)
2
e
−ik
1
ξ
,0< ξ < d
1
;
u
n
(x)=b
(n)
1
e
ik
2
ξ
+ b
(n)
2
e
−ik
2
ξ
, d
1
< ξ < d,
(5.3.2)

160
5 Acoustics of Elastic Superlattices: Phonon Crystals
where ξ = x − nd and k
1
= ω/s
1
, k
2
= ω/s
2
,andω is the frequency. Amplitudes
in the neighboring cells are connected by the conditions
a
(n+1)
= a
(n)
e
ikd
, b
(n+1)
= b
(n)
e
ikd
. (5.3.3)
Boundary conditions at the points ξ = 0 and ξ = d lead to the set of four ho-
mogeneous algebraic equations for the amplitudes a
1
, a
2
, b
1
,andb
2
. Equality of the
determinant of this set to zero gives the following dispersion relation (Rytov, 1955)
cos kd = cos k
1
d
1
cos k
2
d
2
−
1
2
k
1
k
2
+
k
2
k
1
sin k
1
d
1
sin k
2
d
2
. (5.3.4)
A derivation of (5.3.4) using (5.3.2) and (5.3.3) can be considered as a problem exer-
cise for this section.
Equation (5.3.4) determines in a complicated form the dependence of the frequency
ω on the wave number k : ω(k). This relation coincides with an accuracy to notation
with that obtained by Kronig and Penney for a quantum particle in a one-dimensional
periodic potential (Kronig and Penney, 1930).
Expression (5.3.4) gives the implicit dependence of the frequency o n the quasi-
wave number and allows us to describe readily the spectrum of long-wave vibrations
(kd 1), for which the sound spectrum is naturally obtained with average elastic
modulus µ and the density ρ: ρd = ρ
1
d
1
+ ρ
2
d
2
and d/µ = d
1
/µ
1
+ d
2/µ
2
.
Based on such a rep resentation of µ, which contains only ratios d
α
/µ
α
, it is interesting
to consider a limiting case, which can demonstrate the most characteristic properties
of the superlattice spectrum, when d
2
→ 0 and µ
2
→ 0 for d
2
/µ
2
= M = const. In
this case, d
1
→ d, k
2
d
2
= ωd
2
/s
2
=
ρ
2
d
2
ω
d
2
/µ
2
→ 0. Then the dispersion
relation for the system is described by the e quation
cos kd = cos z − Qz sin z, (5.3.5)
where z = q
1
d = ωd/s
1
and Q = ρ
2
µ
1
M/(2ρ
1d
). Note that (5.3.5) gives the
dispersion relation for an elastic SL consisting of periodic elastic blocks of length d
with the parameters µ
1
and s
1
under special boundary conditions. If the parameter Q
is small, then the system under study represents a periodic sequence of elastic regions
that are weakly connected with each other.
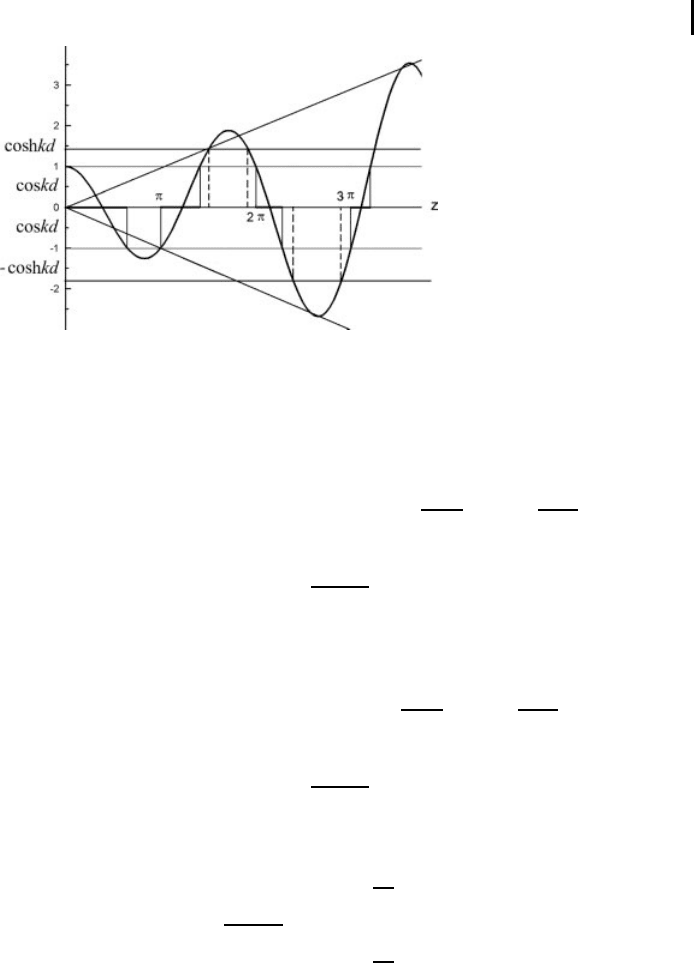
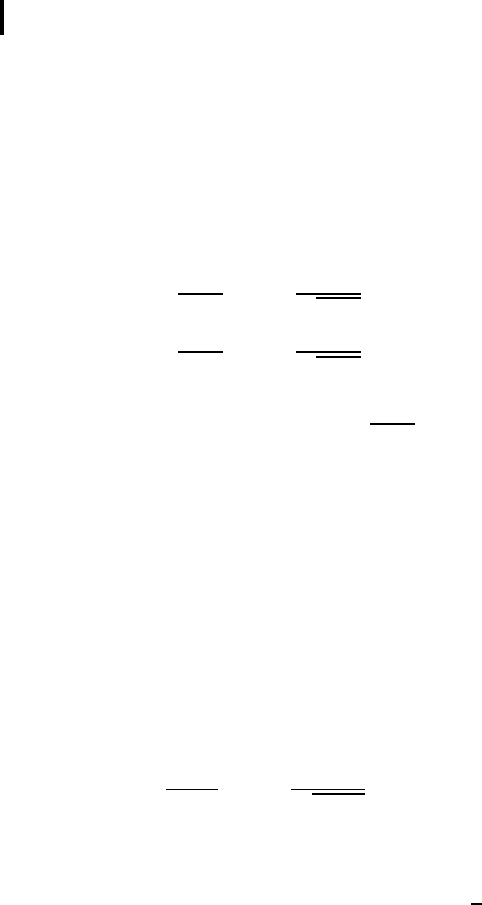
The allowed vibrational frequencies of a continuous spectrum of the system under
consideration can be qualitatively found by analyzing graphically (5.3.5), as shown in
Fig. 5.4. For the beginning we repeat our analysis concerning Fig. 1.15 in Chapter 1.
If the r.h.p. of (5.3.5) runs the values between ±1, the roots of the equation have the
values in the intervals shown on the abscissa.
Note that, as z increases, th e allowed frequencies are localized within the narrowing
intervals near the values k
1
d = ±mπ,wherem is a large integer. For the condition
m
2
Q 1, the dispersion relation for the m-th band can be readily found.
5.3 Dispersion Relation for a Simple Superlattice Model
161
Fig. 5.4 Graphical solution of (5.3.5) in the cases cosh kd > 1.
Indeed, near odd m = 2p + 1 (see the vicinity of z = 3π) in Fig. 5.4 , we can write
with sufficient accuracy (s = s
1
)
cos kd = −1 + Qmπ(z − mπ)= − 1 +
mπd
s
Q
ω −
mπs
d
,
which yields
ω = mω
0
+
s
mπQd
(1 + cos kd), (5.3.6)
where ω
0
= πs/d. Similarly, near even m = 2p (see the vicinity of z = 4π)in
Fig. 5.4, we can write
cos kd = 1 − Qmπ(z − mπ)=1 −
mπd
s
Q
ω −
mπs
d
,
which gives
ω = mω
0
+
s
mπQd
(1 − cos kd). (5.3.7)
By combining (5.3.6) and (5.3.7), we can obtain the dispersion relations for the m-th
band:
ω = mω
0
+
2s
mπQd
sin
2
kd
2
, m = 2p;
cos
2
kd
2
, m = 2p + 1.
(5.3.8)
One can easily see that expressions (5.3.8) rep r esent the size-quantization spectrum
of phonons in a layer of thickness d, whose levels split into minibands due to a low
“transparency” of the interface between layers, that is due to a weak interaction be-
tween adjacent blocks.
The frequency spectrum that we obtained is of interest because its high-frequency
part has a set of narrowing allowed frequency bands in which the dispersion relation

162
5 Acoustics of Elastic Superlattices: Phonon Crystals
can be calculated analytically with good accuracy. The spectrum has a number of
forbidden bands (gaps in a continuous spectrum).
Consider now the possibility of appearance of vibrational states in forbidden bands.
Such vibrations correspond to solutions of the type
u
n
∝ exp(∓κnd) for k = iκ,
or
u
n
∝ (−1)
n
exp(∓κnd) for k = i κ + π,
exponentially decreasing (increasing) with the number n. It is obvious that such states
can have a physical meaning only on the coordinate semi-axis under the condition that
a solution vanishing at infinity is chosen, which reflect some boundary conditions at
the coordinate origin.
For the solution of the first type (k = iκ), the frequency dependence of the parame-
ter κ can be found from the relation
cosh(κd)=cos z − Qz sin z > 1, (5.3.9)
while, for the solution of the second type ( k = iκ +π ), it can be found from the
relation
−cosh(κd)=cos z − Qz sin z > 1 < −1. (5.3.10)
The solutions of the first type correspond to frequencies in the intervals (2p −1)π <
z < 2pπ, and those of the second type, in intervals 2pπ < z < (2p + 1)π (see
Fig. 5.4). Note that such situations appear on the semi-axis, for example, at the ends
of the SL.
5.3.1
Problem
Show that (5.3.5 ) describes the dispersio n relation f or an elastic SL consisting of pe-
riodic blocks of length d under the following boundary conditions on the interfaces:
the normal stresses are continuous ([σ]
+
−
= 0,i.e.,[∂u/∂x]
+
−
= 0), while elastic
displacements exhibit the jump [u]
+
−
= Q(ρ
1
/ρ
2
)σ.
Part 3 Quantum Mechanics of Crystals
The Crystal Lattice: Phonons, Solitons, Dislocations, Superlattices, Second Edition. Arnold M. Kosevich
Copyright
c
2005 WILEY-VCH Verlag GmbH & Co. KGaA, Weinheim
ISBN: 3-527-40508-9

6
Quantization of Crystal Vibrations
6.1
Occupation-Number Representation
To describe crystal vibrations one uses the classical equations of motion of atoms (or
molecules) position ed at the lattice sites. A classical description of crystal vibrations
is only a rough approximation, and from the beginning one should proceed from quan-
tum laws. Small-amplitude vibrations of an ideal crystal, however, represent the rare
case of a physical system where a quasi-classical treatment leads to the same results
as those obtained in a rigorous quantum-mechanical approach. In this approximation
the system of quantized vibration in the crystal is assumed to be equivalent to a system
of independent harmonic oscillators. The classification of states and the calculation of
the energy spectrum of a harmonic oscillator at a quasi-classical level are known to be
accurate quantum mechanically.
Thus, for the majority of crystals the vibrations can be quantized at a late stage in
the calculations when the vibration dispersion law is found, the vibration field is rep-
resented as a set of harmonic oscillators an d the harmonic oscillator frequencies are
determined. In particular, for the initial stage of quantization one may take the Hamil-
ton function (2.11.14) written in terms of the real canonically conjugated generalizes
coordinates X(k) and momenta Y(k) . Since the quantum treatment is not dependent
on the vector character of the displacements and the momenta corresponding to them,
we begin by using a scalar model based on the Hamilton function
H =
∑
k
H(k), H(k)=
1
2
Y
2
k
+ ω
2
(k)X
2
k
. (6.1.1)
In quantum mechanics the Hamilton function is regarded as an operator (Hamilton-
ian) whose dynamic variables X(k) and Y(k) in (6.1.1) are replaced by the operators
The Crystal Lattice: Phonons, Solitons, Dislocations, Superlattices, Second Edition. Arnold M. Kosevich
Copyright
c
2005 WILEY-VCH Verlag GmbH & Co. KGaA, Weinheim
ISBN: 3-527-40508-9
166
6 Quantization of Crystal Vibrations
with commutative relations
[X(k), Y(k
)] = i¯hδ
kk
;
[X(k), X(k
)] = [Y( k), Y(k
)] = 0,
(6.1.2)
where [A, B]=AB − BA. We do not use special notation for the operators of phys-
ical quantities, but have to allow for the noncommutativity of these quantities in all
calculations.
The simplest and most widely used way of obtaining the quantum spectrum of a
multiparticle system is by writing and diagonalizing its Hamiltonian in the occupation
number representation. Since the Hamiltonian (6.1.1) is already diagonalized in the
k-states, the choice of new operators can be performed by following linear transfor-
mations for a given value of k:
X(k)=u(k )a
k
+ u
∗
(k)a
†
k
; Y(k)=v(k)a
k
+ v
∗
(k)a
†
k
. (6.1.3)
The operators a
k
and a
†
k
are the Hermitian conjugated operators, u(k) and v(k)
are complex functions of the vector k whose choice should satisfy the requirements
(6.1.2) and reduce the Hamiltonian H(k) to a product of operators a
k
and a
†
k
.
We transform an individual term in the Hamiltonian (6.1.1)
Y
2
(k)+ω
2
(k)X
2
(k)=(|v|
2
+ ω
2
|u|
2
)(a
k
a
†
k
+ a
†
k
a
k
)
+(v
2
+ ω
2
u
2
)a
k
a
k
+[(v
∗
)
2
+ ω
2
(u
∗
)
2
]a
†
k
a
†
k
,
(6.1.4)
and the first of the conditions (6.1.2)
[X(k), Y(k
)] = u(k)v
∗
(k
)[a
k
a
†
k
+ u
∗
(k)v(k
)[a
†
k
a
k
]
+u (k)v(k
)[a
k
, a
k
]+u
∗
(k)v
∗
(k
)[a
†
k
, a
†
k
]=i¯hδ
kk
.
(6.1.5)
Analyzing (6.1.4), it is easy to come to a conclusion that if we choose the functions
u(k) and v(k) as
u(k)=
¯h
2 |ω( k)|
, v(k)=−i |ω(k)| u(k), (6.1.6)
the Hamiltonian of vibrations (6.1.1) will reduce to
H =
1
2
∑
k
¯h |ω(k) | (a
†
k
a
k
+ a
k
a
†
k
). (6.1.7)
According to (6.1.5), the conditions (6.1.2) will then also be satisfied, if the opera-
tors a
k
and a
†
k
obey the following commutation rules
[a
k
, a
†
k
]=δ
kk
, [a
k
, a
k
]=[a
†
k
, a
†
k
]=0.
(6.1.8)
6.1 Occupation-Number Representation
167
Using the first rule from (6.1.8) we simplify the Hamiltonian (6.1.7)
H =
∑
k
¯h|ω(k )|
a
†
k
a
k
+
1
2
. (6.1.9)
Since the Hamiltonian (6.1.9) involves only the absolute frequency value, we can
consider further only positive vibration frequencies.
Using the operators a
k
and a
†
k
is the most efficient way in the representation, where
the operator a
†
k
a
k
included in the Hamiltonian is diagonal. It turns out that if a
k
and
a
†
k
satisfy the relations (6.1.8), the eigenvalues of the o perator a
†
k
a
k
are non-negative
integer numbers of a natural series
a
†
k
a
k
= N
k
, N
k
= 0, 1, 2, . . . . (6.1.10)
This property of the operator a
†
k
a
k
is proved in quantum mechanics, however, in our
case it follows directly from (6.1.9). Indeed, the energy levels of a harmonic oscillator
with frequency ω are known
E
n
=
n +
1
2
¯hω, n = 0, 1, 2, . . . , (6.1.11)
thus, the eigenvalues of the Hamiltonian (6.1.1) being the sum of the energies of inde-
pendent harmonic oscillators can be represented as
E =
∑
k
N
k
+
1
2
¯hω(k), (6.1.12)
where N
k
are non-negative integers. Comparing the expressions (6.1.12) and (6.1.9)
we are convinced of the validity of (6.1.10).
The numbers N
k
are called the occupation numbers of the states k. When the
systems consisting of many identical particles are studied from the point of view of
quantum mechanics, it is convenient to use a mathematical method where in the oc-
cupation number representation various vibrational crystal states are characterized by
different sets of numbers N
k
, and the action of the operators a
k
and a
†
k
changes these
numbers.
In applications it is impor tant to know not only how the Hamiltonian is written in
terms of the operators a
k
and a
†
k
, but also the form of the displacement operator, which
is always initial.
We note that the linear transformation (6.1.3) taking into account (6.1.6) is written
in the form
X(k)=
¯h
2ω(k)
(a
†
k
+ a
k
), Y(k)=i
1
2
¯hω(k)(a
†
k
− a
k
). (6.1.13)
Thus, the sum of the operators a
†
k
and a
k
is the coordinate, and their difference is
the momentum of the corresponding harmonic oscillator.
168
6 Quantization of Crystal Vibrations
Using now the chain of transformations (6.1.13) and (2.11.15) to find a complex
expression for the operators of normal coordinates, we obtain
Q(k)=u
k
(a
k
− a
†
−k
), Q
†
(k)=u
k
(a
†
k
+ a
−k
), (6.1.14)
where the multiplier u
k
is determined in (6.1.6). Generally, the complex conjugate
normal coordinate Q
∗
(k) corresponds to a Hermitian conjugate operator Q
†
(k) .
Using (6.1.14) and (1.6.3), we obtain the atomic displacement operator
u(n)=
¯h
2mN
1/2
∑
k
1
ω(k)
a
k
e
ikr (n)
+ a
†
k
e
−ikr (n)
=
¯h
2mN
1/2
∑
k
1
ω(k)
(a
k
+ a
†
−k
)e
ikr (n)
.
(6.1.15)
We note that in replacing the displacements with the operators by (6.1.15) the de-
nominator always includes the multip lier
ω(k) that accompanies the operators a
k
or a
†
k
.
For a real crystal lattice when the operators a
α
(k) and a
†
α
(k) belonging to different
branches of the dispersion law (α = 1, 2, . . . , 3q) are introduced , the commutation
relations (6.1.8) are generalized to
a
α
(k) , a
†
α
(k
)
= δ
αα
δ
kk
,
[a
α
(k) , a
α
(k
)] =
a
†
α
(k) , a
†
α
(k
)
= 0.
The displacement operator of the (n, s)-th atom is associated with the operators
a
α
(k) and a
†
α
(k) by relations
u
s
(n)=
¯h
2m
s
N
1/2
∑
kα
e
s
(k, α)
ω
α
(k)
[a
α
(k)+a
†
α
(−k)]e
ikr (n)
. (6.1.16)
Finally, the Hamiltonian of crystal vibrations in a harmonic approximation is re-
duced to
H =
∑
αk
¯hω
α
(k)
a
†
α
(k)a
α
(k)+
1
2
, (6.1.17)
generalizing (6.1.9).
It is clear that the operators of the physical quantities can be expressed directly
through the operators a
k
and a
†
k
. We discuss their properties based on the Heisenberg
representation when the dynamic processes are described by the time dependence of
the operators of physical quantities whose equations of motion are analogous to clas-
sical Hamilton equations.
We omit the index α, i. e., return to a scalar mo del. From the Hamiltonian (6.1.9)
there follows a very simple “equations of motion” for the operator a
k
and a
†
k
. Indeed,