Mann U. Principles of Chemical Reactor Analysis and Design: New Tools for Industrial Chemical Reactor Operations
Подождите немного. Документ загружается.

at t ¼ 1.16, Z
1
¼ 0.6865, Z
2
¼ 0.5293. Using (e), the required operating
time is
t ¼ t
cr
t ¼ 29 min
The amount of product B produced is 135 mol.
b. For isothermal operations, du/dt ¼ 0, and using Eq. 6.1.20, the instan-
taneous dimensionless heat-transfer rate is
d
dt
Q
(N
tot
)
0
^
c
p
0
T
0
¼ DHR
1
dZ
1
dt
þ DHR
2
dZ
2
dt
(o)
Integrating (o) from 0 to t,
Q(t) ¼ [(N
tot
)
0
^
c
p
0
T
0
][DHR
1
Z
1
(t) þ DHR
2
Z
2
(t)] ¼ 13:7 10
3
kcal
The positive value indicates that heat is added to the reactor.
c. Using Eq. 6.1.24, the HTN for isothermal operation (u ¼ 1) is
HTN
iso
(t) ¼
1
u
F
1
DHR
1
dZ
1
dt
þ DHR
2
dZ
2
dt
(p)
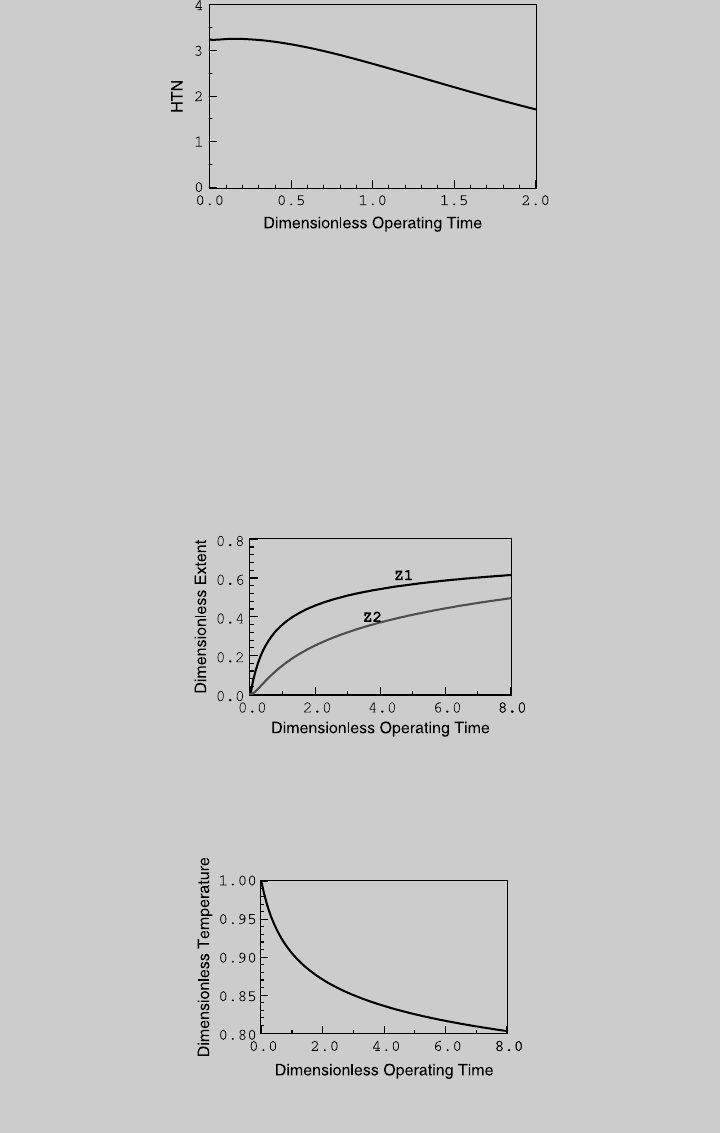
Figure E6.12.3 shows the HTN curve during the operation. Using Eq. 6.1.25,
for t
op
¼ 1.16, the value of HTN
ave
is 2.87.
d. For adiabatic operation, HTN ¼ 0, and (h) reduces to
du
dt
¼
1
CF(Z, u)
DHR
1
dZ
1
dt
DHR
2
dZ
2
dt
(q)
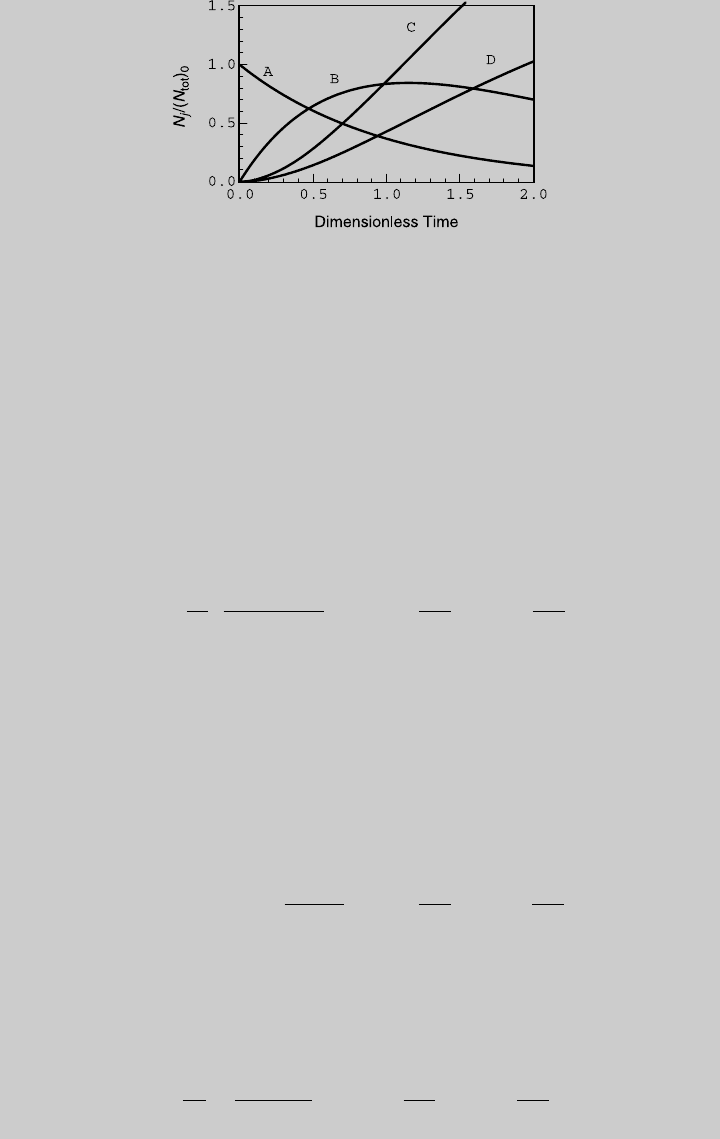
Figure E6.12.2 Species operating curves—isothermal operation.
220 IDEAL BATCH REACTOR
W e solve (f), (g), and (q) simultaneously, subject to the initial condition tha t
t ¼ 0, Z
1
(0) ¼ Z
2
(0) ¼ 0, and u ¼ 1. Figure E6.12.4 shows the reaction
curves, and Figure E6.12.5 shows the temperature curve. We then use (i)
through (l) to determine the species curves, sho wn in Figur e E6.12.6. From
the curve of product B, the highest N
B
/(N
tot
)
0
is 0.7224 and is reached at
Figure E6.12.3 Instantaneous isothermal HTN curve.
Figure E6.12.4 Reaction operating curves—adiabatic operation.
Figure E6.12.5 Temperature curve—adiabatic operation.
6.4 NONISOTHERMAL OPERATIONS 221
t ¼ 4.64, Z
1
¼ 0.5597, Z
2
¼ 0.3971, and u ¼ 0.8285. Using (e), the required
operating time is
t ¼ t
cr
t ¼ 1:116 min
The amount of pr o duct B produces is 115.5 mol.
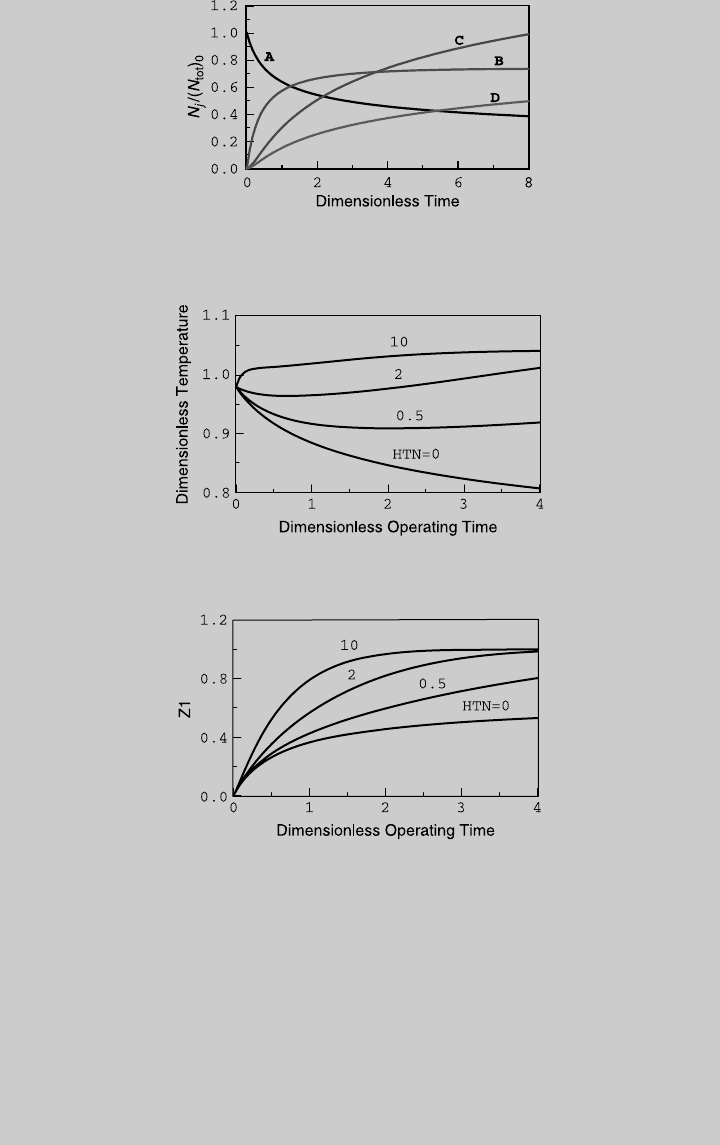
e. To examine the effect of HTN on the reactor operation, we solve (f), (g), and
(h) for different values of HTN. Figure E6.12.7 shows the effect on the reac-
tor temperature, Figure E6.12.8 shows the effect on the progress of Reaction
Figure E6.12.6 Species curves—adiabatic operation.
Figure E6.12.7 Effect of HTN on the reactor temperature.
Figure E6.12.8 Effect of HTN on Reaction 1.
222 IDEAL BATCH REACTOR
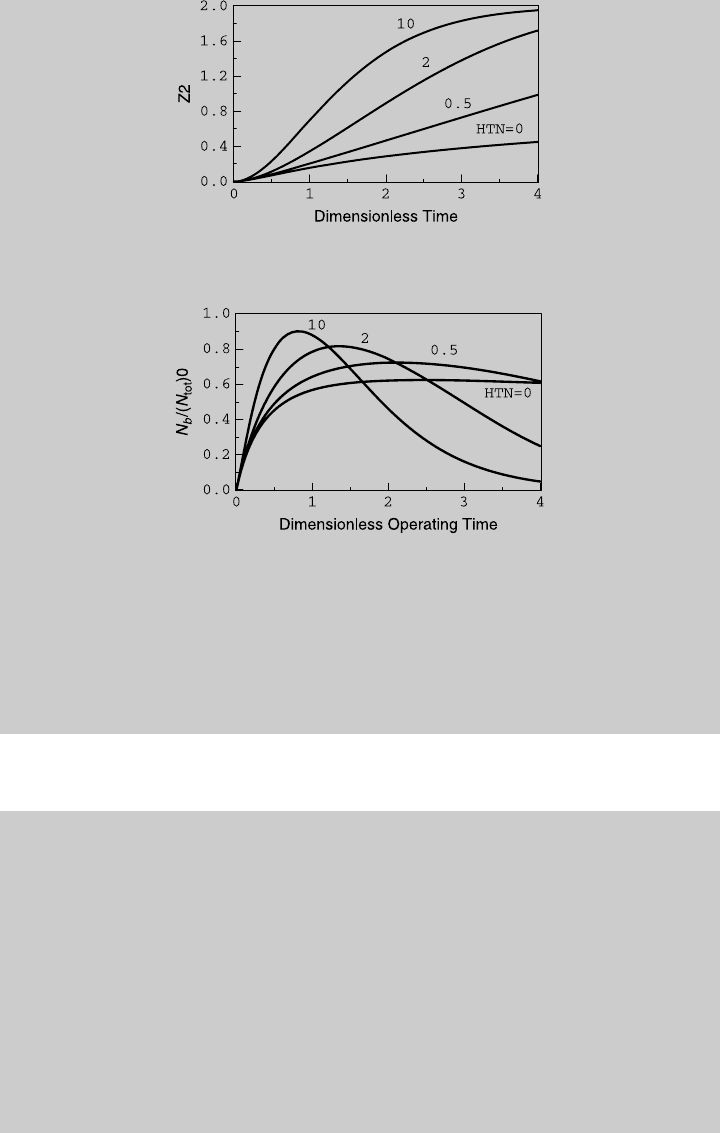
1, Figure E6.12.9 shows the effect on the progress of Reaction 2, and Figure
E6.12.10 shows the effect on the production of product B. Note that when
HTN ! 1, the temperature of the reactor is the same as the jacket tempera-
ture (678C).
Example 6.13 The gas-phase elementary chemical reactions
Reaction 1: A þ B ! C
Reaction 2: C þ B ! D
take place in an isobaric (variable-volume) batch reactor. A gas mixture consist-
ing of 50% reactant A and 50% of reactant B (mol %) is charged into the reactor,
whose initial volume is 10 L. The pressure is 2 atm and at the beginning of the
operation, the temperature is 1508C. The temperature of the cooling medium is
1208C. Based on the data below:
a. Derive the reaction operating curve for isothermal operation and determine
the operating time needed to achieve the highest production of product C.
Figure E6.12.10 Effect of HTN on the production of product B.
Figure E6.12.9 Effect of HTN on Reaction 2.
6.4 NONISOTHERMAL OPERATIONS 223

b. Determine the heating (or cooling) load during the isothermal operation.
c. Determine the instantaneous and average HTN for the isothermal operation.
d. Derive the reaction and the temperature curves when the reactor is operated
adiabatically and determine the operating time needed to achieve the highest
production of product C.
e. Examine the effect of HTN on the reactor temperature, the chemical reac-
tions, and the production of product C.
The reaction rate expressions are r
1
¼ k
1
(T )C
A
C
B
and r
2
¼ k
2
(T )C
B
C
C
.
Data: At 1508C, k
1
¼ 0:02 L mol
1
s
1
, k
2
¼ 0:02 L mol
1
s
1
DH
R
1
¼4500 cal=mol DH
R
2
¼6000 cal=mol
E
a
1
¼ 10,090 cal=mol E
a
2
¼ 12,607 cal=mol
^
c
p
A
¼ 16
^
c
p
B
¼ 8
^
c
p
C
¼ 20
^
c
p
D
¼ 26 cal=mol K
Solution Since each reaction has a species that does not appear in the other
reaction, the two reactions are independent, and there is no dependent reaction.
The stoichiometric coefficients of the chemical reactions are
s
A
1
¼1 s
B
1
¼1 s
C
1
¼ 1 s
D
1
¼ 0 s
D
1
¼1
s
A
2
¼ 0 s
B
2
¼1 s
C
2
¼1 s
D
2
¼ 1 s
D
2
¼1
We select the initial state as the reference state; hence, T
0
¼ T(0), and the refer-
ence concentration is
C
0
¼
P
0
RT
0
¼ 0:0576 mol=L
and the molar content of the reference state is
(N
tot
)
0
¼ V
R
0
C
0
¼ 0:576 mol
The initial composition is y
A
(0) ¼ 0.5, y
B
(0) ¼ 0.5, and y
C
(0) ¼ y
D
(0) ¼ 0.
Using Eq. 5.2.29, the specific molar heat capacity of the reference state is
^
c
p
0
¼
X
J
j
y
j
0
c
p
j
(T
0
) ¼ (0:5)c
p
A
þ (0:5)c
p
B
¼ 12 cal=mol K
The dimensionless activation energies are
g
1
¼
E
a
1
RT
0
¼ 12 g
2
¼
E
a
2
RT
0
¼ 15
224 IDEAL BATCH REACTOR

The dimensionless heat of reactions are
DHR
1
¼
DH
R
1
(T
0
)
^
c
p
0
T
0
¼0:886
DHR
2
¼
DH
R
2
(T
0
)
^
c
p
0
T
0
¼1:1816
Using Eq. 5.2.34, the correction factor of the heat capacity is
CF(Z
m
, u) ¼ 1 þ
1
^
c
p
0
X
J
j
^
c
p
j
(u)
X
n
I
m
(s
j
)
m
Z
m
¼ 1 þ
1
^
c
p
0
[
^
c
p
A
( Z
1
) þ
^
c
p
B
(Z
1
Z
2
) þ
^
c
p
C
(Z
1
Z
2
) þ
^
c
p
D
Z
2
]
CF(Z
m
, u) ¼
6 2Z
1
Z
2
6
(a)
We write Eq. 6.1.1 for each independent reaction, noting that V
R
=V
R
0
¼
(1 Z
1
Z
2
)u,
We use Eq. 6.1.16, to express the species concentrations, and the rates of the
two reactions are
r
1
¼ k
1
(T
0
)e
g
1
(u1)=u
C
2
0
0:5 Z
1
ðÞ0:5 Z
1
Z
2
ðÞ
[(1 Z
1
Z
2
)u]
2
(d)
r
2
¼ k
2
(T
0
)e
g
2
(u1)=u
C
2
0
(Z
1
Z
2
)0:5 Z
1
Z
2
ðÞ
[(1 Z
1
Z
2
)u]
2
(e)
We select the characteristic reaction time on the basis of Reaction 1:
t
cr
¼
1
k
1
(T
0
)C
0
¼ 868 s ¼ 14:46 min (f)
dZ
1
dt
¼ r
1
1 Z
1
Z
2
ðÞu
t
cr
C
0
(b)
dZ
2
dt
¼ r
2
1 Z
1
Z
2
ðÞu
t
cr
C
0
(c)
Substituting (d) through (f) into (b) and (c), the two design equations become
dZ
1
dt
¼
(0:5 Z
1
)(0:5 Z
1
Z
2
)
(1 Z
1
Z
2
)u
e
g
1
(u1)=u
(g)
6.4 NONISOTHERMAL OPERATIONS 225
a. For isothermal operation (u ¼ 1), (g) and (h) reduce to
dZ
1
dt
¼
(0:5 Z
1
)(0:5 Z
1
Z
2
)
1 Z
1
Z
2
(n)
dZ
2
dt
¼ (0:5)
(Z
1
Z
2
)(0:5 Z
1
Z
2
)
1 Z
1
Z
2
(o)
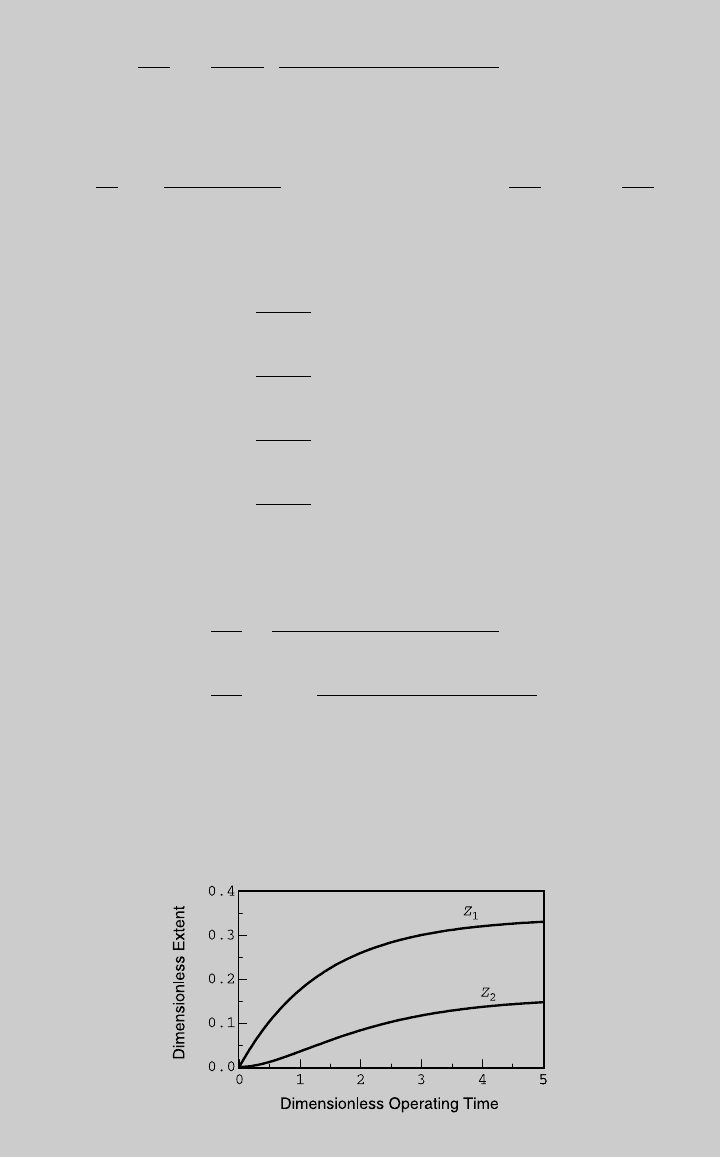
We solve (n) and (o) numerically, subject to the initial conditions that, at
t ¼ 0, Z
1
¼ Z
2
¼ 0. Figure E6.13.1 shows the reaction curves, and
Figure E6.13.2 shows the species curves calculated by (j) through (m).
From the curve of product C, the highest N
C
/(N
tot
)
0
is 0.1839 and it is
dZ
2
dt
¼
k
2
(T
0
)
k
1
(T
0
)
(Z
1
Z
2
)(0:5 Z
1
Z
2
)
(1 Z
1
Z
2
)u
e
g
2
(u1)=u
(h)
Substituting (a) into Eq. 6.1.17, the energy balance equation for this case is
du
du
¼
6
6 2Z
1
Z
2
HTN(u
F
u) DHR
1
dZ
1
dt
DHR
2
dZ
2
dt
(i)
Once we solve the design equations, we use Eq. 2.7.4 to obtain the species curves:
N
A
(N
tot
)
0
¼ 0:5 Z
1
(j)
N
B
(N
tot
)
0
¼ 0:5 Z
1
Z
2
(k)
N
C
(N
tot
)
0
¼ Z
1
Z
2
(l)
N
D
(N
tot
)
0
¼ Z
2
(m)
Figure E6.13.1 Reaction operating curves—isothermal operation.
226 IDEAL BATCH REACTOR
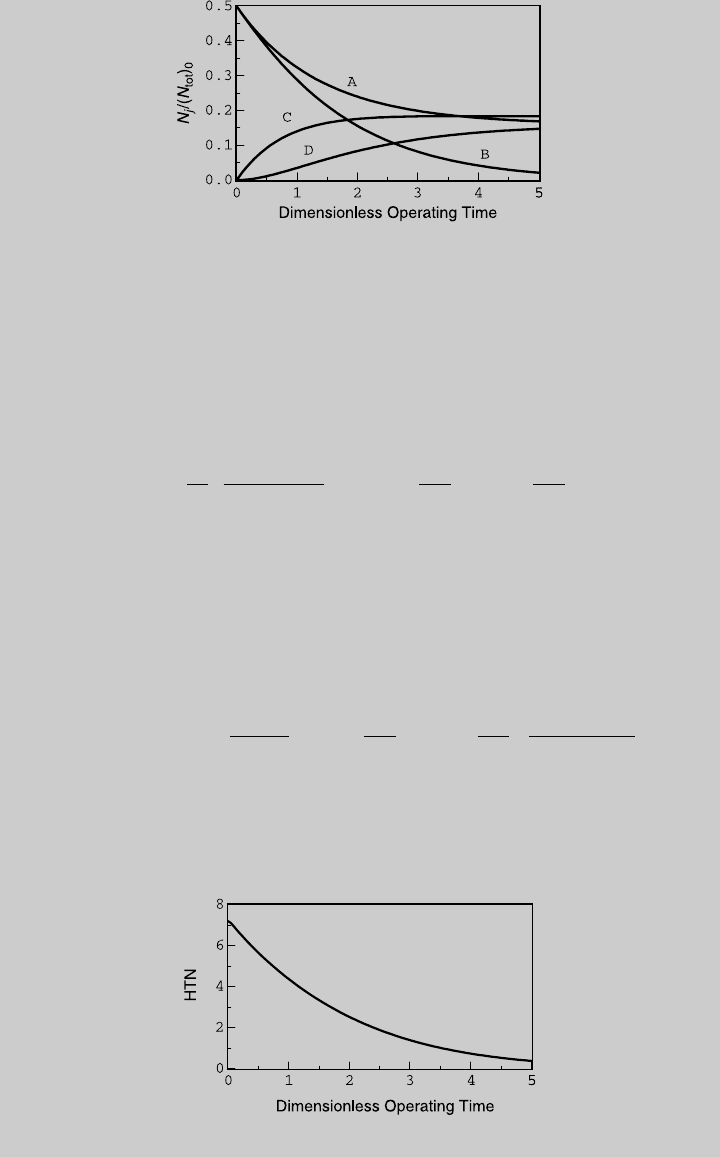
reached at t ¼ 3.7. At that operating time, Z
1
¼ 0.3166 and Z
2
¼ 0.1332.
Hence, using (f), the operating time is
t ¼ t
cr
t ¼ (14:46 min)(3:7) ¼ 53:5 min
b. For an isothermal operation, du/dt ¼ 0, substituting Eq. 6.1.20 into (i),
d
dt
Q
(N
tot
)
0
^
c
p
0
T
0
¼ DHR
1
dZ
1
dt
þ DHR
2
dZ
2
dt
(p)
Integrating (l) over operating time t
op
,
Q(t
op
) ¼ [(N
tot
)
0
^
c
p
0
T
0
][DHR
1
Z
1
(t
op
) þ DHR
2
Z(t
op
)] ¼1281 cal
The negative sign indicates that heat is removed from the reactor.
c. Using Eq. 6.1.24, the HTN at time t is
HTN
iso
(t) ¼
1
u
F
1
DHR
1
dZ
1
dt
þ DHR
2
dZ
2
dt
1
1 Z
1
Z
2
(q)
Figure E6.13.3 shows the HTN curve during the operation. Using Eq. 6.1.23,
for t
op
¼ 3.7, HTN
ave
¼ 4.35.
Figure E6.13.2 Species operating curves—isothermal operation.
Figure E6.13.3 Isothermal HTN curve.
6.4 NONISOTHERMAL OPERATIONS 227
d. For adiabatic operation, HTN ¼ 0, and the energy balance equation reduces
to
du
du
¼
6
6 2Z
1
Z
2
DHR
1
dZ
1
dt
DHR
2
dZ
2
dt
(r)
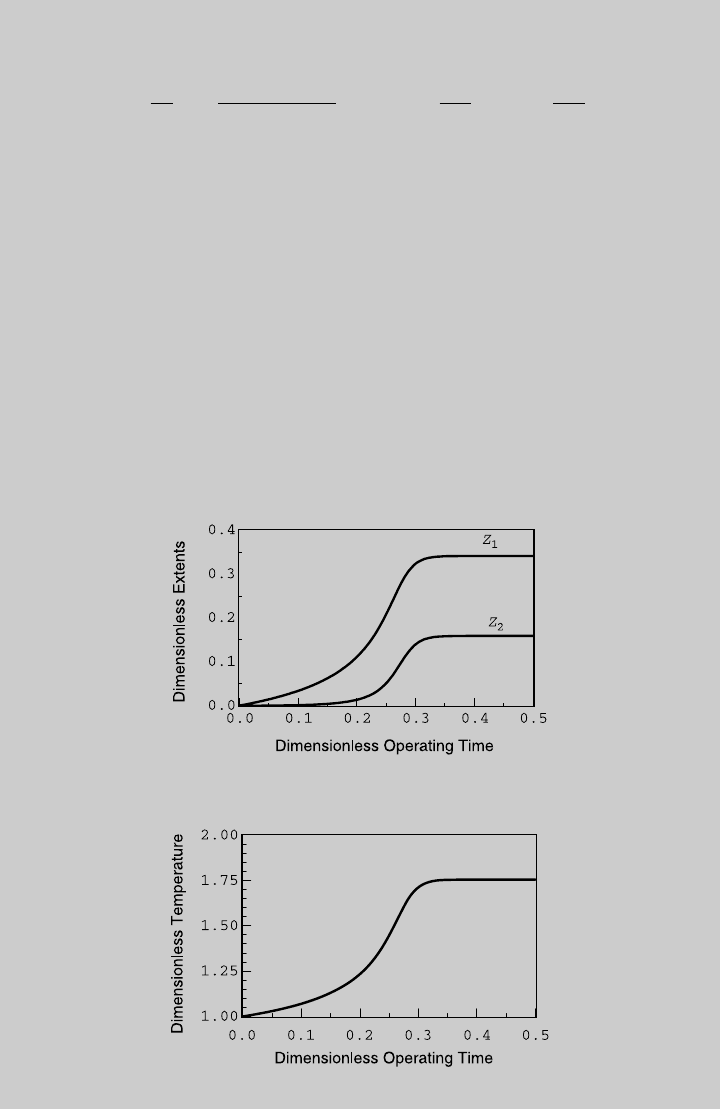
We solve (g), (h), and (r) numerically, subject to the initial condition that at
t ¼ 0, Z
1
¼ Z
2
¼ 0 and u ¼ 1. Figure E6.13.4 shows the reaction curves,
Figure E6.13.5 shows the temperature curve, and Figure E6.13.6 shows the
species curves, calculated by ( j) through (m). From the curve of product
C, the highest N
C
/(N
tot
)
0
is 0.1194 and it is reached at t ¼ 0.25. At that oper-
ating time, Z
1
¼ 0.203, Z
2
¼ 0.0836, and u ¼ 1.437. Hence, using (f), the
operating time is
t ¼ t
cr
t ¼ 3:61 min
e. To examine the effect of HTN on the reactor operation, we solve (f), (g), and
(h) for different values of HTN. Figure E6.13.7 shows the effect on the
reactor temperature, Figure E6.13.8 shows the effect on the progress of
Figure E6.13.4 Reaction operating curves—adiabatic operation.
Figure E6.13.5 Temperature curve—adiabatic operation.
228 IDEAL BATCH REACTOR
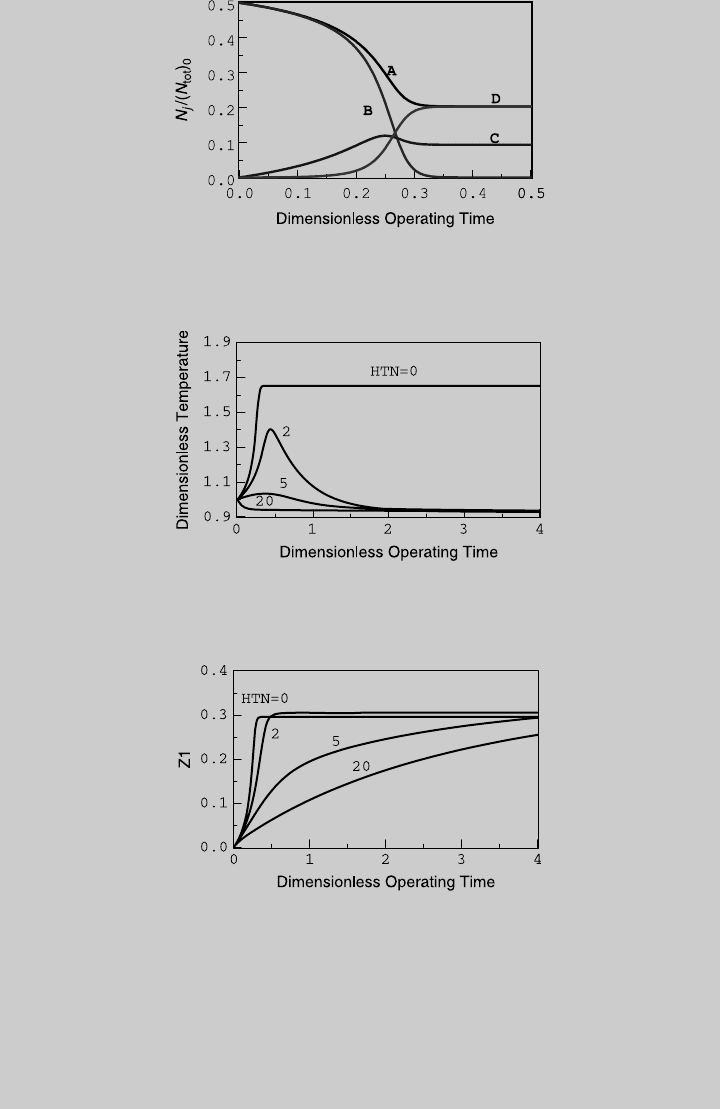
Reaction 1, Figure E6.13.9 shows the effect on the progress of Reaction 2,
and Figure E6.13.10 shows the effect on the production of product C.
Note that when HTN ! 1, the temperature of the reactor is the same as
the jacket temperature (1208C).
Figure E6.13.7 Effect of HTN on the reactor temperature.
Figure E6.13.8 Effect of HTN on Reaction 1.
Figure E6.13.6 Species operating curves—adiabatic operation.
6.4 NONISOTHERMAL OPERATIONS 229