Masters G.M. Renewable and Efficient Electric Power Systems
Подождите немного. Документ загружается.

338 WIND POWER SYSTEMS
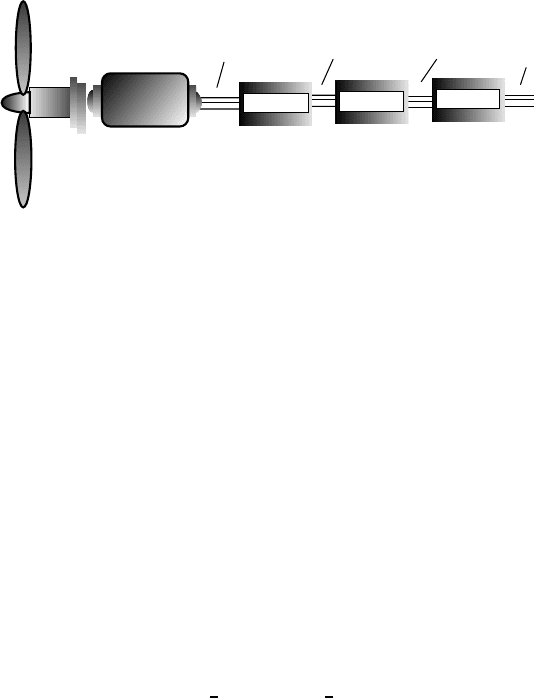
Variable-
speed
turbine
Asynchronous
generator
ac to dc dc to 60-Hz ac Smoothing
ac to
grid
Variable
frequency ac
dc 60-Hz irregular
Rectifier
Inverter
Filter
Figure 6.21 Variable-frequency output of the asynchronous generator is rectified,
inverted, and filtered to produce acceptable 60-Hz power to the grid.
the blades merely speed up, thereby reducing those system stresses. In addition,
some of that extra energy in those gusts can be captured and delivered.
6.8 AVERAGE POWER IN THE WIND
Having presented the equations for power in the wind and described the essential
components of a wind turbine system, it is time to put the two together to
determine how much energy might be expected from a wind turbine in various
wind regimes,
The cubic relationship between power in the wind and wind velocity tells us
that we cannot determine the average power in the wind by simply substituting
average windspeed into (6.4). We saw this in Example 6.1. We can begin to
explore this important nonlinear characteristic of wind by rewriting (6.4) in terms
of average values:
P
avg
= (
1
2
ρAv
3
)
avg
=
1
2
ρA(v
3
)
avg
(6.29)
In other words, we need to find the average value of the cube of velocity. To do
so will require that we introduce some statistics.
6.8.1 Discrete Wind Histogram
We are going to have to work with the mathematics of probability and statis-
tics, which may be new territory for some. To help motivate our introduction
to this material, we will begin with some simple concepts involving discrete
functions involving windspeeds, and then we can move on to more generalized
continuous functions.
What do we mean by the average of some quantity? Suppose, for example,
we collect some wind data at a site and then want to know how to figure out the
AVERAGE POWER IN THE WIND 339
average windspeed during the measurement time. The average wind speed can
be thought of as the total meters, kilometers, or miles of wind that have blown
past the site, divided by the total time that it took to do so. Suppose, for example,
that during a 10-h period, there were 3 h of no wind, 3 h at 5 mph, and 4 h at
10 mph. The average windspeed would be
v
avg
=
Miles of wind
Total hours
=
3h· 0 mile/hr +3h· 5 mile/h + 4h· 10 mile/h
3 + 3 + 4h
=
55 mile
10 h
= 5.5 mph (6.30)
By regrouping some of the terms in (6.30), we could also think of this as having
no wind 30% of the time, 5 mph for 30% of the time, and 10 mph 40% of
the time:
v
avg
=
3h
10 h
× 0mph+
3h
10 h
× 5mph+
4h
10 h
× 10 mph = 5.5mph
(6.31)
We could write (6.30) and (6.31) in a more general way as
v
avg
=
i
[v
i
· (hours @ v
i
)]
hours
=
i
[v
i
· (fraction of hours @ v
i
)] (6.32)
Finally, if those winds were typical, we could say that the probability that there is
no wind is 0.3, the probability that it is blowing 5 mph is 0.3, and the probability
that it is 10 mph is 0.4. This lets us describe the average value in probabilis-
tic terms:
v
avg
=
i
[v
i
· probability(v = v
i
)] (6.33)
We know from (6.29) that the quantity of interest in determining average
power in the wind is not the average value of v, but the average value of v
3
.
The averaging process is exactly the same as our simple example above, yielding
the following:
(v
3
)
avg
=
i
[v
i
3
· (hours @ v
i
)]
hours
=
i
[v
i
3
· (fraction of hours @ v
i
)]
(6.34)
Or, in probabilistic terms,
(v
3
)
avg
=
i
[v
i
3
· probability(v = v
i
)] (6.35)
340 WIND POWER SYSTEMS
v (m/s)
Hrs/yr
024
1
276
2
527
3
729
4
869
5
941
6
946
7
896
8
805
9
690
10
565
11
444
12
335
13
243
14
170
15
114
16
74
17
46
18
28
19
16
20
9
21
5
22
3
23
1
24
1
25
0
Total hrs 8,760
12 13 14 15 16 17 18 19 20 21 22 23 24 25
0
200
400
600
800
1000
01234567891011
Windspeed (m/s)
Hours per year windspeed
v
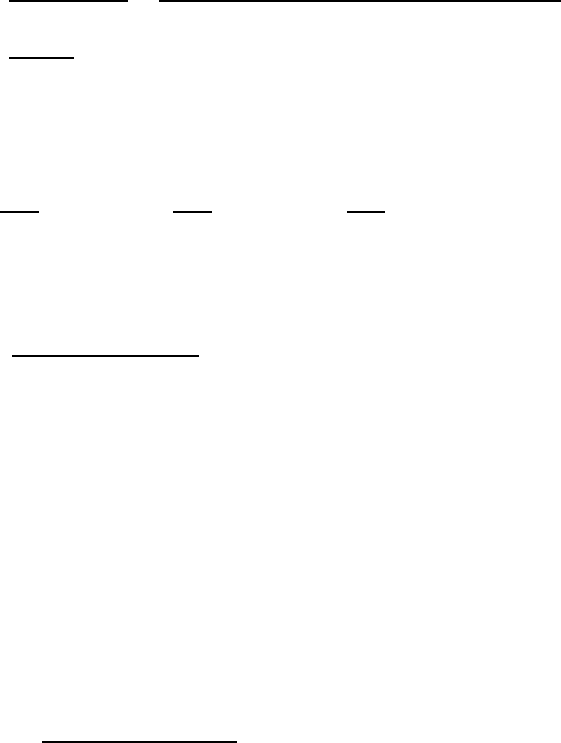
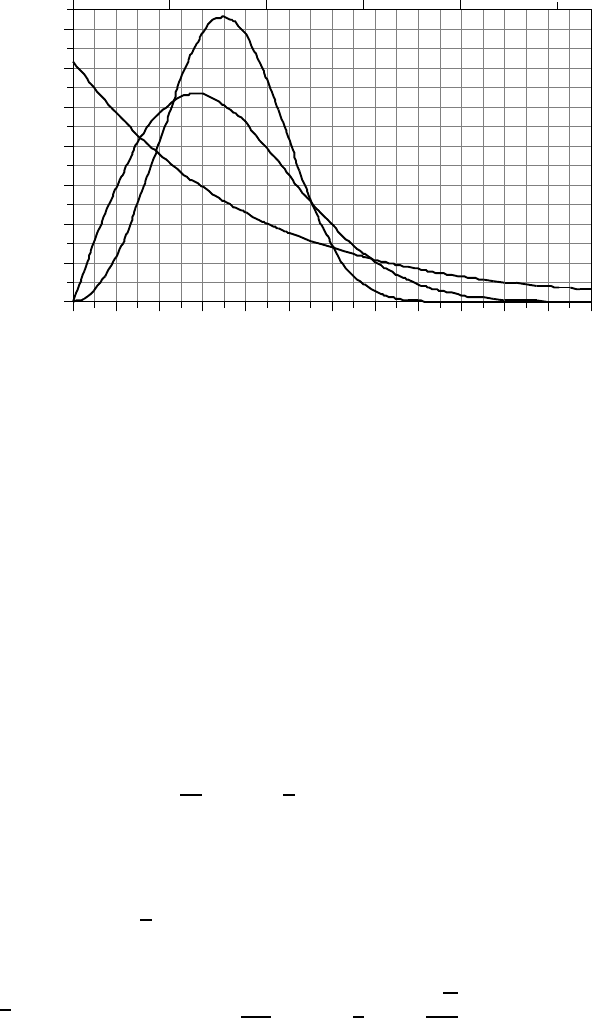
Figure 6.22 An example of site data and the resulting wind histogram showing hours
that the wind blows at each windspeed.
Begin by imagining that we have an anemometer that accumulates site data
on hours per year of wind blowing at 1 m/s (0.5 to 1.5 m/s), at 2 m/s (1.5 to
2.5 m/s), and so on. An example table of such data, along with a histogram, is
shown in Fig. 6.22.
Example 6.9 Average Power in the Wind. Using the data given in Fig. 6.22,
find the average windspeed and the average power in the wind (W/m
2
). Assume
the standard air density of 1.225 kg/m
3
. Compare the result with that which
would be obtained if the average power were miscalculated using just the aver-
age windspeed.
Solution. We need to set up a spreadsheet to determine average wind speed v
and the average value of v
3
. Let’s do a sample calculation of one line of a
spreadsheet using the 805 h/yr at 8 m/s:
Fraction of annual hours at 8 m/s =
805 h/yr
24 h/d × 365 d/yr
= 0.0919
v
8
· Fraction of hours at 8 m/s = 8m/s× 0.0919 = 0.735
(v
8
)
3
· Fraction of hours at 8 m/s = 8
3
× 0.0919 = 47.05

AVERAGE POWER IN THE WIND 341
The rest of the spreadsheet to determine average wind power using (6.29) is
as follows:
Wind
Speed
v
i
(m/s)
Hours @ v
i
per year
Fraction of
Hours @ v
i
v
i
× Fraction
Hours @ v
i
(v
i
)
3
(v
i
)
3
× fraction
Hours @ v
i
0 24 0.0027 0.000 0 0.00
1 276 0.0315 0.032 1 0.03
2 527 0.0602 0.120 8 0.48
3 729 0.0832 0.250 27 2.25
4 869 0.0992 0.397 64 6.35
5 941 0.1074 0.537 125 13.43
6 946 0.1080 0.648 216 23.33
7 896 0.1023 0.716 343 35.08
8 805 0.0919 0.735 512 47.05
9 690 0.0788 0.709 729 57.42
10 565 0.0645 0.645 1,000 64.50
11 444 0.0507 0.558 1,331 67.46
12 335 0.0382 0.459 1,728 66.08
13 243 0.0277 0.361 2,197 60.94
14 170 0.0194 0.272 2,744 53.25
15 114 0.0130 0.195 3,375 43.92
16 74 0.0084 0.135 4,096 34.60
17 46 0.0053 0.089 4,913 25.80
18 28 0.0032 0.058 5,832 18.64
19 16 0.0018 0.035 6,859 12.53
20 9 0.0010 0.021 8,000 8.22
21 5 0.0006 0.012 9,261 5.29
22 3 0.0003 0.008 10,648 3.65
23 1 0.0001 0.003 12,167 1.39
24 1 0.0001 0.003 13,824 1.58
25 0 0.0000 0.000 15,625 0.00
Totals: 8760 1.000 7.0 653.24
The average windspeed is
v
avg
=
i
[v
i
· (Fraction of hours @ v
i
)] = 7.0m/s
The average value of v
3
is
(v
3
)
avg
=
i
[v
i
3
· (Fraction of hours @ v
i
)] = 653.24
342 WIND POWER SYSTEMS
The average power in the wind is
P
avg
=
1
2
ρ(v
3
)
avg
= 0.5 × 1.225 ×653.24 = 400 W/m
2
If we had miscalculated average power in the wind using the 7 m/s average
windspeed, we would have found:
P
average
(WRONG) =
1
2
ρ(v
avg
)
3
= 0.5 × 1.225 × 7.0
3
= 210 W/m
2
In the above example, the ratio of the average wind power calculated correctly
using (v
3
)
avg
to that found when the average velocity is (mis)used is 400/210 =
1.9. That is, the correct answer is nearly twice as large as the power found
when average windspeed is substituted into the fundamental wind power equation
P =
1
2
ρAv
3
. In the next section we will see that this conclusion is always the
case when certain probability characteristics for the wind are assumed.
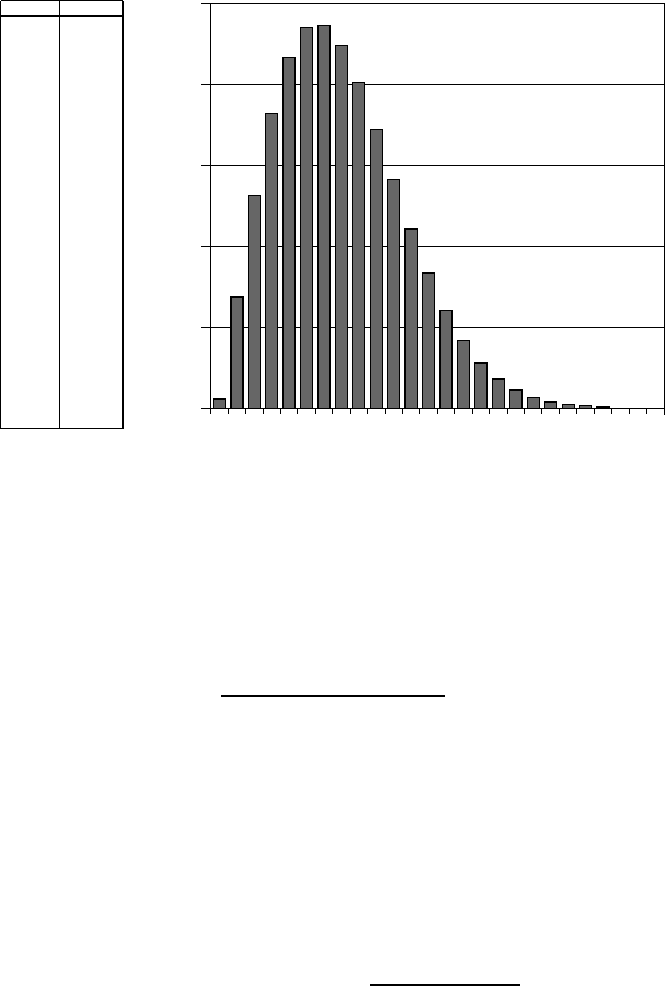
6.8.2 Wind Power Probability Density Functions
The type of information displayed in the discrete windspeed histogram in Fig. 6.22
is very often presented as a continuous function, called a probability density func-
tion (p.d.f.). The defining features of a p.d.f., such as that shown in Fig. 6.23,
are that the area under the curve is equal to unity, and the area under the curve
0.1
0.1
0.0
0.0
0.0
0.0
0.0
f
(
v
)
Windspeed,
v
Average
windspeed
Area = probability that the
wind is between
v
1
and
v
2
Area under entire curve = 1
v
2
v
1
Figure 6.23 A windspeed probability density function (p.d.f).

AVERAGE POWER IN THE WIND 343
between any two windspeeds equals the probability that the wind is between those
two speeds.
Expressed mathematically,
f(v) = windspeed probability density function
probability (v
1
≤ v ≤ v
2
) =
v
2
v
1
f(v) dv (6.36)
probability (0 ≤ v ≤∞) =
∞
0
f(v) dv = 1 (6.37)
If we want to know the number of hours per year that the wind blows between
any two windspeeds, simply multiply (6.36) by 8760 hours per year:
hours/yr (v
1
≤ v ≤ v
2
) = 8760
v
2
v
1
f(v) dv (6.38)
The average windspeed can be found using a p.d.f. in much the same manner as
it was found for the discrete approach to wind analysis (6.33):
v
avg
=
∞
0
v · f(v) dv (6.39)
The average value of the cube of velocity, also analogous to the discrete version
in (6.35), is
(v
3
)
avg
=
∞
0
v
3
· f(v) dv (6.40)
6.8.3 Weibull and Rayleigh Statistics
A very general expression that is often used as the starting point for characterizing
the statistics of windspeeds is called the Weibull probability density function:
f(v) =
k
c
v
c
k−1
exp
−
v
c
k
Weibull p.d.f. (6.41)
where k is called the shape parameter,andc is called the scale parameter.
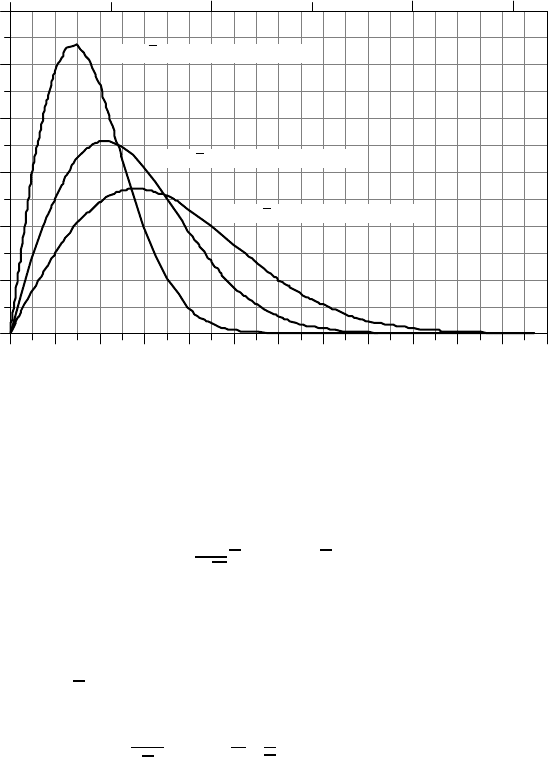
As the name implies, the shape parameter k changes the look of the p.d.f.
For example, the Weibull p.d.f. with a fixed scale parameter (c = 8) but varying
shape parameters k is shown in Fig. 6.24. For k = 1, it looks like an exponential
decay function; it would probably not be a good site for a wind turbine since
most of the winds are at such low speeds. For k = 2, the wind blows fairly
344 WIND POWER SYSTEMS
242220181614121086420
0.00
0.02
0.04
0.06
0.08
0.10
0.12
0.14
k
= 1
k
= 3
k
= 2
Probability
Windspeed
v
(m/s)
Windspeed (mph)
0 1020304050
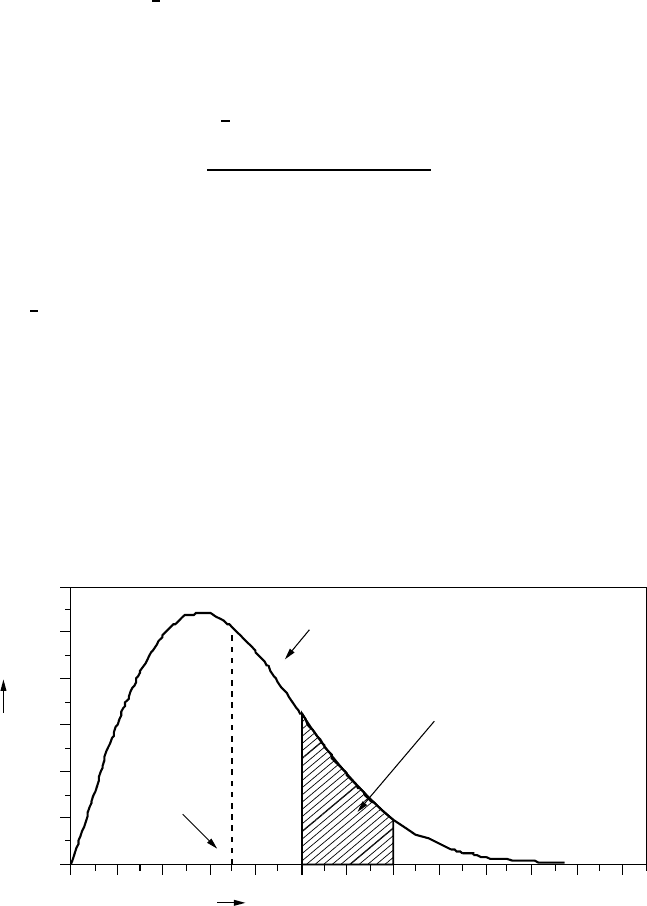
Figure 6.24 Weibull probability density function with shape parameter k = 1, 2, and 3
(with scale parameter c = 8).
consistently, but there are periods during which the winds blow much harder
than the more typical speeds bunched near the peak of the p.d.f. For k = 3, the
function resembles the familiar bell-shaped curve, and the site would be one
where the winds are almost always blowing and doing so at a fairly constant
speed, such as the trade winds do.
Of the three Weibull p.d.f.s in Fig. 6.24, intuition probably would lead us to
think that the middle one, for which k = 2, is the most realistic for a likely wind
turbine site; that is, it has winds that are mostly pretty strong, with periods of
low wind and some really good high-speed winds as well. In fact, when little
detail is known about the wind regime at a site, the usual starting point is to
assume k = 2. When the shape parameter k is equal to 2, the p.d.f. is given its
own name, the Rayleigh probability density function:
f(v) =
2v
c
2
exp
−
v
c
2
Rayleigh p.d.f. (6.42)
The impact of changing the scale parameter c for a Rayleigh p.d.f. is shown
in Fig. 6.25. As can be seen, larger-scale factors shift the curve toward higher
windspeeds. There is, in fact, a direct relationship between scaling factor c and
average wind speed
v. Substituting the Rayleigh p.d.f. into (6.39) and referring
to a table of standard integrals yield
v =
∞
0
v · f(v) dv =
∞
0
2v
2
c
2
exp
−
v
c
2
=
√
π
2
c
∼
=
0.886c(6.43)
AVERAGE POWER IN THE WIND 345
242220181614121086420
0 1020304050
0.00
0.04
0.08
0.12
0.16
0.20
0.24
Windspeed
v
(m/s)
f
(
v
)
Windspeed (mph)
c
= 4 (
v
= 3.5 m/s = 7.9 mph)
c
= 6 (
v
= 5.3 m/s = 11.9 mph)
c
= 8 (
v
= 7.1 m/s = 15.9 mph)
Figure 6.25 The Rayleigh probability density function with varying scale parameter c.
Higher scaling parameters correspond to higher average windspeeds.
Or, the other way around:
c =
2
√
π
v
∼
=
1.128 v(6.44)
Even though (6.44) was derived for Rayleigh statistics, it is quite accurate for a
range of shape factors k from about 1.5 to 4 (Johnson, 1985). Substituting (6.44)
into (6.42) gives us a more intuitive way to write the Rayleigh p.d.f. in terms of
average windspeed
v:
f(v) =
πv
2v
2
exp
−
π
4
v
v
2
Rayleigh (6.45)
6.8.4 Average Power in the Wind with Rayleigh Statistics
The starting point for wind prospecting is to gather enough site data to at least
be able to estimate average windspeed. That can most easily be done with an
anemometer (which spins at a rate proportional to the wind speed) that has a
revolution counter calibrated to indicate miles of wind that passes. Dividing miles
of wind by elapsed time gives an average wind speed. These “wind odometers”
are modestly priced (about $200 each) and simple to use. Coupling average
windspeed with the assumption that the wind speed distribution follows Rayleigh
statistics enables us to find the average power in the wind.
346 WIND POWER SYSTEMS
Substituting the Rayleigh p.d.f. (6.42) into (6.40) lets us find the average value
of the cube of windspeed:
(v
3
)
avg
=
∞
0
v
3
· f(v)dv =
∞
0
v
3
·
2v
c
2
exp
−
v
c
2
dv =
3
4
c
3
√
π(6.46)
Using (6.44) gives an alternative expression:
(v
3
)
avg
=
3
4
√
π
2
v
√
π
3
=
6
π
v
3
= 1.91 v
3
(6.47)
Equation (6.47) is very interesting and very useful. It says that if we assume
Rayleigh statistics then the average of the cube of windspeed is just 1.91 times
the average wind speed cubed. Therefore, assuming Rayleigh statistics, we can
rewrite the fundamental relationship for average power in the wind as
P =
6
π
·
1
2
ρA
v
3
(Rayleigh assumptions)(6.48)
That is, with Rayleigh statistics, the average power in the wind is equal to the
power found at the average windspeed multiplied by 6/π or 1.91.
Example 6.10 Average Power in the Wind. Estimate the average power in
the wind at a height of 50 m when the windspeed at 10 m averages 6 m/s.
Assume Rayleigh statistics, a standard friction coefficient α = 1/7, and standard
air density ρ = 1.225 kg/m
3
.
Solution. We first adjust the winds at 10 m to those expected at 50 m using (6.15):
v
50
= v
10
H
50
H
10
α
= 6 ·
50
10
1/7
= 7.55 m/s
So, using (6.48), the average wind power density would be
P
50
=
6
π
·
1
2
ρ
v
3
=
6
π
·
1
2
· 1.225 · (7.55)
3
= 504 W/m
2
We also could have found average power at 10 m and then adjust it to 50 m
using (6.17):
P
10
=
6
π
·
1
2
· 1.225 · 6
3
= 252.67 W/m
2
P
50
= P
10
H
50
H
10
3α
= 252.67
50
10
3×1/7
= 504 W/m
2
AVERAGE POWER IN THE WIND 347
Windspeed
v
(m/s)
Windspeed (mph)
201612840
0 10203040
12
8
4
0
Probability (percent)
Rayleigh with
v
= 6.4 m/s (14.3 mph)
Altamont Pass, CA
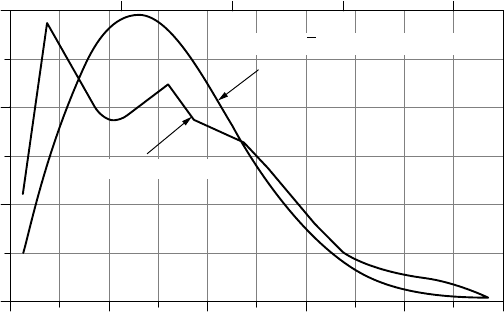
Figure 6.26 Probability density functions for winds at Altamont Pass, CA., and a
Rayleigh p.d.f. with the same average wind speed of 6.4 m/s (14.3 mph). From Cavallo
et al. (1993).
Lest we become too complacent about the importance of gathering real wind
data rather than relying on Rayleigh assumptions, consider Fig. 6.26, which shows
the probability density function for winds at one of California’s biggest wind farms,
Altamont Pass. Altamont Pass is located roughly midway between San Francisco
(on the coast) and Sacramento (inland valley). In the summer months, rising hot
air over Sacramento draws cool surface air through Altamont Pass, creating strong
summer afternoon winds, but in the winter there isn’t much of a temperature
difference and the winds are generally very light unless a storm is passing through.
The windspeed p.d.f. for Altamont clearly shows the two humps that correspond
to not much wind for most of the year, along with very high winds on hot summer
afternoons. For comparison, a Rayleigh p.d.f. with the same annual average wind
speed as Altamont (6.4 m/s) has also been drawn in Fig. 6.26.
6.8.5 Wind Power Classifications and U.S. Potential
The procedure demonstrated in Example 6.10 is commonly used to estimate aver-
age wind power density (W/m
2
) in a region. That is, measured values of average
wind speed using an anemometer located 10 m above the ground are used to esti-
mate average windspeed and power density at a height 50 m above the ground.
Rayleigh statistics, a friction coefficient of 1/7, and sea-level air density at 0
◦
C
of 1.225 kg/m
3
are often assumed. A standard wind power classification scheme
based on these assumptions is given in Table 6.5.
A map of the United States showing regions of equal wind power density based
on the above assumptions is shown in Fig. 6.27. As can be seen, there is a broad