Masters G.M. Renewable and Efficient Electric Power Systems
Подождите немного. Документ загружается.

418 THE SOLAR RESOURCE
Collector
Σ
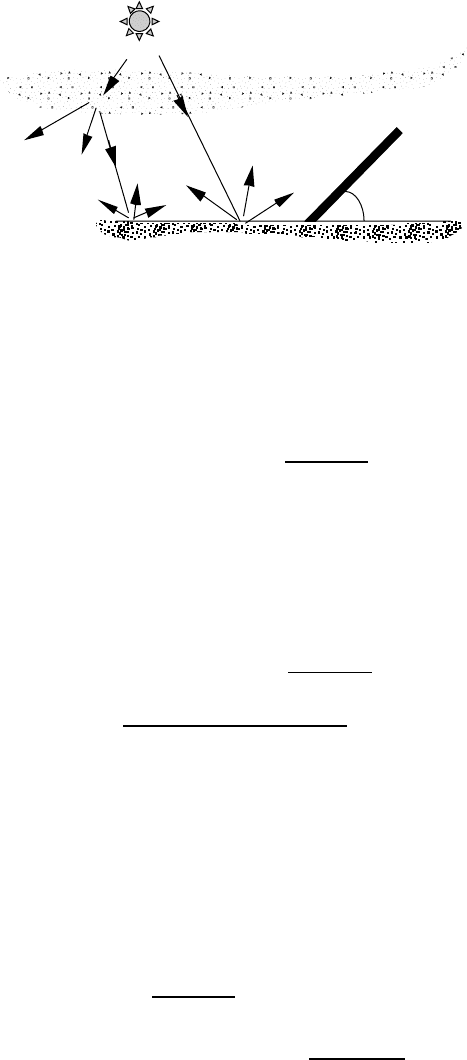
Reflectance r
Diffuse
Beam
Figure 7.24 The ground is assumed to reflect radiation with equal intensity in all
directions.
be intercepted by the collector depends on the slope of the panel , resulting in
the following expression for reflected radiation striking the collector I
RC
:
I
RC
= ρ(I
BH
+ I
DH
)
1 − cos
2
(7.30)
For a horizontal collector ( = 0), Eq. (7.30) correctly predicts no reflected
radiation on the collector; for a vertical panel, it predicts that the panel “sees”
half of the reflected radiation, which also is appropriate for the model.
Substituting expressions (7.25) and (7.27) into (7.30) gives the following for
reflected radiation on the collector:
I
RC
= ρI
B
(sin β + C)
1 − cos
2
(7.31)
Example 7.11 Reflected Radiation Onto a Collector. Continue Examples 7.9
and 7.10 and find the reflected radiation on the panel if the reflectance of the
surfaces in front of the panel is 0.2. Recall that it is solar noon in Atlanta on
May 21, the altitude angle of the sun β is 76.4
◦
, the collector faces 20
◦
toward
the southeast and is tipped up at a 52
◦
angle, the diffuse sky factor C is 0.121,
and the clear-sky beam insolation is 902 W/m
2
.
Solution. From (7.31), the clear-sky reflected insolation on the collector is
I
RC
= ρI
B
(sin β + C)
1 − cos
2
= 0.2 · 902 W/m
2
(sin 76.4
◦
+ 0.121)
1 − cos 52
◦
2
= 38 W/m
2

TOTAL CLEAR SKY INSOLATION ON A COLLECTING SURFACE 419
The total insolation on the collector is therefore
I
C
= I
BC
+ I
DC
+ I
RC
= 697 + 88 + 38 = 823 W/m
2
Of that total, 84.7% is direct beam, 10.7% is diffuse, and 4.6% is reflected. The
reflected portion is clearly modest and is often ignored.
Combining the equations for the three components of radiation, direct beam,
diffuse and reflected gives the following for total rate at which radiation strikes
a collector on a clear day:
I
C
= I
BC
+ I
DC
+ I
RC
(7.32)
I
C
= Ae
−km
cos β cos(φ
S
− φ
C
) sin + sin β cos + C
1 + cos
2
+ρ(sin β + C)
1 − cos
2
(7.33)
Equation (7.33) looks terribly messy, but it is a convenient summary, which can
be handy when setting up a spreadsheet or other computerized calculation of
clear sky insolation.
7.9.4 Tracking Systems
Thus far, the assumption has been that the collector is permanently attached to a
surface that doesn’t move. In many circumstances, however, racks that allow the
collector to track the movement of the sun across the sky are quite cost effective.
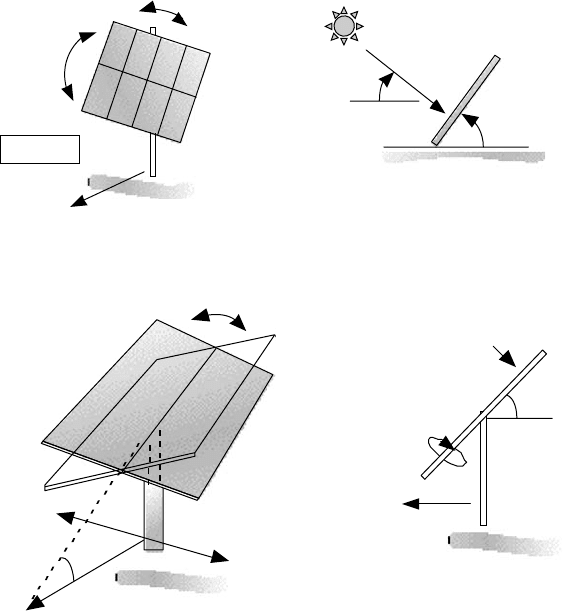
Trackers are described as being either two-axis trackers, which track the sun both
in azimuth and altitude angles so the collectors are always pointing directly at
the sun, or single-axis trackers , which track only one angle or the other.
Calculating the beam plus diffuse insolation on a two-axis tracker is quite
straightforward (Fig. 7.25). The beam radiation on the collector is the full inso-
lation I
B
normal to the rays calculated using (7.21). The diffuse and reflected
radiation are found using (7.29) and (7.31) with a collector tilt angle equal to the
complement of the solar altitude angle, that is, 90
◦
−β.
Two-Axis Tracking:
I
BC
= I
B
(7.34)
I
DC
= CI
B
1 + cos(90
◦
− β)
2
(7.35)
I
RC
= ρ(I
BH
+ I
DH
)
1 − cos(90
◦
− β)
2
(7.36)
420 THE SOLAR RESOURCE
E-W
N-S
2-AXIS
I
BC
=
I
B
f
C
= f
S
Σ = 90° − b
Collector
b
Figure 7.25 Two-axis tracking angular relationships.
E-W
S
Σ
Σ
E
W
=
L
S
15°/hr
Polar mount
Axis of rotation
Post
Figure 7.26 A single-axis tracking mount with east–west tracking. A polar mount has
the axis of rotation facing south and tilted at an angle equal to the latitude.
Single-axis tracking for photovoltaics is almost always done with a mount
having a manually adjustable tilt angle along a north-south axis, and a track-
ing mechanism that rotates the collector array from east-to-west, as shown in
Fig. 7.26. When the tilt angle of the mount is set equal to the local latitude
(called a polar mount), not only is that an optimum angle for annual collection,
but the collector geometry and resulting insolation are fairly easy to evaluate
as well.
As shown in Fig. 7.27, if a polar mount rotates about its axis at the same rate
as the earth turns, 15
◦
/h, then the centerline of the collector will always face
directly into the sun. Under these conditions, the incidence angle θ between a
normal to the collector and the sun’s rays will be equal to the solar declination δ.
That makes the direct-beam insolation on the collector just I
B
cos δ.Toevaluate
diffuse and reflected radiation, we need to know the tilt angle of the collector.
As can be seen in Fig. 7.26, while the axis of rotation has a fixed tilt of = L,
unless it is solar noon, the collector itself is cocked at an odd angle with respect
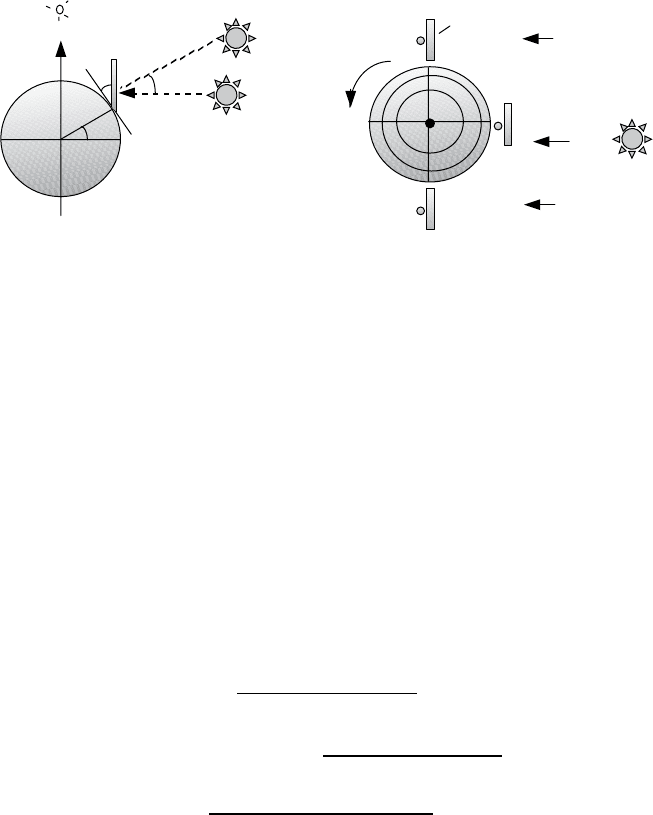
TOTAL CLEAR SKY INSOLATION ON A COLLECTING SURFACE 421
Polaris
L
L
N
N
Solar noon
p.m.
f
C
= H =−90°
f
c
= H = 0°
a.m.
f
C
= H = 90°
(a) (b)
Collector
d
Figure 7.27 (a) Polar mount for a one-axis tracker showing the impact of a 15
◦
/h angular
rotation of the collector array. (b) Looking down on North Pole.
to the horizontal plane. The effective tilt, which is the angle between a normal to
the collector and the horizontal plane, is given by
effective
= 90 − β + δ(7.37)
The beam, diffuse, and reflected radiation on a polar mount, one-axis tracker
are given by
One-Axis, Polar Mount:
I
BC
= I
B
cos δ (7.38)
I
DC
= CI
B
1 + cos(90
◦
− β + δ)
2
(7.39)
I
RC
= ρ(I
BH
+ I
DH
)
1 − cos(90
◦
− β + δ)
2
(7.40)
Example 7.12 One-Axis and Two-Axis Tracker Insolation. Compare the 40
◦
latitude, clear-sky insolation on a collector at solar noon on the summer solstice
for a two-axis tracking mount versus a single-axis polar mount. Ignore ground
reflectance.
Solution
1. Two-Axis Tracker: To find the beam insolation from (7.21) I
B
= Ae
−km
,
we need the air mass ratio m, the apparent extraterrestrial flux A,andthe
optical depth k.Tofindm, we need the altitude angle of the sun. Using (7.7)

422 THE SOLAR RESOURCE
with a solstice declination of 23.45
◦
,
β
N
= 90
◦
− L + δ = 90 − 40 + 23.45 = 73.45
◦
Air mass ratio m =
1
sin β
=
1
sin 73.45
◦
= 1.043
From Table 7.6, or Eqs. (7.22), (7.23) and (7.28), we find A = 1088 W/m
2
,
k = 0.205, and C = 0.134. The direct beam insolation on the collector
is therefore
I
BC
= I
B
= Ae
−km
= 1088 (W/m
2
) · e
−0.205x1 .043
= 879 W/m
2
Using (7.35) the diffuse radiation on the collector is
I
DC
= CI
B
1 + cos(90
◦
− β)
2
= 0.134 ·879
1 + cos(90
◦
− 73.45
◦
)
2
= 115 W/m
2
The total is I
C
= I
BC
+ I
DC
= 879 + 115 = 994 W/m
2
2. One-Axis Polar Tracker: The beam portion of insolation is given by (7.38)
I
BC
= I
B
cos δ = 879 W/m
2
cos(23.45
◦
) = 806 W/m
2
The diffuse portion, using (7.39), is
I
DC
= CI
B
1 + cos(90
◦
− β + δ)
2
= 0.134 · 879 W/m
2
1 + cos(90 − 73.45 + 23.45)
2
= 104 W/m
2
The total is I
C
= I
BC
+ I
DC
= 806 + 104 = 910 W/m
2
The two-axis tracker provides 994 W/m
2
, which is only 9% higher than the
single-axis mount.
To assist in keeping this whole set of clear-sky insolation relationships straight,
Box 7.2 offers a helpful summary of nomenclature and equations. And, obviously,
working with these equations is tedious until they have been put onto a spread-
sheet. Or, for most purposes it is sufficient to look up values in a table and, if
necessary, do some interpolation. In Appendix C there are tables of hour-by-hour
clear-sky insolation for various tilt angles and latitudes, an example of which is
given here in Table 7.7.

TOTAL CLEAR SKY INSOLATION ON A COLLECTING SURFACE 423
BOX 7.2 SUMMARY OF CLEAR-SKY S OLAR INSOLATION
EQUATIONS
I
0
= extraterrestrial solar insolation
m = air mass ratio
I
B
= beam insolation at earth’s surface
A = apparent extraterrestrial solar insolation
k = atmospheric optical depth
C = sky diffuse factor
I
BC
= beam insolation on collector
θ = incidence angle
= collector tilt angle
I
H
= insolation on a horizontal surface
I
DH
= diffuse insolation on a horizontal surface
I
DC
= diffuse insolation on collector
I
RC
= reflected insolation on collector
ρ = ground reflectance
I
C
= insolation on collector
n = day number
β = solar altitude angle
δ = solar declination
φ
S
= solar azimuth angle (+=AM)
φ
C
= collector azimuth angle (+=SE)
I
0
= 1370
1 + 0.034 cos
360n
365
(W/m
2
)
m =
1
sin β
I
B
= Ae
−km
A = 1160 + 75 sin
360
365
(n − 275)
(W/m
2
)
k = 0.174 + 0.035 sin
360
365
(n − 100)
I
BC
= I
B
cos θ
cos θ = cos β cos(φ
S
− φ
C
) sin + sin β cos
I
BH
= I
B
cos(90
◦
− β) = I
B
sin β
I
DH
= CI
B

424 THE SOLAR RESOURCE
C = 0.095 +0.04 sin
360
365
(n − 100)
I
DC
= I
DH
1 + cos
2
= I
B
C
1 + cos
2
I
RC
= ρI
B
(sin β + C)
1 − cos
2
I
C
= I
BC
+ I
DC
+ I
RC
I
C
= Ae
−km
cos β cos(φ
S
− φ
C
) sin + sin β cos + C
1 + cos
2
+ρ(sin β + C)
1 − cos
2
Two-Axis Tracking:
I
BC
= I
B
I
DC
= CI
B
1 + cos(90
◦
− β)
2
I
RC
= ρ(I
BH
+ I
DH
)
1 − cos(90
◦
− β)
2
One-Axis, Polar Mount:
I
BC
= I
B
cos δ
I
DC
= CI
B
1 + cos(90
◦
− β + δ)
2
I
RC
= ρ(I
BH
+ I
DH
)
1 − cos(90
◦
− β + δ)
2
7.10 MONTHLY CLEAR-SKY INSOLATION
The instantaneous insolation equations just presented can be tabulated into daily,
monthly and annual values that provide considerable insight into the impact of
collector orientation. For example, Table 7.8 presents monthly and annual clear
sky insolation on collectors with various azimuth and tilt angles, as well as for
one- and two-axis tracking mounts, for latitude 40
◦
N. They have been computed
as the sum of just the beam plus diffuse radiation, which ignores the usually
modest reflective contribution. Similar tables for other latitudes are given in

MONTHLY CLEAR-SKY INSOLATION 425
TA BLE 7.7 Hour-by-Hour Clear-Sky Insolation in June for Latitude 40
◦
Solar Tracking Tilt Angles, Latitude 40
◦
Time
One-Axis Two-Axis 0 20 30 40 50 60 90
June 21 (W/m
2
)
6, 6 471 524 188 128 93 57 53 48 32
7, 5 668 742 386 330 289 240 185 126 45
8, 4 772 855 572 538 498 445 380 305 51
9, 3 835 921 731 722 686 632 560 473 147
10, 2 875 961 853 865 834 780 703 607 233
11, 1 898 982 929 956 928 874 795 693 288
12 906 989 955 987 960 906 826 723 308
kWh/d: 9.94 10.96 8.27 8.06 7.62 6.96 6.18 5.23 1.90
Note: Similar tables for other months and latitudes are given in Appendix C
Appendix D. When plotted, as has been done in Fig. 7.28, it becomes apparent
that annual performance is relatively insensitive to wide variations in collector
orientation for nontracking systems. For this latitude, the annual insolation for
south-facing collectors varies by less than 10% for collectors mounted with tilt
angles ranging anywhere from 10
◦
to 60
◦
. And, only a modest degradation is
noted for panels that don’t face due south. For a 45
◦
collector azimuth angle
(southeast, southwest), the annual clear sky insolation available drops by less
than 10% in comparison with south-facing panels at similar tilt angles.
While Fig. 7.28 seems to suggest that orientation isn’t critical, remember that
it has been plotted for annual insolation without regard to monthly distribution.
For a grid-connected photovoltaic system, for example, this may be a valid way to
consider orientation. Deficits in the winter are automatically offset by purchased
utility power, and any extra electricity generated during the summer can simply
go back onto the grid. For a stand-alone PV system, however, where batteries
or a generator provide back-up power, it is quite important to try to smooth out
the month-to-month energy delivered to minimize the size of the back-up system
needed in those low-yield months.
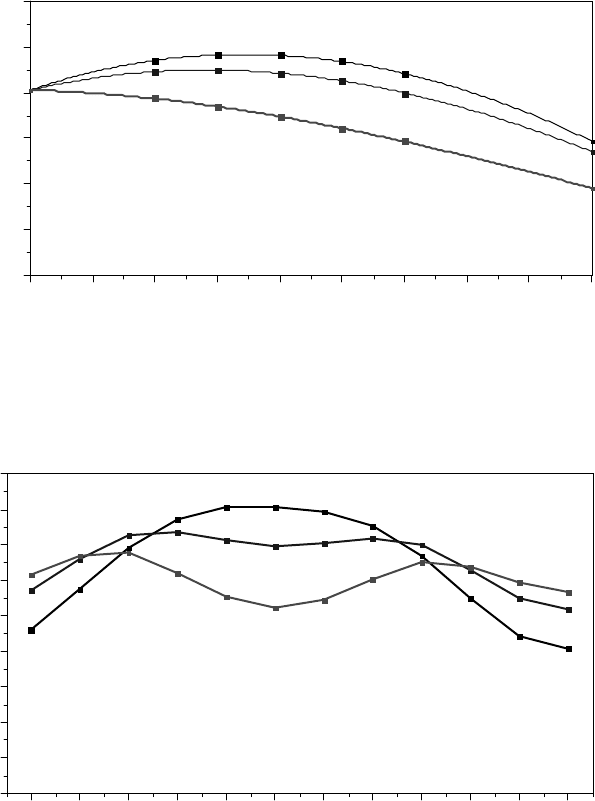
A graph of monthly insolation, instead of the annual plots given in Fig. 7.28,
shows dramatic variations in the pattern of monthly solar energy for different
tilt angles. Such a plot for three different tilt angles at latitude 40
◦
, each having
nearly the same annual insolation, is shown in Fig. 7.29. As shown, a collector
at the modest tilt angle of 20
◦
would do well in the summer, but deliver very
little in the winter, so it wouldn’t be a very good angle for a stand-alone PV
system. At 40
◦
or 60
◦
, the distribution of radiation is more uniform and would
be more appropriate for such systems.
In Fig. 7.30, monthly insolation for a south-facing panel at a fixed tilt angle
equal to its latitude is compared with a one-axis polar mount tracker and also
TA BLE 7.8 Daily and Annual Clear-Sky Insolation (Beam plus Diffuse) for Various Fixed-Orientation Collectors, Along with one-
and Two-Axis Trackers
Daily Clear-Sky Insolation (kWh/m
2
) Latitude 40
◦
N
Azim: S SE/SW E, W Tracking
Tilt: 0 20 30 40 50 60 90 20 30 40 50 60 90 20 30 40 50 60 90 One-Axis Two-Axis
Jan 3.0 4.6 5.2 5.7 6.0 6.2 5.5 4.1 4.5 4.7 4.9 4.9 4.0 2.9 2.8 2.7 2.6 2.4 1.7 6.8 7.2
Feb 4.2 5.8 6.3 6.6 6.8 6.7 5.4 5.3 5.6 5.7 5.7 5.5 4.2 4.1 3.9 3.7 3.5 3.3 2.2 8.2 8.3
Mar 5.8 6.9 7.2 7.3 7.1 6.8 4.7 6.5 6.6 6.6 6.4 6.0 4.1 5.5 5.3 5.0 4.6 4.3 2.8 9.5 9.5
Apr 7.2 7.7 7.7 7.4 6.9 6.2 3.3 7.5 7.4 7.1 6.6 6.1 3.7 6.9 6.6 6.2 5.7 5.2 3.3 10.3 10.6
May 8.1 8.0 7.7 7.1 6.4 5.5 2.3 8.0 7.6 7.2 6.5 5.8 3.2 7.7 7.3 6.8 6.2 5.5 3.5 10.2 11.0
Jun 8.3 8.1 7.6 7.0 6.2 5.2 1.9 8.0 7.6 7.1 6.4 5.6 3.0 7.8 7.4 6.9 6.3 5.6 3.4 9.9 11.0
July 8.0 7.9 7.6 7.0 6.3 5.5 2.2 7.9 7.5 7.1 6.4 5.7 3.2 7.6 7.2 6.7 6.1 5.5 3.4 10.0 10.7
Aug 7.1 7.5 7.5 7.2 6.7 6.0 3.2 7.3 7.2 6.9 6.5 5.9 3.6 6.7 6.4 6.0 5.5 5.0 3.2 9.8 10.1
Sept 5.6 6.7 6.9 7.0 6.9 6.5 4.5 6.3 6.4 6.3 6.1 5.8 4.0 5.4 5.2 4.9 4.5 4.1 2.7 9.0 9.0
Oct 4.1 5.5 6.0 6.3 6.4 6.4 5.1 5.0 5.3 5.4 5.4 5.2 4.0 3.9 3.7 3.6 3.3 3.1 2.1 7.7 7.8
Nov 2.9 4.5 5.1 5.5 5.8 5.9 5.3 3.9 4.3 4.6 4.7 4.7 3.9 2.8 2.7 2.6 2.5 2.3 1.6 6.5 6.9
Dec 2.5 4.1 4.7 5.2 5.5 5.7 5.2 3.6 3.9 4.2 4.4 4.4 3.8 2.4 2.3 2.2 2.1 2.0 1.4 6.0 6.5
Tot al 2029 2352 2415 2410 2342 2208 1471 2231 2249 2216 2130 1997 1357 1938 1848 1738 1612 1467 960 3167 3305
Tables for other latitudes are in Appendix D
426
MONTHLY CLEAR-SKY INSOLATION 427
9080706050403020100
0
500
1000
1500
2000
2500
3000
COLLECTOR TILT ANGLE
ANNUAL INSOLATION (kWh/m
2
)
SOUTH-FACING
EAST, WEST
SE, SW
LATITUDE 40°N
Figure 7.28 Annual insolation, assuming all clear days, for collectors with varying
azimuth and tilt angles. Annual amounts vary only slightly over quite a range of collector
tilt and azimuth angles.
JAN FEB MAR APR MAY JUN JLY AUG SEP OCT N0V DEC
0
1
2
3
4
5
6
7
8
9
DAILY INSOLATION (kWh/m
2
)
20° TILT, 2350 kWh/m
2
-yr
40° TILT, 2410 kWh/m
2
-yr
60° TILT, 2210 kWh/m
2
-yr
LATITUDE 40°N
Figure 7.29 Daily clear-sky insolation on south-facing collectors with varying tilt angles.
Even though they all yield roughly the same annual energy, the monthly distribution is
very different.
a two-axis tracker. The performance boost caused by tracking is apparent: Both
trackers are exposed to about one-third more radiation than the fixed collector.
Notice, however, that the two-axis tracker is only a few percent better than the
single-axis version, with almost all of this improvement occurring in the spring
and summer months.