Schmuller J. Statistical Analysis with Excel For Dummies
Подождите немного. Документ загружается.


Chapter 4
Finding Your Center
In This Chapter
▶ Working within your means
▶ Meeting conditions
▶ The median is the message
▶ Getting into the mode
S
tatisticians deal with groups of numbers. They often find it helpful to use
a single number to summarize a group of numbers. Where would a single
summary number come from?
The best bet is to find a number that’s somewhere in the middle, and use
that number to stand for the whole group. If you look at a group of numbers
and try to find one that’s somewhere in the middle, you’re dealing with that
group’s central tendency. Like good ice cream, central tendency comes in sev-
eral flavors.
Means: The Lore of Averages
Just about everyone uses averages. The statistical term for an average is
mean. Sometime in your life, you’ve undoubtedly calculated one. The mean is
a quick way of characterizing your grades, your money, or perhaps your per-
formance in some task or sport over time.
Another reason for calculating means concerns the kind of work that sci-
entists do. Typically, a scientist applies some kind of procedure to a small
sample of people or things and measures the results in some way. He or she
uses the results from the sample to estimate the effects of the procedure
on the population that produced the sample. As it happens, the mean of the
sample is the best estimate of the population mean.
09 454060-ch04.indd 7909 454060-ch04.indd 79 4/21/09 7:20:39 PM4/21/09 7:20:39 PM
80
Part II: Describing Data
Calculating the mean
You probably don’t need me to tell you how to calculate a mean, but I’m
going to do it anyway. Then I’ll show you the statistical formula. My goal is to
help you understand statistical formulas in general, and then set you up for
how Excel calculates means.
A mean is just the sum of a bunch of numbers divided by the amount of num-
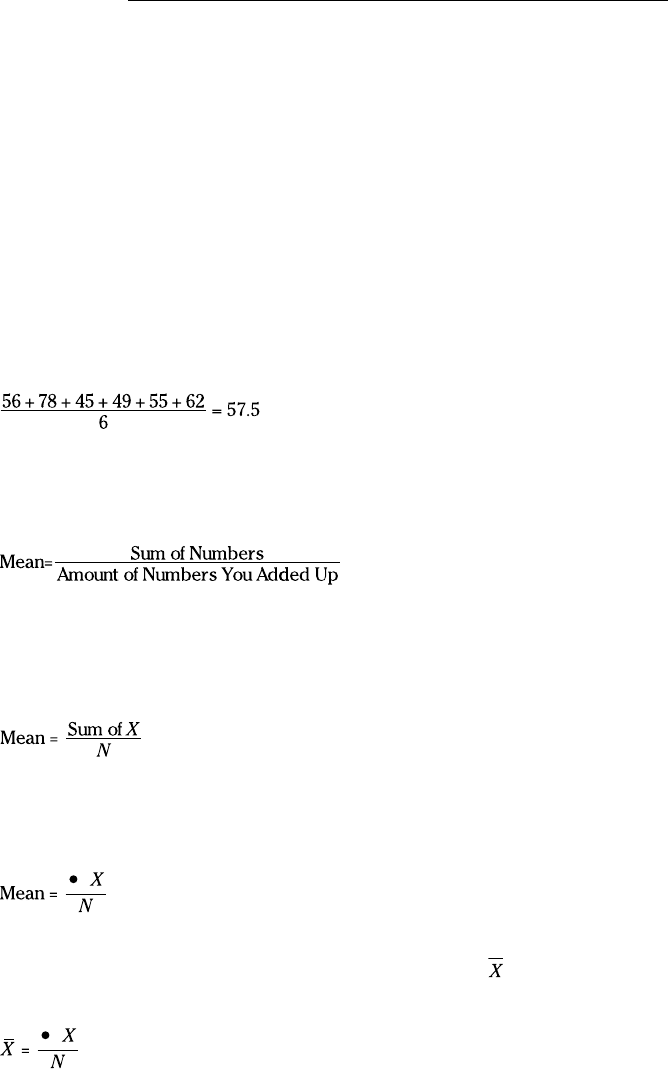
bers you added up. Here’s an example. Suppose you measure the reading
speeds of six children in words per minute, and you find that their speeds are
56, 78, 45, 49, 55, 62
The average reading speed of these six children is
That is, the mean of this sample is 57.5 words per minute.
A first try at a formula might be
This is unwieldy as formulas go, so statisticians use abbreviations. A com-
monly used abbreviation for “Number” is x. A typical abbreviation for
“Amount of Numbers You Added Up” is N. With these abbreviations, the for-
mula becomes
Another abbreviation, used throughout statistics, stands for Sum of. It’s the
uppercase Greek letter for S. It’s pronounced “sigma” and it looks like this: Σ.
Here’s the formula with the sigma:
What about “mean”? Statisticians abbreviate that, too. M would be a good
abbreviation, and some statisticians use it, but most use
(pronounced “X
bar”) to represent the mean. So here’s the formula:
09 454060-ch04.indd 8009 454060-ch04.indd 80 4/21/09 7:20:39 PM4/21/09 7:20:39 PM
81
Chapter 4: Finding Your Center
Is that it? Well . . . not quite. English letters, like , represent characteristics
of samples. For characteristics of populations, the abbreviations are Greek
letters. For the population mean, the abbreviation is the Greek equivalent of
M, which is μ (pronounced like “you” but with “m” in front of it). The formula
for the population mean, then, is
AVERAGE and AVERAGEA
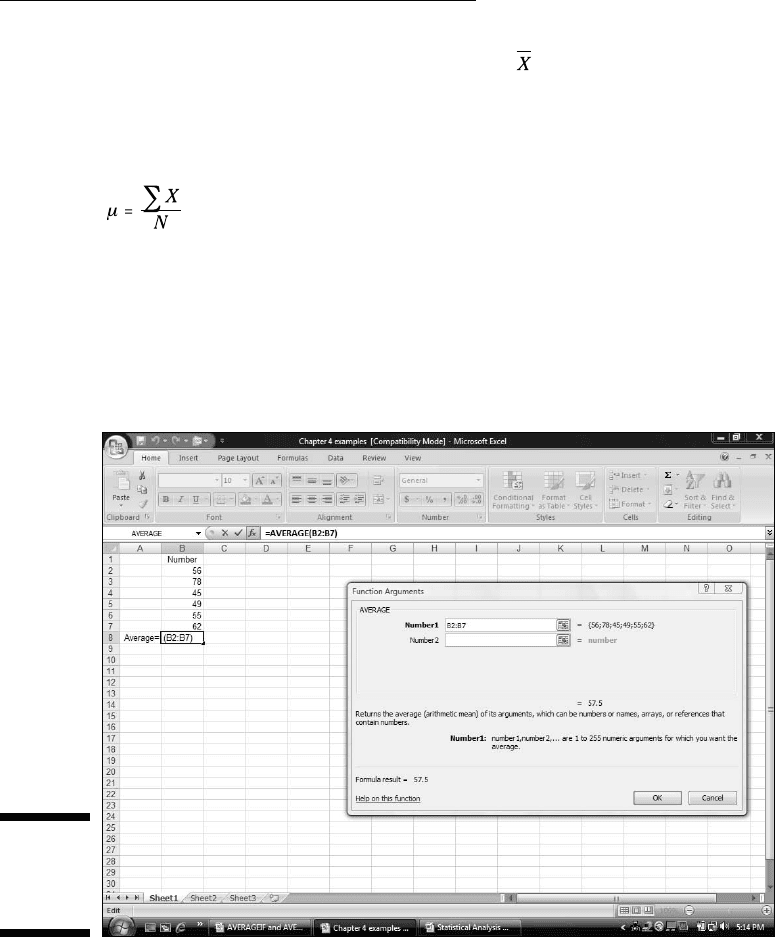
Excel’s AVERAGE worksheet function calculates the mean of a set of numbers.
Figure 4-1 shows the data and Function Arguments dialog box for AVERAGE.
Figure 4-1:
Working
with
AVERAGE.
Here are the steps:
1. In your worksheet, enter your numbers into an array of cells and
select the cell where you want AVERAGE to place the result.
For this example, I entered 56, 78, 45, 49, 55, 62 into cells B2 through B7,
and I selected B8 for the result.
09 454060-ch04.indd 8109 454060-ch04.indd 81 4/21/09 7:20:40 PM4/21/09 7:20:40 PM

82
Part II: Describing Data
2. From the Statistical Functions menu, choose AVERAGE to open the
AVERAGE Function Arguments dialog box.
3. In the Function Arguments dialog box, enter the values for the
arguments.
If the array of number-containing cells isn’t already in the Number1 box,
I enter it into that box. The mean (57.5 for this example) appears in this
dialog box.
4. Click OK to close the AVERAGE Function Arguments dialog box.
This puts the mean into the cell selected in the worksheet. In this exam-
ple, that’s B8.
As you can see in Figure 4-1, the formula in the Formula bar is
=AVERAGE(B2:B7)
Had I defined Number as the name of B2 through B7 (see Chapter 2), the for-
mula would be
=AVERAGE(Number)
AVERAGEA does the same thing as AVERAGE, but with one important difference.
When AVERAGE calculates a mean, it ignores cells that contain text and it ignores
cells that contain the expressions TRUE or FALSE. AVERAGEA takes text and
expressions into consideration when it calculates a mean. As far as AVERAGEA is
concerned, if a cell has text or FALSE, it has a value of 0. If a cell holds the word
TRUE, it has a value of 1. AVERAGEA includes these values in the mean.
I’m not sure that you’ll use this capability during everyday statistical work
(I never have), but Excel has worksheet functions like AVERAGEA, VARA, and
STDEVA, and I want you to know how they operate. So here are the steps for
AVERAGEA.
1. Type the numbers into the worksheet and select a cell for the result.
For this example, I entered the numbers 56, 78, 45, 49, 55, 62 in cells B2
through B7 and select B9. This leaves B8 blank. I did this because I’m going
to put different values into B8 and show you the effect on AVERAGEA.
2. From the Statistical Functions menu, select AVERAGEA to open the
AVERAGEA Function Arguments dialog box.
3. In the Function Arguments dialog box, enter the values for the
arguments.
This time I entered B2:B8 into the Number1 box. The mean (57.5)
appears in this dialog box. AVERAGEA ignores blank cells, just as
AVERAGE does.
4. Click OK to close the Function Arguments dialog box and the answer
appears in the selected cell.
09 454060-ch04.indd 8209 454060-ch04.indd 82 4/21/09 7:20:40 PM4/21/09 7:20:40 PM
83
Chapter 4: Finding Your Center
Now for some experimentation. In B8, if I type xxx, the mean in B9 changes
from 57.5 to 49.28571. Next, typing TRUE into B8 changes the mean in B9 to
49.42857. Finally, after typing FALSE into B8, the mean changes to 49.28571.
Why the changes? AVERAGEA evaluates a text string like xxx as zero. Thus,
the average in this case is based on seven numbers (not six), one of which
is zero. AVERAGEA evaluates the value TRUE as 1. So the average with TRUE
in B8 is based on seven numbers, one of which is 1.00. AVERAGEA evaluates
FALSE as zero, and calculates the same average as when B8 holds xxx.
AVERAGEIF and AVERAGEIFS
These two functions are new in Excel 2007. They calculate average condition-
ally. AVERAGEIF includes numbers in the average if a particular condition is
met. AVERAGEIFS includes numbers in the average if more than one condi-
tion is met.
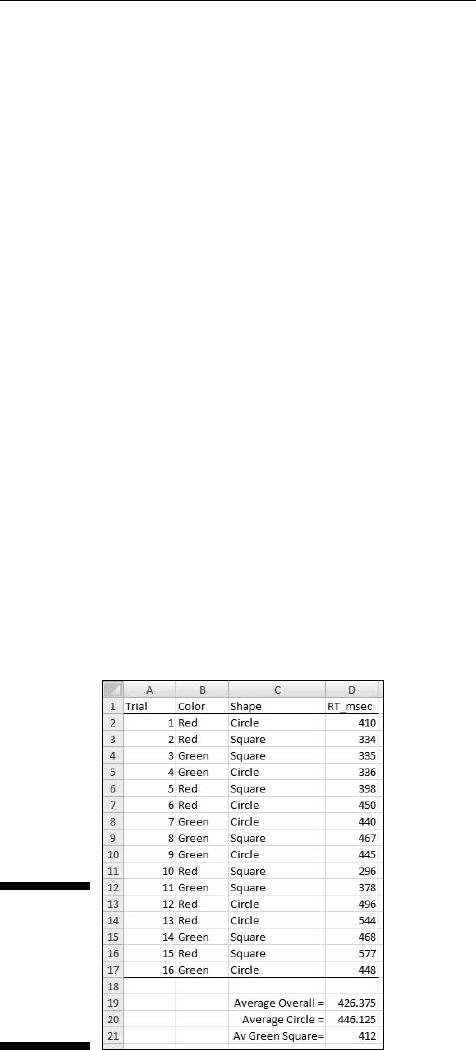
To show you how these two new functions work, I set up the worksheet in
Figure 4-2. The entries represent the data from a fictional psychology experi-
ment. In this experiment, a person sits in front of a screen and a color-filled
shape appears. The color is either red or green and the shape is either a
square or a circle. The combination for each trial is random, and all combina-
tions appear an equal number of times. In the lingo of the field, each appear-
ance of a color-filled shape is called a trial. So the worksheet shows the
outcomes of 16 trials.
Figure 4-2:
Data from
16 trials of
a fictional
psychology
experiment.
The person sitting in front of the screen presses a button as soon as he or she
sees the shape. Column D (labeled RT msec) presents one person’s reaction
09 454060-ch04.indd 8309 454060-ch04.indd 83 4/21/09 7:20:40 PM4/21/09 7:20:40 PM
84
Part II: Describing Data
time in milliseconds (thousandths of a second) for each trial. Columns B
and C show the characteristics of the shape presented on that trial. So, for
example, row 2 tells you that on the first trial, a red circle appeared and the
person responded in 410 msec (milliseconds).
For each column, I defined the name in the top cell of the column to refer
to the data in that column. If you don’t remember how to do that, reread
Chapter 2.
I’ve calculated three averages. The first, Average Overall (in cell D19) is just
=AVERAGE(RT_msec)
What about those other two? Cell D20 holds the average of trials that dis-
played a circle. That’s what I mean by a conditional average. It’s the average
of trials that meet the condition Shape = Circle.
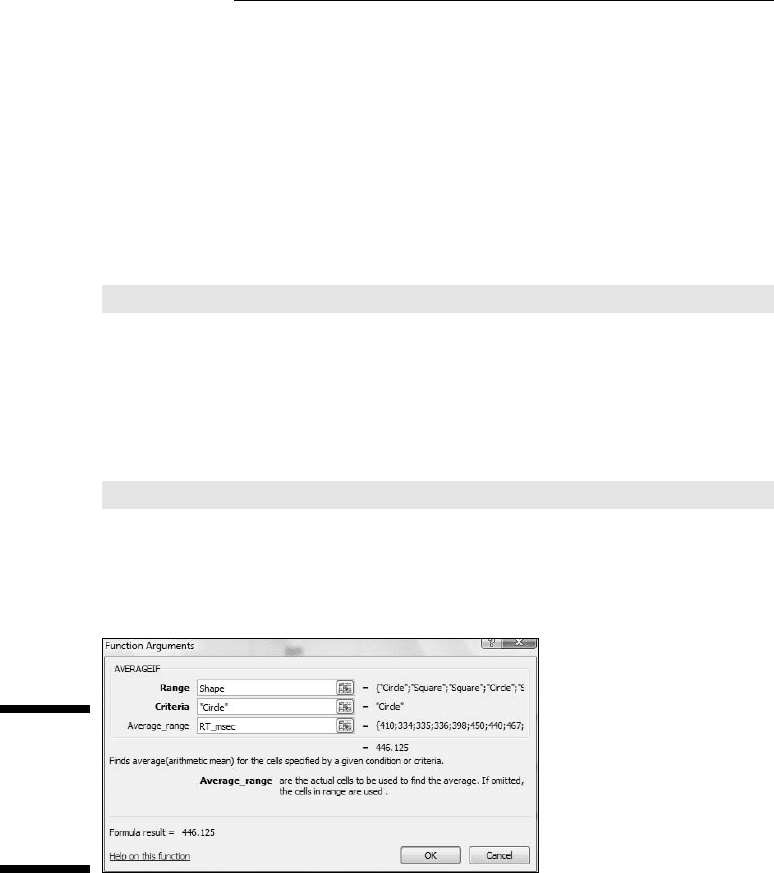
Figure 4-3 shows the completed Function Arguments dialog box for
AVERAGEIF. The formula created after clicking OK is
=AVERAGEIF(Shape,”Circle”,RT_msec)
What the dialog box and the formula are telling you is this: Excel includes a
cell in column D (RT_msec) in the average if the corresponding cell in column
B (Shape) holds the value “Circle.” If not, the cell is not included.
Figure 4-3:
The
completed
dialog
box for
AVERAGEIF.
To create this formula, follow these steps:
1. Type the numbers into the worksheet and select a cell for the result.
The cell I selected is D20.
2. From the Statistical Functions menu select AVERAGEIF to open the
AVERAGEIF Function Arguments dialog box.
09 454060-ch04.indd 8409 454060-ch04.indd 84 4/21/09 7:20:40 PM4/21/09 7:20:40 PM
85
Chapter 4: Finding Your Center
3. In the Function Arguments dialog box, enter the values for the
arguments.
For AVERAGEIF in this example the Range is Shape, the Criteria is
“Circle” (Excel types the double-quotes), and the Average_range is
RT_msec.
4. Click OK to close the Function Arguments dialog box and the answer
appears in the selected cell.
Some more on AVERAGEIF: To find the average of the first eight trials, the
formula is
=AVERAGEIF(Trial,”<9”,RT_msec)
To find the average of reaction times faster than 400 msec the formula is
=AVERAGEIF(RT_msec,”<400”,RT_msec)
For each of these last two, the operator “<” precedes the numeric value. If you
try to somehow set it up so that the value precedes the operator, the formula
won’t work.
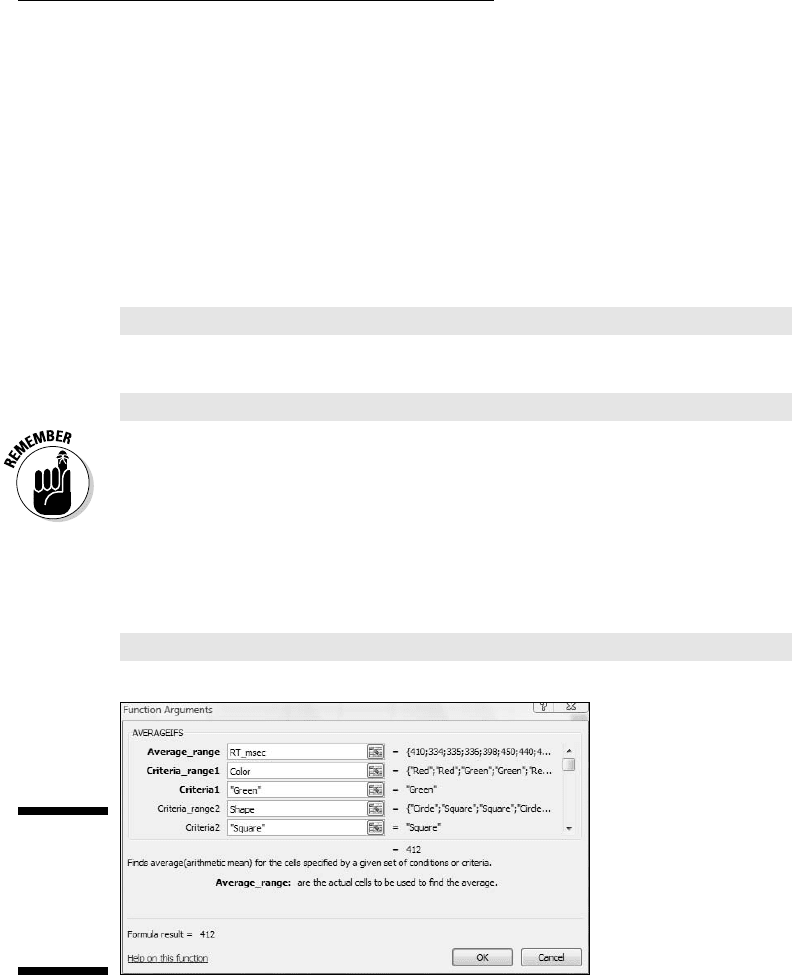
What about the average for Green Squares in cell D21? Figure 4-4 shows the
completed dialog box for AVERAGEIFS, which can work with more than one
criterion. The formula for calculating the average of trials on which Color =
Green and Shape = Square is
=AVERAGEIFS(RT_msec,Color,”Green”,Shape,”Square”)
Figure 4-4:
The
completed
dialog
box for
AVERAGEIFS.
Notice that RT_msec is the first argument in AVERAGEIFS but the last argu-
ment in AVERAGEIF.
09 454060-ch04.indd 8509 454060-ch04.indd 85 4/21/09 7:20:40 PM4/21/09 7:20:40 PM

86
Part II: Describing Data
To create this formula, follow these steps:
1. Type the numbers into the worksheet and select a cell for the result.
The cell I selected is D21.
2. From the Statistical Functions menu select AVERAGEIFS to open the
AVERAGEIFS Function Arguments dialog box.
3. In the Function Arguments dialog box, enter the values for the
arguments.
For AVERAGEIFS in this example the Average_range is RT_msec.
Criteria_range1 is “Color” and Criteria1 is “Green”. Criteria_range2 is
Shape, the Criteria is “Square”. (Excel types the double-quotes.)
4. Click OK to close the Function Arguments dialog box and the answer
appears in the selected cell.
Given what you just saw, you may be wondering why it’s necessary for Excel
to have both AVERAGEIF and AVERAGEIFS. After all,
=AVERAGEIF(Shape,”Circle”,RT_msec)
gives the same answer as
=AVERAGEIFS(RT_msec, Shape,”Circle”)
So why two functions? Short answer: I don’t know. Long answer: I don’t know.
TRIMMEAN
In a retake on a famous quote about statistics, someone said “There are three
kinds of liars: liars, darned liars, and statistical outliers.” An outlier is an
extreme value in a set of scores — so extreme, in fact, that the person who
gathered the scores believes that something is amiss.
One example of outliers involves psychology experiments that measure a
person’s time to make a decision. Measured in thousandths of a second,
these “reaction times” depend on the complexity of the decision. The more
complex the decision, the longer the reaction time.
Typically, a person in this kind of experiment goes through many experimen-
tal trials — one decision per trial. A trial with an overly fast reaction time
(way below the average) might indicate that the person made a quick guess
without really considering what he or she was supposed to do. A trial with a
very slow reaction time (way above the average) might mean that the person
wasn’t paying attention at first and then buckled down to the task at hand.
09 454060-ch04.indd 8609 454060-ch04.indd 86 4/21/09 7:20:41 PM4/21/09 7:20:41 PM
87
Chapter 4: Finding Your Center
Either kind of outlier can get in the way of conclusions based on averaging
the data. For this reason, it’s often a good idea to eliminate them before you
calculate the mean. Statisticians refer to this as “trimming the mean,” and
Excel’s TRIMMEAN function does this.
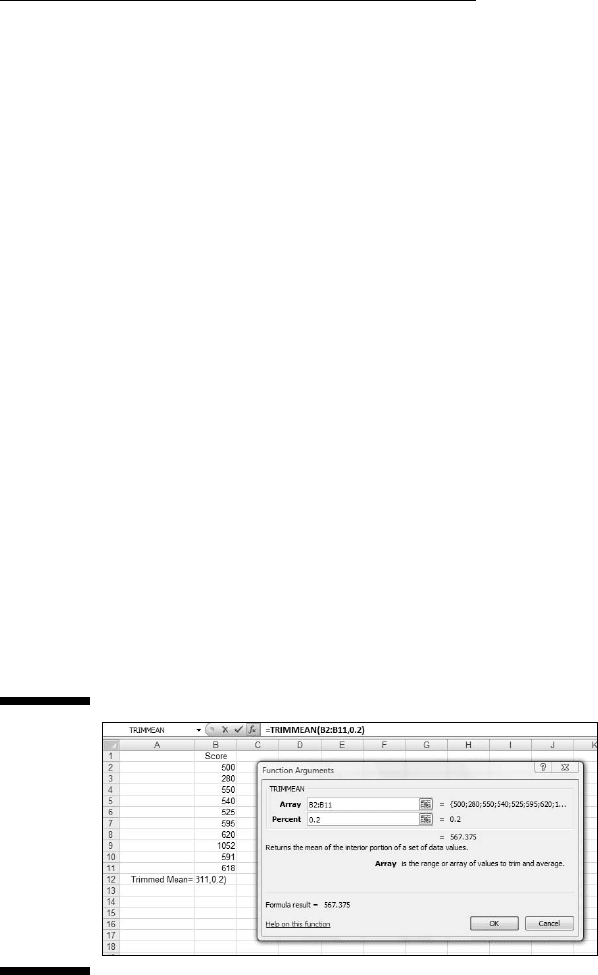
Here’s how you use TRIMMEAN:
1. Type the scores into a worksheet and select a cell for the result.
For this example, I put these numbers into cells B2 through B11:
500, 280, 550, 540, 525, 595, 620, 1052, 591, 618
These scores might result from a psychology experiment that measures
reaction time in thousandths of a second (milliseconds). I selected B12
for the result.
2. From the Statistical Functions menu, select TRIMMEAN to open the
TRIMMEAN Function Arguments dialog box.
3. In the Function Arguments dialog box, type the values for the
arguments.
The data array goes into the Array box. For this example, that’s B2:B11.
Next, I have to identify the percent of scores I want to trim. In the Percent
box, I enter .2. This tells TRIMMEAN to eliminate the extreme 20 percent
of the scores before calculating the mean. The extreme 20 percent means
the highest 10 percent of scores and the lowest 10 percent of scores.
Figure 4-5 shows the dialog box, the array of scores, and the selected
cell. The dialog box shows the value of the trimmed mean, 567.375.
Figure 4-5:
The
TRIMMEAN
Function
Arguments
dialog box
along with
the array
of cells and
the selected
cell.
4. Click OK to close the dialog box and the answer appears in the
selected cell.
09 454060-ch04.indd 8709 454060-ch04.indd 87 4/21/09 7:20:41 PM4/21/09 7:20:41 PM

88
Part II: Describing Data
The label Percent is a little misleading here. You have to express the percent
as a decimal. So you enter .2 rather than 20 in the Percent box if you want to
trim the extreme 20 percent. (Quick question: If you enter 0 in the Percent
box, what’s the answer equivalent to? Answer: AVERAGE(B2:B11)
What percentage of scores should you trim? That’s up to you. It depends on
what you’re measuring, how extreme your scores can be, and how well you
know the area you’re studying. When you do trim scores and report a mean,
it’s important to let people know that you’ve done this and to let them know
the percentage you’ve trimmed.
In the upcoming section on the median, I show you another way to deal with
extreme scores.
Other means to an end
This section deals with two types of averages that are different from the one
you’re familiar with. I tell you about them because you might run into them
as you go through Excel’s statistical capabilities. (How many different kinds
of averages are possible? Ancient Greek mathematicians came up with 11!)
Geometric mean
Suppose you have a two-year investment that yields 25 percent the first year
and 75 percent the second year. (If you do, I want to know about it!) What’s
the average annual rate of return?
To answer that question, you might be tempted to find the mean of 25 and 75
(which averages out to 50). But that misses an important point: At the end of
the first year, you multiply your investment by 1.25 — you don’t add 1.25 to it.
At the end of the second year, you multiply the first-year result by 1.75.
The regular everyday garden-variety mean won’t give you the average rate of
return. Instead, you calculate the mean this way:
The average rate of return is about 65.4 percent, not 50 percent. This kind of
average is called the geometric mean.
In this example, the geometric mean is the square root of the product of two
numbers. For three numbers, the geometric mean is the cube root of the product
of the three. For four numbers, it’s the fourth root of their product, and so on.
In general, the geometric mean of N numbers is the Nth root of their product.
The Excel worksheet function GEOMEAN calculates the geometric mean of
a group of numbers. Follow the same steps as you would for AVERAGE, but
select GEOMEAN from the Statistical Functions menu.
09 454060-ch04.indd 8809 454060-ch04.indd 88 4/21/09 7:20:41 PM4/21/09 7:20:41 PM