Schmuller J. Statistical Analysis with Excel For Dummies
Подождите немного. Документ загружается.

109
Chapter 5: Deviating from the Average
In Table 5-4, notice the vertical lines around Deviation in the heading for the
third column. Vertical lines around a number symbolize its absolute value.
That is, the vertical lines are the mathematical symbol for “How about if we
just ignore the minus signs?”
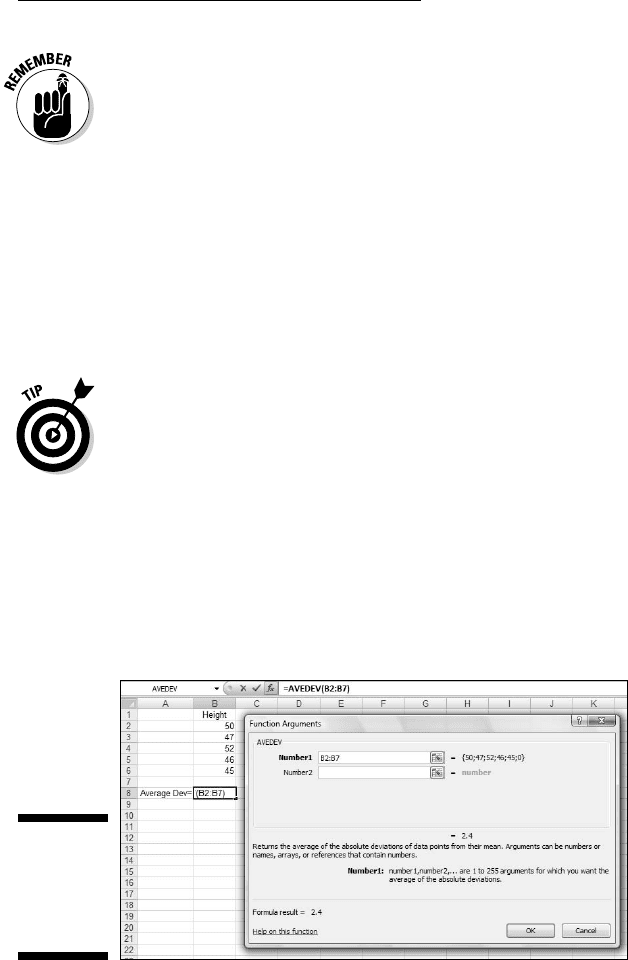
The average of the numbers in the third column is 2.4. This average is called
the average absolute deviation, and it’s a quick and easy way to characterize
the spread of measurements around their mean. It’s in the same units as the
original measurements. So if the heights are in inches, the absolute average
deviation is in inches, too.
Like variance and standard deviation, a large average absolute deviation
signifies a lot of spread. A small average absolute deviation signifies little
spread.
This statistic is less complicated than variance or standard deviation, but is
rarely used. Why? For reasons that are (once again) beyond our scope, statis-
ticians can’t use it as the foundation for additional statistics you’ll meet later.
Variance and standard deviation serve that purpose.
AVEDEV
Excel’s AVEDEV worksheet function calculates the average absolute devia-
tion of a group of numbers. Figure 5-10 shows the AVEDEV dialog box, which
presents the average absolute deviation for the cells in the indicated range.
Figure 5-10:
The AVEDEV
Function
Arguments
dialog box.
10 454060-ch05.indd 10910 454060-ch05.indd 109 4/21/09 7:21:16 PM4/21/09 7:21:16 PM

110
Part II: Describing Data
10 454060-ch05.indd 11010 454060-ch05.indd 110 4/21/09 7:21:16 PM4/21/09 7:21:16 PM

Chapter 6
Meeting Standards and Standings
In This Chapter
▶ How to standardize scores
▶ Making comparisons
▶ Ranks in files
▶ Rolling in the percentiles
I
n my left hand I hold 15 Argentine pesos. In my right, I hold 100 Chilean
pesos. Which is worth more? Both currencies are called pesos, right? So
shouldn’t the 100 be greater than the 15? Not necessarily. “Peso” is just word
magic — a coincidence of names. Each one comes out of a different country,
and each country has its own economy. To compare the two amounts of
money, you have to convert each currency into a standard unit. The most
intuitive standard for us is our own currency. How much is each amount
worth in dollars and cents? As I write this, 15 Argentine pesos are worth
more than $4. One hundred Chilean pesos are worth about 15 cents.
In this chapter, I show you how to use statistics to create standard units.
Standard units show you where a score stands in relation to other scores in a
group, and I show you additional ways to determine a score’s standing within
a group.
Catching Some Zs
As the previous paragraph shows, a number in isolation doesn’t really tell
a story. In order to fully understand what a number means, you have to
consider the process that produced it. In order to compare one number to
another, they both have to be on the same scale.
In some cases, like currency conversion, it’s easy to figure out a standard. In
others, like temperature conversion or conversion into the metric system, a
formula guides you.
11 454060-ch06.indd 11111 454060-ch06.indd 111 4/21/09 7:21:57 PM4/21/09 7:21:57 PM
112
Part II: Describing Data
When it’s not all laid out for you, you can use the mean and the standard
deviation to standardize scores that come from different processes. The idea
is to take a set of scores and use its mean as a zero-point and its standard
deviation as a unit of measure. Then you compare the deviation of each score
from the mean to the standard deviation. You’re asking “how big is a particu-
lar deviation relative to (something like) an average of all the deviations?”
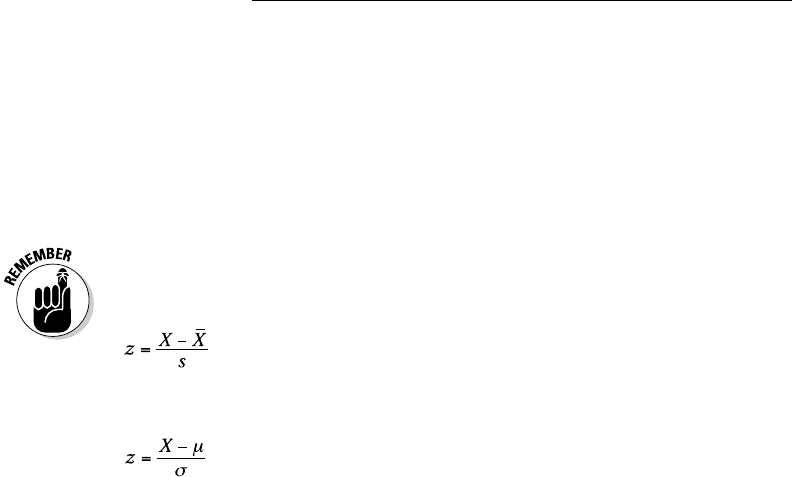
To do this, you divide the score’s deviation by the standard deviation. In
effect, you transform the score into another kind of score. The transformed
score is called a standard score, or a z-score.
The formula for this is
if you’re dealing with a sample, and
if you’re dealing with a population. In either case, x represents the score
you’re transforming into a z-score.
Characteristics of z-scores
A z-score can be positive, negative, or zero. A negative z-score represents a
score that’s less than the mean and a positive z-score represents a score that’s
greater than the mean. When the score is equal to the mean, its z-score is zero.
When you calculate the z-score for every score in the set, the mean of the
z-scores is 0, and the standard deviation of the z-scores is 1.
After you do this for several sets of scores, you can legitimately compare
a score from one set to a score from another. If the two sets have different
means and different standard deviations, comparing without standardizing is
like comparing apples with kumquats.
In the examples that follow, I show how to use z-scores to make comparisons.
Bonds versus The Bambino
Here’s an important question that often comes up in the context of serious
metaphysical discussions: Who is the greatest home run hitter of all time,
11 454060-ch06.indd 11211 454060-ch06.indd 112 4/21/09 7:21:57 PM4/21/09 7:21:57 PM
113
Chapter 6: Meeting Standards and Standings
Barry Bonds or Babe Ruth? Although this is a difficult question to answer,
one way to get your hands around it is to look at each player’s best season
and compare the two. Bonds hit 73 home runs in 2001, and Ruth hit 60 in
1927. On the surface, Bonds appears to be the more productive hitter.
The year 1927 was very different from 2001, however. Baseball (and every-
thing else) went through huge changes in the intervening years, and player
statistics reflect those changes. A home run was harder to hit in the 20s than
in the 00s. Still, 73 versus 60? Hmmm . . .
Standard scores can help us decide whose best season was better. To stan-
dardize, I took the top 50 home run hitters of 1927 and the top 50 from 2001.
I calculated the mean and standard deviation of each group, and then turned
Ruth’s 60 and Bonds’s 73 into z-scores.
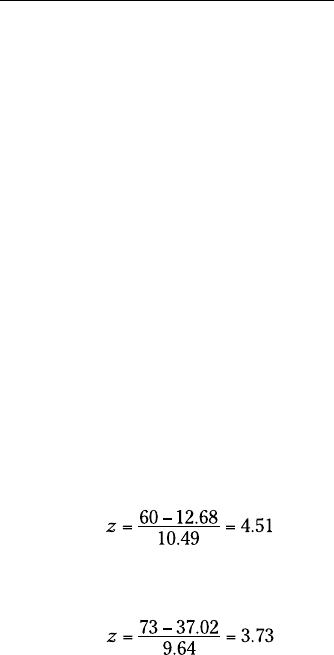
The average from 1927 is 12.68 homers with a standard deviation of 10.49.
The average from 2001 is 37.02 homers with a standard deviation of 9.64.
Although the means differ greatly, the standard deviations are pretty close.
And the z-scores? Ruth’s is
Bonds’s is
The clear winner in the z-score best-season home run derby is Babe Ruth.
Period.
Just to show you how times have changed, Lou Gehrig hit 47 home runs in
1927 (finishing second to Ruth) for a z-score of 3.27. In 2001, 47 home runs
amounted to a z-score of 1.04.
Exam scores
Getting away from sports debates, one practical application of z-scores is the
assignment of grades to exam scores. Based on percentage scoring, instruc-
tors traditionally evaluate a score of 90 points or higher (out of 100) as an A,
80–89 points as a B, 70–79 points as a C, 60–69 points as a D, and less than
60 points as an F. Then they average scores from several exams together to
assign a course grade.
11 454060-ch06.indd 11311 454060-ch06.indd 113 4/21/09 7:21:57 PM4/21/09 7:21:57 PM
114
Part II: Describing Data
Is that fair? Just as a peso from Argentina is worth more than a peso from Chile,
and a home run was harder to hit in 1927 than in 2001, is a point on one exam
worth the same as a “point” on another? Like peso, isn’t that just word magic?
Indeed it is. A point on a difficult exam is, by definition, harder to come by
than a point on an easy exam. Because points might not mean the same thing
from one exam to another, the fairest thing to do is convert scores from each
exam into z-scores before averaging them. That way, you’re averaging num-
bers on a level playing field.
In the courses I teach, I do just that. I often find that a lower numerical score
on one exam results in a higher z-score than a higher numerical score from
another exam. For example, on an exam where the mean is 65 and the stan-
dard deviation is 12, a score of 71 results in a z-score of .5. On another exam,
with a mean of 69 and a standard deviation of 14, a score of 75 is equivalent
to a z-score of .429. (Yes, it’s like Ruth’s 60 home runs versus Bonds’s 73.)
Moral of the story: Numbers in isolation tell you very little. You have to
understand the process that produces them.
STANDARDIZE
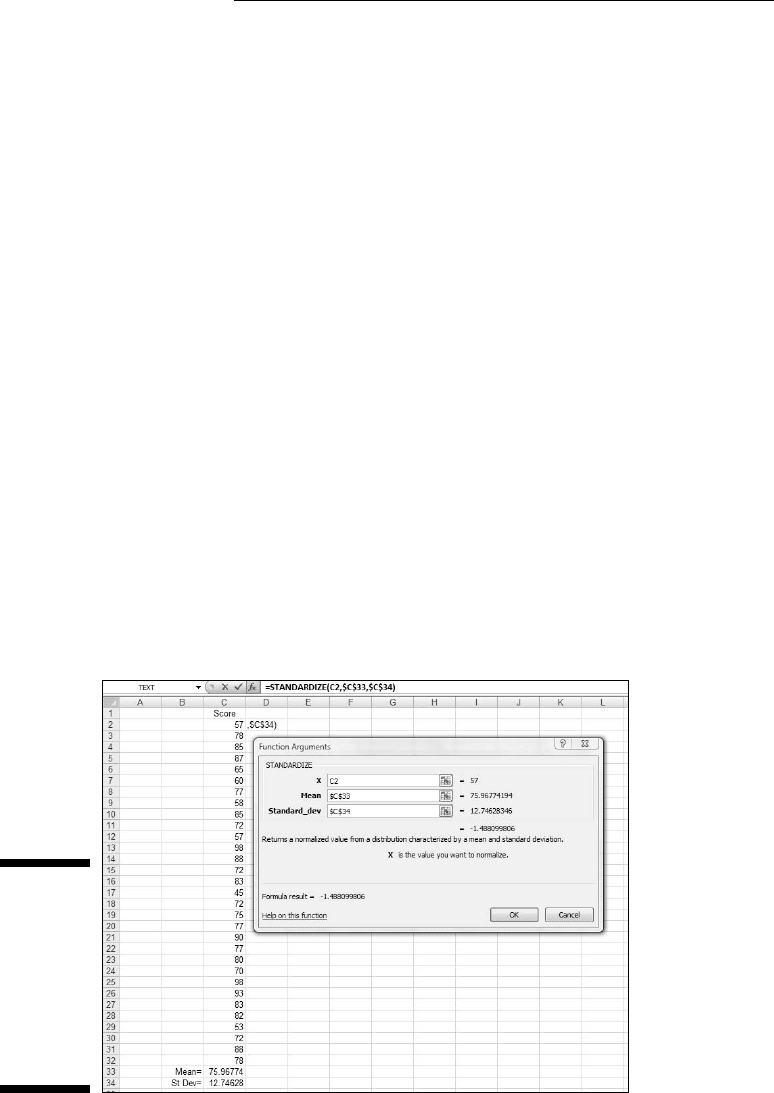
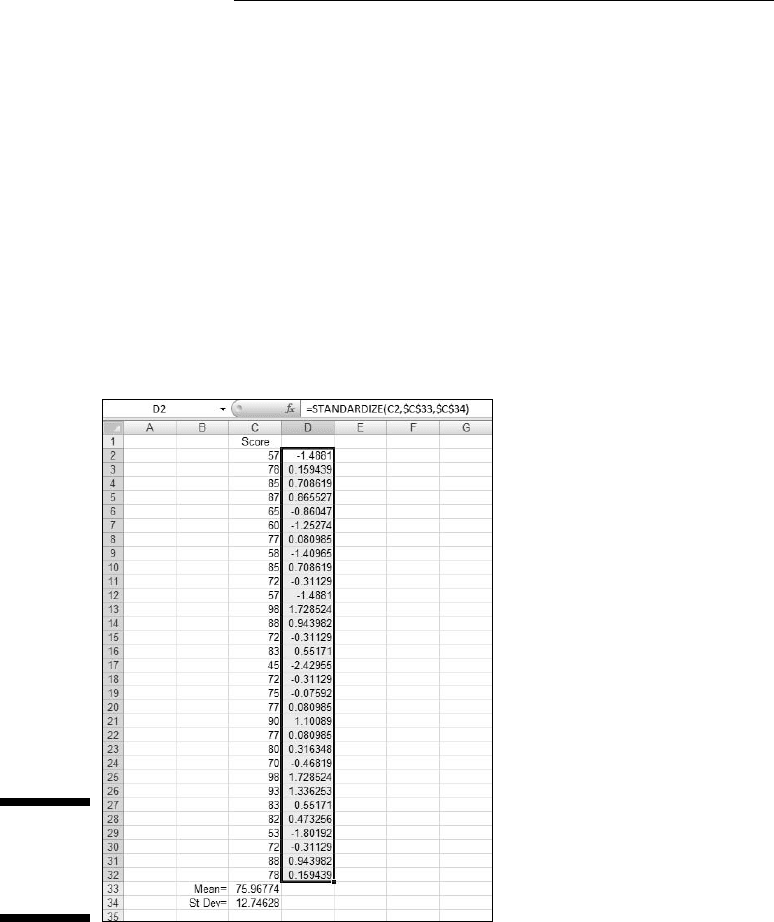
Excel’s STANDARDIZE worksheet function calculates z-scores. Figure 6-1
shows a set of exam scores along with their mean and standard devia-
tion. I used AVERAGE and STDEVP to calculate the statistics. The Function
Arguments dialog box for STANDARDIZE is also in the figure.
Figure 6-1:
Exam
scores and
the Function
Arguments
dialog
box for
STANDARD-
IZE.
11 454060-ch06.indd 11411 454060-ch06.indd 114 4/21/09 7:21:57 PM4/21/09 7:21:57 PM
115
Chapter 6: Meeting Standards and Standings
Here are the steps:
1. Enter the data into an array and select a cell.
The data are in C2:C32. I selected D2 to hold the z-score for the score
in C2. Ultimately, I’ll autofill column D and line up all the z-scores next to
the corresponding exam scores.
2. From the Statistical Functions menu, select STANDARDIZE to open the
Function Arguments dialog box for STANDARDIZE.
3. In the Function Arguments dialog box, enter the appropriate values
for the arguments.
First, I entered the cell that holds the first exam score into the X box. In
this example, that’s D2.
In the Mean box, I entered the cell that holds the mean — C33 for this
example. It has to be in absolute reference format, so the entry is $C$33.
Caching some z’s
Because negative z-scores might have con-
notations that are, well, negative, educators
sometimes change the z-score when they
evaluate students. In effect, they’re hiding the
z-score, but the concept is the same — stan-
dardization with the standard deviation as the
unit of measure.
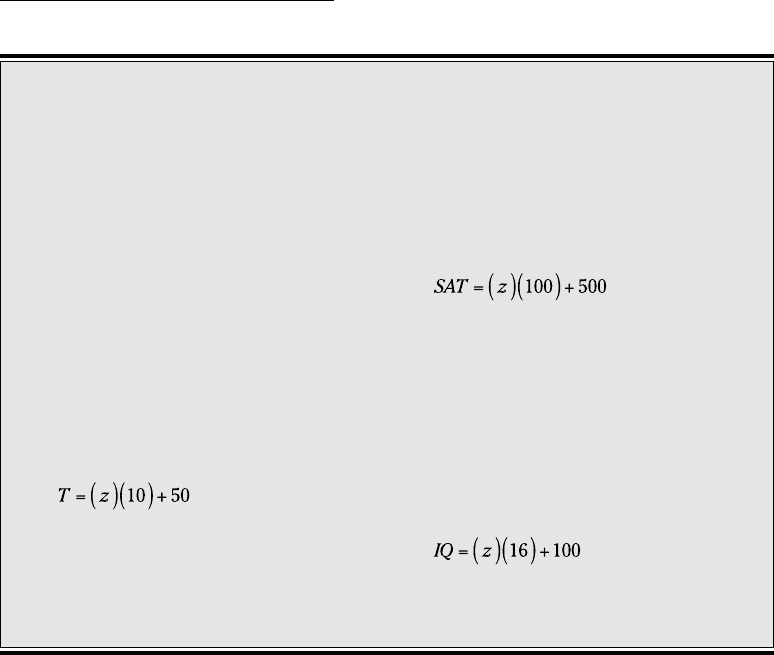
One popular transformation is called the
T-score. The T-score eliminates negative
scores because a set of T-scores has a mean
of 50 and a standard deviation of 10. The idea
is to give an exam, grade all the tests, and cal-
culate the mean and standard deviation. Next,
turn each score into a z-score. Then follow this
formula:
People who use the T-score often like to round
to the nearest whole number.
SAT scores are another transformation of the
z-score. (Some refer to the SAT as a C-score.)
The SAT has a mean of 500 and a standard devi-
ation of 100. After the exams are graded, and
their mean and standard deviation calculated,
each exam score becomes a z-score in the
usual way. This formula converts the z-score
into a SAT score:
Rounding to the nearest whole number is part of
the procedure here, too.
The IQ score is still another transformed z. Its
mean is 100 and (in the Stanford-Binet version)
its standard deviation is 16. What’s the proce-
dure for computing an IQ score? You guessed
it. In a group of IQ scores, calculate the mean
and standard deviation, and then calculate the
z-score. Then it’s
As with the other two, IQ scores are rounded to
the nearest whole number.
11 454060-ch06.indd 11511 454060-ch06.indd 115 4/21/09 7:21:58 PM4/21/09 7:21:58 PM
116
Part II: Describing Data
You can type it that way, or you select C33 and then highlight the Mean
box and press the F4 key.
In the Standard_dev box, I entered the cell that holds the standard devi-
ation. The appropriate cell in this example is C34. This also has to be in
absolute reference format, so the entry is $C$34.
4. Click OK to close the Function Arguments dialog box and put the
z-score for the first exam score into the selected cell.
To finish up, I positioned the cursor on the selected cell’s autofill handle,
hold the left mouse button down, and drag the cursor to autofill the remain-
ing z-scores.
Figure 6-2 shows the autofilled array of z-scores.
Figure 6-2:
The auto-
filled array
of z-scores.
Where Do You Stand?
Standard scores are designed to show you how a score stands in relation to
other scores in the same group. To do this, they use the standard deviation
as a unit of measure.
11 454060-ch06.indd 11611 454060-ch06.indd 116 4/21/09 7:21:58 PM4/21/09 7:21:58 PM
117
Chapter 6: Meeting Standards and Standings
If you don’t want to use the standard deviation, you can show a score’s rela-
tive standing in a simpler way. You can determine the score’s rank within the
group: The highest score has a rank of 1, the second highest has a rank of 2,
and so on.
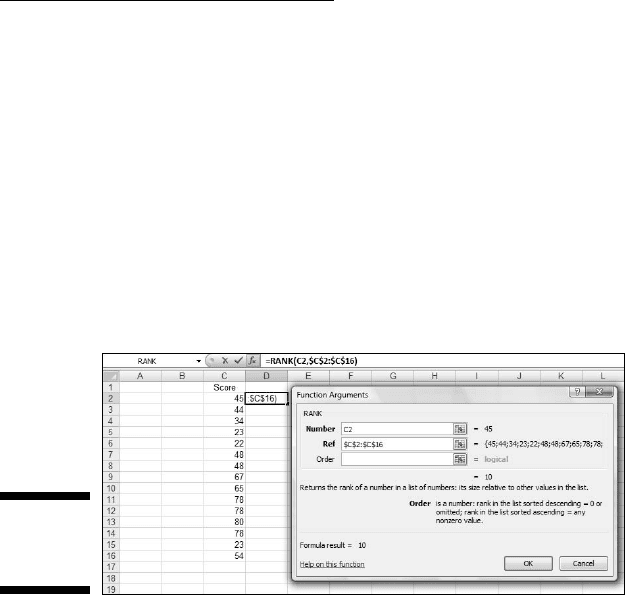
RANK
With Excel’s RANK function you can quickly determine the ranks of all the
scores in a group. Figure 6-3 shows the Function Arguments dialog box for
RANK along with a group of scores. I’ve also set up a column for the ranks.
Figure 6-3:
Working
with RANK.
Here are the steps for using RANK:
1. Enter the data into an array and select a cell.
For this example, I entered the scores into cells C2 through C16, and
selected cell D2.
2. From the Statistical Functions menu select RANK to open the Function
Arguments dialog box for RANK.
3. In the Function Arguments dialog box, type the appropriate values for
the arguments.
In the Number box, I entered the cell that holds the score whose rank I
want to insert into the selected cell. For this example, that’s C2.
In the Ref box, I entered the array that contains the scores. I enter
C2:C16 into the Ref box.
This part is important. After I insert RANK into D2 I’m going to drag the
cursor through column D and autofill the ranks of the remaining scores.
To set up for this, I have to let Excel know I want C2 through C16 to be
the array for every score, not just the first one.
11 454060-ch06.indd 11711 454060-ch06.indd 117 4/21/09 7:21:58 PM4/21/09 7:21:58 PM
118
Part II: Describing Data
That means the array in the Ref box has to look like this: $C$2:$C$16. I
can either add the $-signs manually, or highlight the Ref box and then
press the F4 key.
In the Order box, I indicate the order for sorting the scores. To rank the
scores in descending order, I can either leave the Order box alone or
type 0 (zero) into that box. To rank the scores in ascending order, I type
a non-zero value into the Order box. I left this box alone.
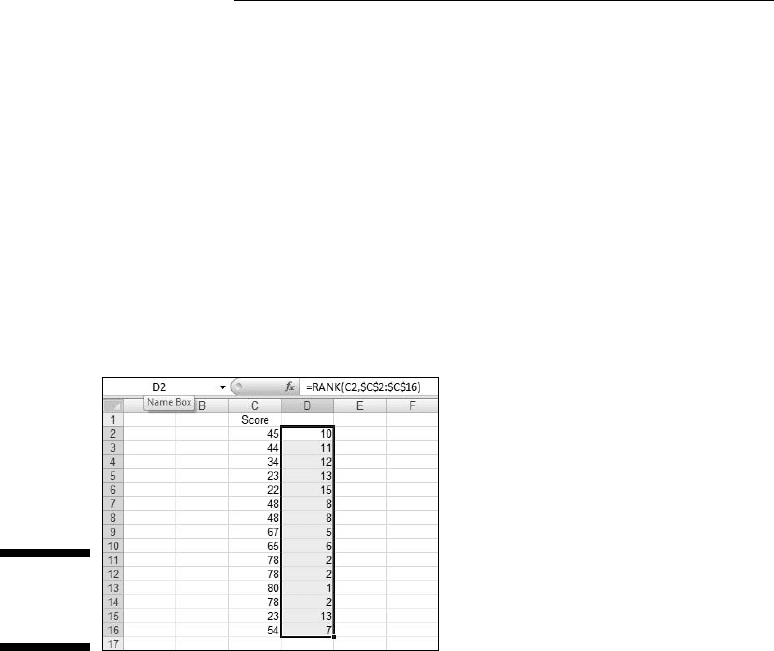
4. Click OK to put the rank into the selected cell.
I then position the cursor on the selected cell’s autofill handle, hold the left
mouse button down, and drag the cursor to autofill the ranks of the remain-
ing scores. (See Figure 6-4.)
Figure 6-4:
The auto-
filled ranks.
LARGE and SMALL
You can turn the ranking process inside out by supplying a rank and asking
which score has that rank. The worksheet functions LARGE and SMALL
handle this from either end. They tell you the fifth largest score or the third
smallest score, or any other rank you’re interested in.
Figure 6-5 shows the Function Arguments dialog box for LARGE. In the Array
box you enter the array of cells that holds the group of scores. In the K box
you enter the position whose value you want to find. To find the seventh larg-
est score in the array, for example, type 7 into the K box.
SMALL does the same thing, except it finds score positions from the lower
end of the group. The Function Arguments dialog box for SMALL also has an
Array box and a K box. Entering 7 in this K box returns the seventh lowest
score in the array.
11 454060-ch06.indd 11811 454060-ch06.indd 118 4/21/09 7:21:58 PM4/21/09 7:21:58 PM