Schmuller J. Statistical Analysis with Excel For Dummies
Подождите немного. Документ загружается.

119
Chapter 6: Meeting Standards and Standings
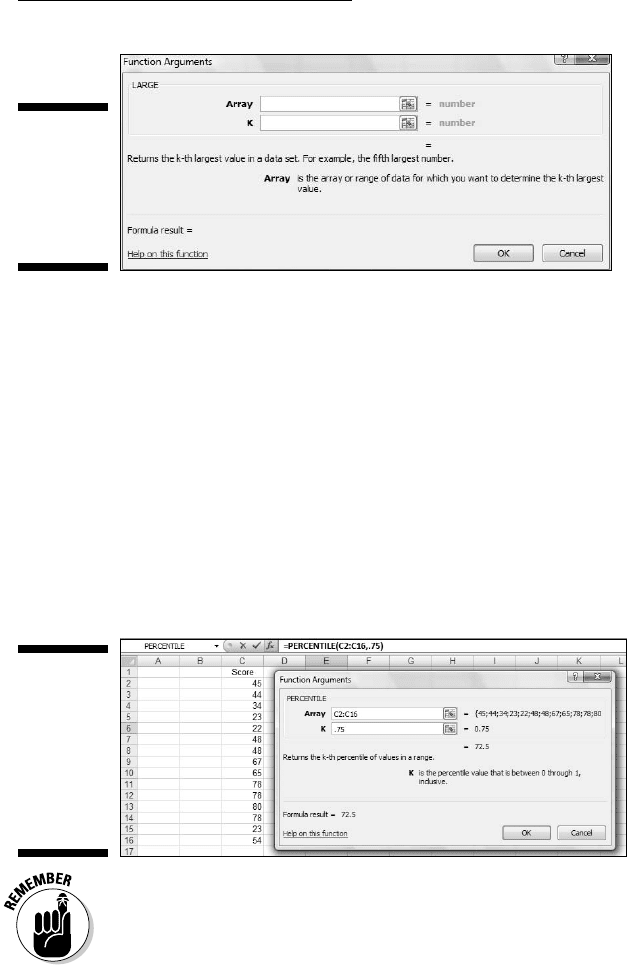
Figure 6-5:
The
Function
Arguments
dialog box
for LARGE.
PERCENTILE and PERCENTRANK
Closely related to rank is the percentile, which represents a score’s standing
in the group as the percent of scores below it. If you’ve taken standardized
tests like the SAT, you’ve encountered percentiles. An SAT score in the 80th
percentile is higher than 80 percent of the other SAT scores.
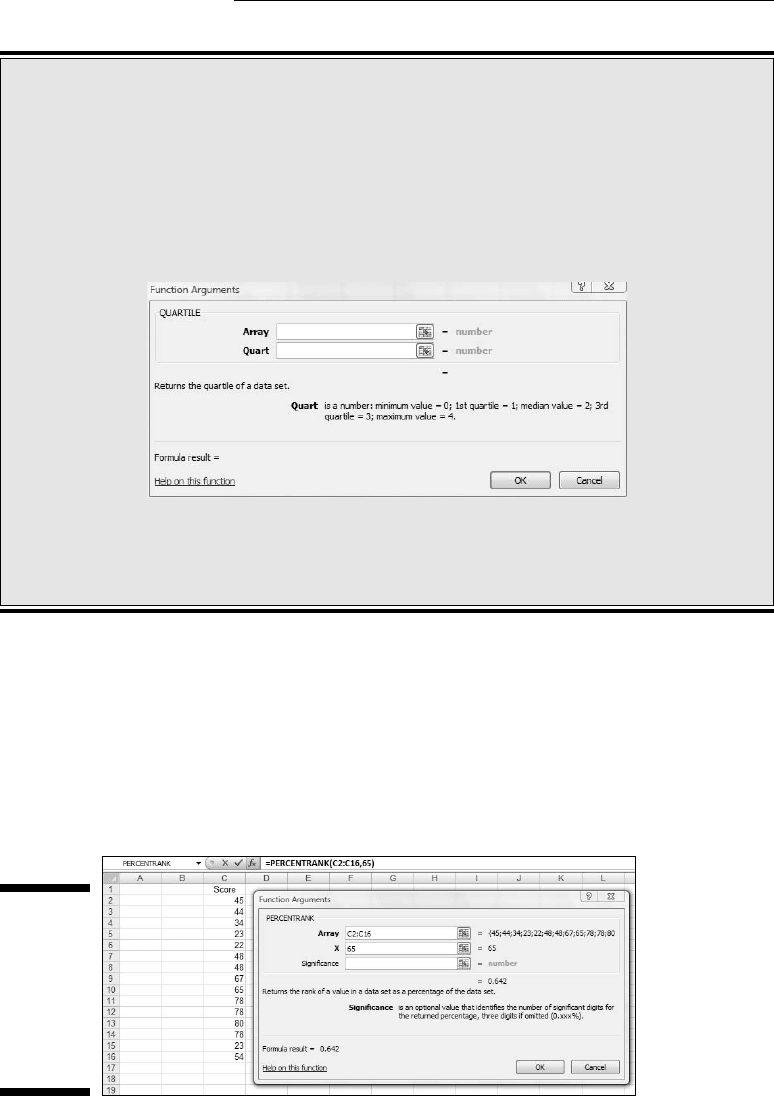
Excel’s PERCENTILE function enables you to find the value at any percentile.
Figure 6-6 shows the Function Arguments dialog box PERCENTILE. The dialog
box shows the 75th percentile (the value that’s greater than 75 percent of
the scores) for the numbers in cells C2 through C16. In this example, the 75th
percentile is 72.5.
Figure 6-6:
The
Function
Arguments
dialog
box for
PERCENT-
ILE.
In the PERCENTILE dialog box, you enter the percentile into the K box. Enter it
as a decimal, so that the 75th percentile is .75.
11 454060-ch06.indd 11911 454060-ch06.indd 119 4/21/09 7:21:59 PM4/21/09 7:21:59 PM
120
Part II: Describing Data
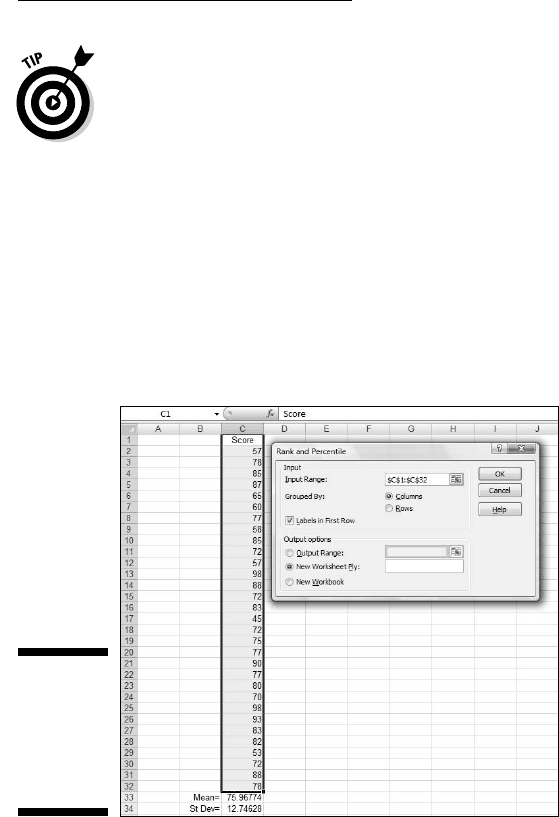
In contrast to percentiles, you might be interested in the flip side: Given a
value, what percent of scores falls below it? PERCENTRANK handles this. In
Figure 6-7 the Function Arguments dialog box for PERCENTRANK shows the
percent rank of 65 for the scores in cells C2 through C16. (It’s 0.642, or 64.2
percent.) The Array box holds the array of cells and the X box holds the score
(65). The Significance box is optional: You can enter the amount of significant
figures in which you would like the answer to appear, or you can leave it blank.
Figure 6-7:
The
Function
Arguments
dialog
box for
PERCENT-
RANK.
Drawn and quartiled
A few specific percentiles are often used to
summarize a group of scores. The median—
the 50th percentile (because it’s higher than 50
percent of the scores) — is one of them. Three
others are the 25th percentile, the 75th and the
100th percentile (the maximum score). Because
they divide a group of scores into fourths, these
particular four percentiles are called quartiles.
Excel’s QUARTILE function calculates them.
Selecting QUARTILE from the Insert Function
dialog box opens the QUARTILE dialog box
shown in the figure.
The trick is to enter the right kind of numbers
into the Quart box — 1 for the 25th percentile,
2 for the 50th, 3 for the 75th, and 4 for the 100th.
Entering 0 into the Quart box gives you the
lowest score in the group.
11 454060-ch06.indd 12011 454060-ch06.indd 120 4/21/09 7:21:59 PM4/21/09 7:21:59 PM
121
Chapter 6: Meeting Standards and Standings
For the X box, you can enter either the value of a score or the label of the
cell in which it appears. In this example, C10 in the X box gives you the same
result as putting 65 in the X box.
Data analysis tool: Rank and Percentile
As the name of this section indicates, Excel provides a data analysis tool
that calculates ranks and percentiles of each score in a group. The Rank and
Percentiles tool calculates both at the same time, so it saves you some steps
versus using the separate worksheet functions. (See Chapter 2 to install
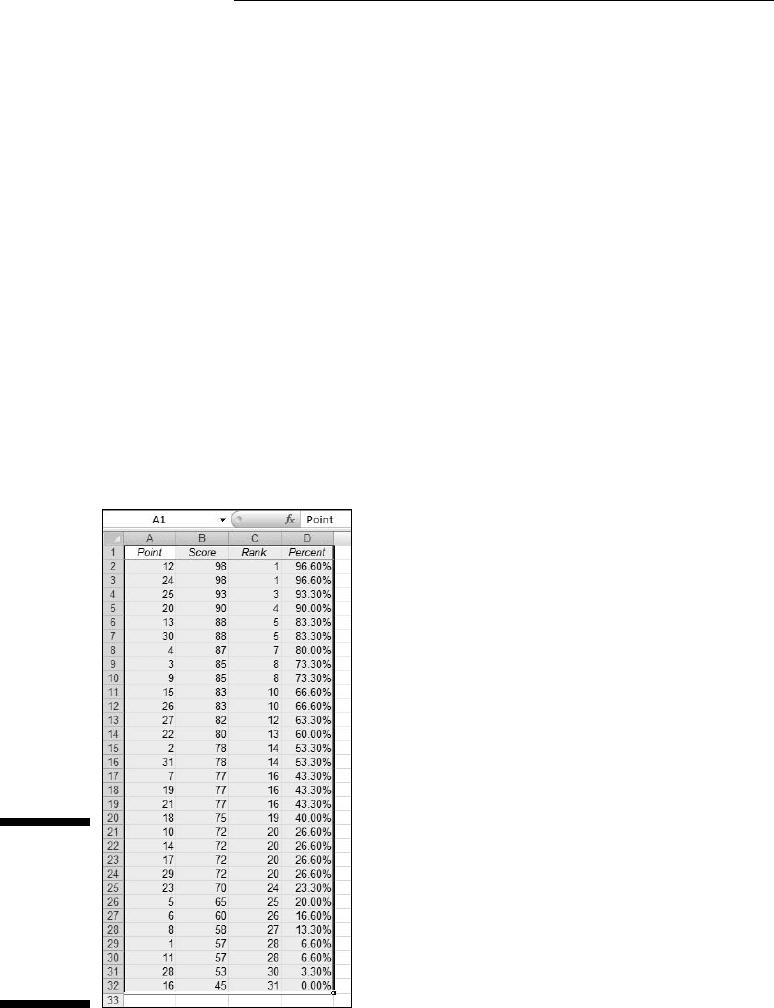
Excel’s data analysis tools.) In Figure 6-8, I take the exam scores from the
z-score example and open the Rank and Percentile dialog box.
Figure 6-8:
The Rank
and
Percentile
analysis
tool.
Here are the steps for using Rank and Percentile:
1. Type your data into an array.
In this example, the data are in cells C2 through C32.
2. In the Tools menu, choose Data Analysis to open the Data Analysis
dialog box.
3. In the Data Analysis dialog box, select Rank and Percentile.
4. Click OK to open the Rank and Percentile dialog box.
11 454060-ch06.indd 12111 454060-ch06.indd 121 4/21/09 7:21:59 PM4/21/09 7:21:59 PM
122
Part II: Describing Data
5. In the Rank and Percentile dialog box, enter the data array into the
Input Range box. Make sure that it’s in absolute reference format.
In this example, a label is in the first row (in cell C1). I want the label
included in the output, so I enter $C$1:$C$32 in the Input Range box,
and I check the Labels in First Row checkbox.
6. Click the Columns radio button to indicate that the data are organized
by columns.
7. Click the New Ply radio button to create a new tabbed page in the
worksheet, and to send the results to the newly created page.
8. Click OK to close the dialog box. Open the newly created page to see
the results.
Figure 6-9 shows the new page with the results. The table orders the scores
from highest to lowest, as the Score column shows along with the Rank
column. The Point column tells you the score’s position in the original group-
ing. For example, the 98 in cell B2 is the 12th score in the original data. The
Percent column gives the percentile for each score.
Figure 6-9:
The Output
of the
Rank and
Percentile
analysis
tool.
11 454060-ch06.indd 12211 454060-ch06.indd 122 4/21/09 7:21:59 PM4/21/09 7:21:59 PM

Chapter 7
Summarizing It All
In This Chapter
▶ Things great and small
▶ Symmetry, peaks, and plateaus
▶ Getting descriptive
▶ Statistics served up on a tray
M
easures of central tendency and variability are excellent ways of sum-
marizing a set of scores. They aren’t the only ways. Central tendency
and variability make up a subset of descriptive statistics. Some descriptive
statistics are intuitive — like count, maximum, and minimum. Some are not —
like skewness and kurtosis.
In this chapter, I discuss descriptive statistics, and I show you Excel’s capa-
bilities for calculating them and visualizing them.
Counting Out
The most fundamental descriptive statistic I can imagine is the number of
scores in a set of scores. Excel offers five ways to determine that number.
Yes, five ways. Count them.
COUNT, COUNTA, COUNTBLANK,
COUNTIF, COUNTIFS
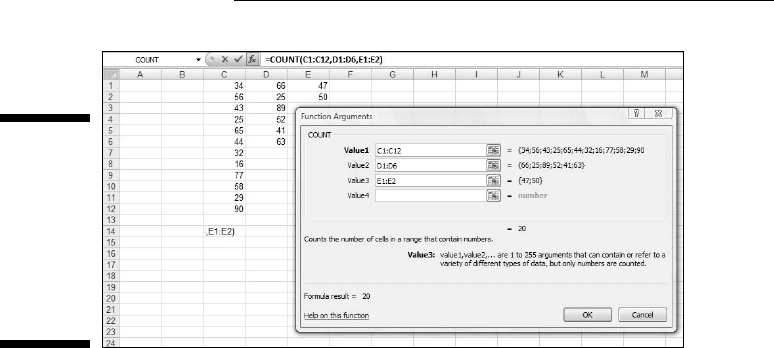
Given an array of cells, COUNT gives you the amount of those cells that
contain numerical data. Figure 7-1 shows that I’ve entered a group of scores,
selected a cell to hold COUNT’s result, and opened the Function Arguments
dialog box for COUNT. Here are the steps:
12 454060-ch07.indd 12312 454060-ch07.indd 123 4/21/09 7:22:37 PM4/21/09 7:22:37 PM
124
Part II: Describing Data
Figure 7-1:
The
Function
Arguments
Dialog Box
for COUNT,
showing
multiple
arguments.
1. Enter your data into the worksheet and select a cell for the result.
I entered data into columns C, D, and E to show off COUNT’s multi-argu-
ment capability. I selected cell C14 to hold the count.
2. From the Statistical Functions menu, select COUNT and click OK to
open the Function Arguments dialog box for COUNT.
3. In the Function Arguments dialog box, enter the appropriate values
for the arguments.
In the Number1 box I entered one of the data columns for this example,
like C1:C12.
I clicked in the Number2 box and entered another data column. I entered
D1:D6.
I clicked in the Number3 box and entered the last column, which in this
example is E1:E2.
4. Click OK to put the result in the selected cell.
COUNTA works like COUNT, except that its tally includes cells that contain
text and logical values in its tally.
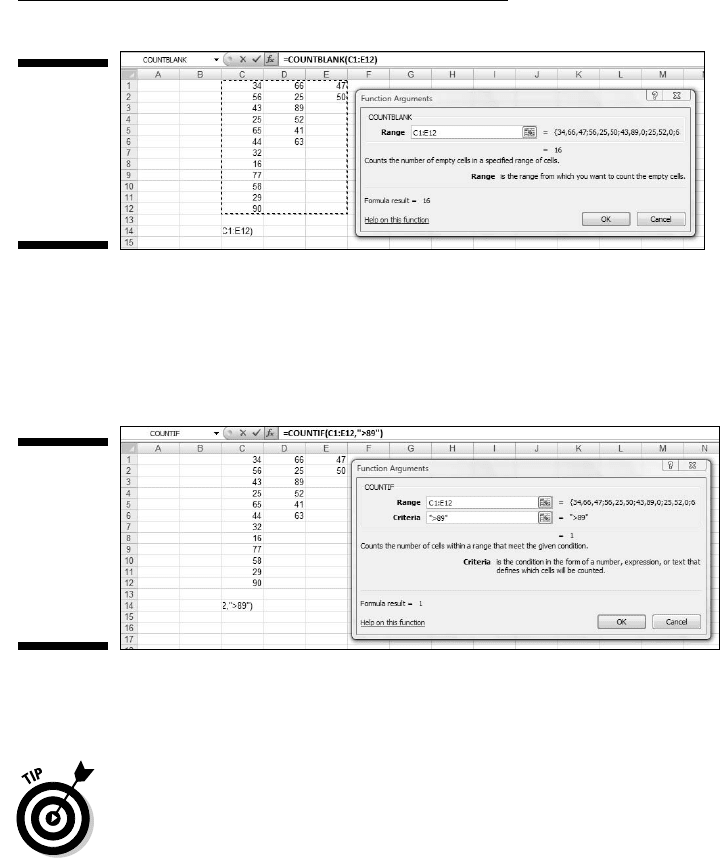
COUNTBLANK counts the number of blank cells in an array. In Figure 7-2,
I use the numbers from the preceding example, but I extend the array to
include cells D7 through D12 and E3 through E12. The array in the Range box
is C1:E12. The Argument Functions dialog box for COUNTBLANK shows the
number of blank cells (16 for this example).
12 454060-ch07.indd 12412 454060-ch07.indd 124 4/21/09 7:22:38 PM4/21/09 7:22:38 PM
125
Chapter 7: Summarizing It All
Figure 7-2:
COUNT
BLANK
tallies the
blank cells
in a speci-
fied array.
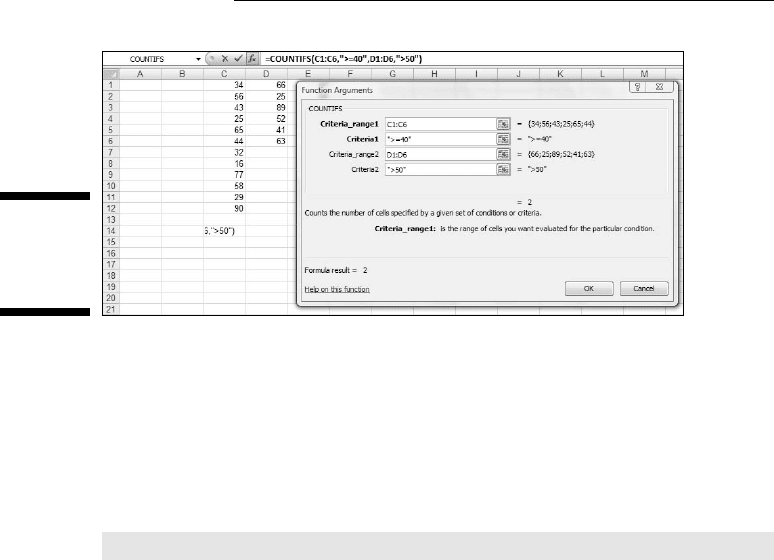
COUNTIF shows the number of cells whose value meets a specified crite-
rion. Figure 7-3 reuses the data once again, showing the Arguments Function
dialog box for COUNTIF. Although the range is C1:E12, COUNTIF doesn’t
include blank cells.
Figure 7-3:
COUNTIF
tallies the
amount of
cells whose
data meet
a specified
criterion.
The criterion I used, >= 89, tells COUNTIF to count only the cells whose
values are greater than or equal to 89. For this example, that count is 1.
This probably won’t make much difference as you use this function, but a
little quirk of Excel shows up here. If you put double quotes around the cri-
terion, the result appears in the dialog box before you click OK. If you don’t,
it doesn’t. If you click OK without quoting, Excel supplies the quotes and the
result appears in the selected cell, and Excel applies the quotes.
COUNTIFS is new in Excel 2007. This function can use multiple criteria to
determine the count. If the criteria come from two arrays, they must have
the same number of cells. This is because COUNTIFS counts pairs of cells. It
includes a pair of cells in the count if one of the cells meets a criterion and
the other meets a criterion. Take a look at Figure 7-4.
12 454060-ch07.indd 12512 454060-ch07.indd 125 4/21/09 7:22:38 PM4/21/09 7:22:38 PM
126
Part II: Describing Data
Figure 7-4:
Working
with
COUNTIFS.
In this example, COUNTIFS operates in C1:C6 and D1:D6. The criterion for the
cells in column C is >=40. The criterion for the cells in column D is >50. This
means that COUNTIFS counts cell-pairs whose C cell holds a value greater
than or equal to 40 and whose D cell holds a value greater than 50. Only two
cell-pairs meet these conditions, as the dialog box shows.
You can use a cell range more than once in COUNTIFS. For example
=COUNTIFS(C1:C12,”>30”,C1:C12,”<60”)
gives the number of cells in which the value is between 30 and 60 (not includ-
ing 30 and 60).
The Long and Short of It
Two more descriptive statistics that probably require no introduction are the
maximum and the minimum. These, of course, are the largest value and the
smallest value in a group of scores.
MAX, MAXA, MIN, and MINA
Excel has worksheet functions that determine a group’s largest and smallest
values. I show you what MAX is all about. The others work in a similar fashion.
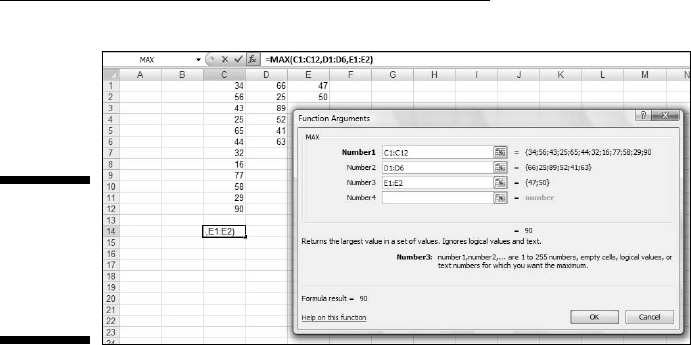
Figure 7-5 reuses the scores from the preceding examples. I selected a cell to
hold their maximum value, and opened the Function Arguments dialog box
for MAX. Here are the steps:
12 454060-ch07.indd 12612 454060-ch07.indd 126 4/21/09 7:22:38 PM4/21/09 7:22:38 PM
127
Chapter 7: Summarizing It All
Figure 7-5:
The
Function
Arguments
dialog box
for MAX.
1. Type your data into the worksheet and select a cell to hold the result.
I entered data into columns C, D, and E to show off MAX’s multi-argu-
ment capability. For this example, I selected cell C14.
2. From the Statistical Functions menu select MAX to open the Function
Arguments dialog box for MAX.
3. In the Function Arguments dialog box, enter the appropriate values
for the arguments.
In the Number1 box, I entered one of the data columns, C1:C12.
Clicking the Number2 box creates and opens the Number3 box. In the
Number2 box, I entered another array, D1:D6.
I clicked in the Number3 box and entered the last array, E1:E2.
4. Click OK to put the result in the selected cell.
MAX ignores any text or logical values it encounters along the way. MAXA
takes text and logical values into account when it finds the maximum. If
MAXA encounters the logical value TRUE, it converts that value to 1. MAXA
converts FALSE, or any text other than “TRUE”, to 0.
MIN and MINA work the same way as MAX and MAXA, except that they find
the minimum rather than the maximum. Take care when you use MINA,
because the conversions of logical values and text to 0 and 1 influence the
result. With the numbers in the preceding example, the minimum is 22. If you
enter FALSE or other text into a cell in any of the arrays, MINA gives 0 as the
minimum. If you enter TRUE, MINA gives 1 as the minimum.
12 454060-ch07.indd 12712 454060-ch07.indd 127 4/21/09 7:22:38 PM4/21/09 7:22:38 PM

128
Part II: Describing Data
Getting Esoteric
In this section, I discuss some little-used statistics that are related to the
mean and the variance. For most people, the mean and the variance are
enough to describe a set of data. These other statistics, skewness and kurto-
sis, go just a bit further. You might use them someday if you have a huge set
of data and you want to provide some in-depth description.
Think of the mean as locating a group of scores by showing you where their
center is. This is the starting point for the other statistics. With respect to the
mean
✓ The variance tells you how spread out the scores are.
✓ Skewness indicates how symmetrically the scores are distributed.
✓ Kurtosis shows you whether or not your scores are distributed with a
peak in the neighborhood of the mean.
Skewness and kurtosis are related to the mean and variance in fairly involved
mathematical ways. The variance involves the sum of squared deviations
of scores around the mean. Skewness depends on cubing the deviations
around the mean before you add them all up. Kurtosis takes it all to a higher
power — the fourth power, to be exact. I get more specific in the subsections
that follow.
SKEW
Figure 7-6 shows three histograms. The first is symmetric, the other two are
not. The symmetry and the asymmetry are reflected in the skewness statistic.
For the symmetric histogram, the skewness is 0. For the second histogram —
the one that tails off to the right — the value of the skewness statistic is posi-
tive. It’s also said to be skewed to the right. For the third histogram (which
tails off to the left), the value of the skewness statistic is negative. It’s also
said to be skewed to the left.
Where do zero, positive, and negative skew come from? They come from this
formula:
In the formula, is the mean of the scores, N is the number of scores, and s
is the standard deviation.
12 454060-ch07.indd 12812 454060-ch07.indd 128 4/21/09 7:22:39 PM4/21/09 7:22:39 PM