Schmuller J. Statistical Analysis with Excel For Dummies
Подождите немного. Документ загружается.

149
Chapter 8: What’s Normal?
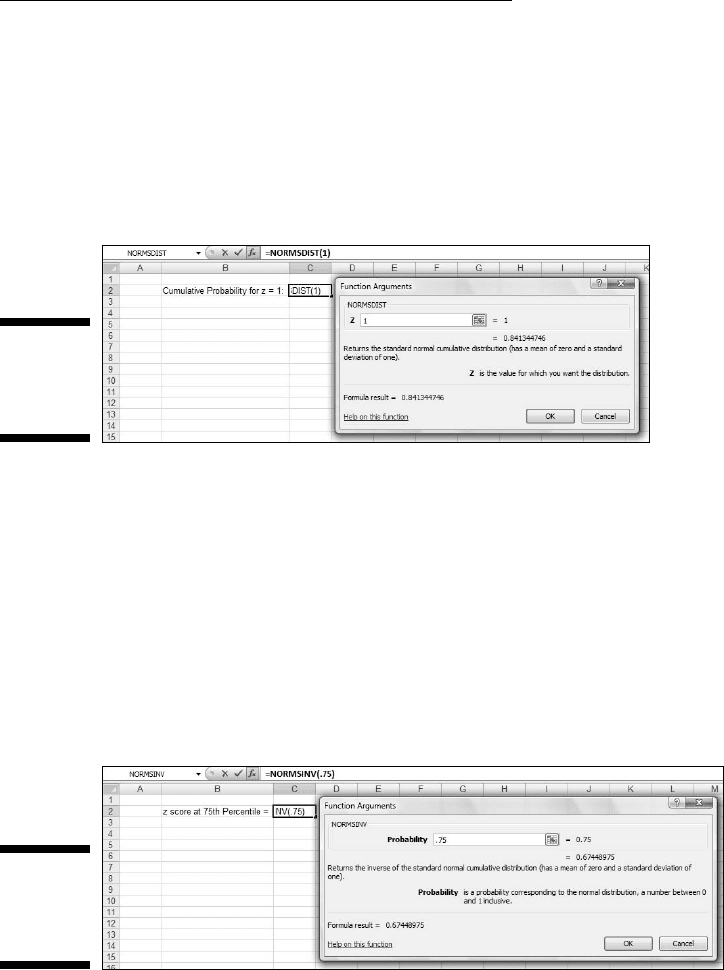
You supply a z-score and it returns the area to the left of the z-score — the
probability that a z-score is less than or equal to the one you supplied.
Figure 8-6 shows the Function Arguments dialog box with 1 as the z-score.
The dialog box presents .841344746, the probability that a z-score is less
than or equal to 1.00 in a standard normal distribution. Clicking OK puts that
result into a selected cell.
Figure 8-6:
Working
with
NORMSDIST.
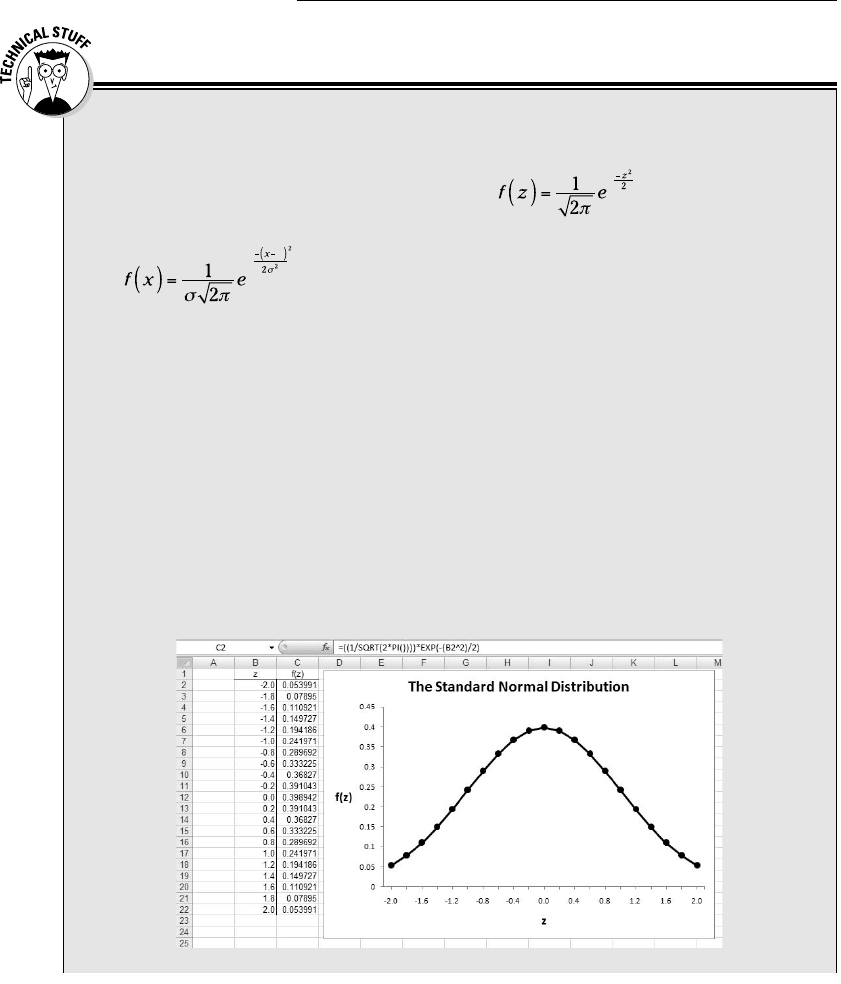
NORMSINV
NORSMINV is the flip side of NORMSDIST. You supply a cumulative probabil-
ity and NORMSINV returns the z-score that cuts off the cumulative probabil-
ity. For example, if you supply .5000, NORMSINV returns 0, the mean of the
standard normal distribution.
Figure 8-7 shows the Function Arguments dialog box for NORMSINV, with .75
as the cumulative probability. The dialog box shows the answer, .67448975,
the z-score at the 75th percentile of the standard normal distribution.
Figure 8-7:
Working
with
NORMSIVV
13 454060-ch08.indd 14913 454060-ch08.indd 149 4/21/09 7:27:34 PM4/21/09 7:27:34 PM
150
Part II: Describing Data
Okay, just because you asked . . .
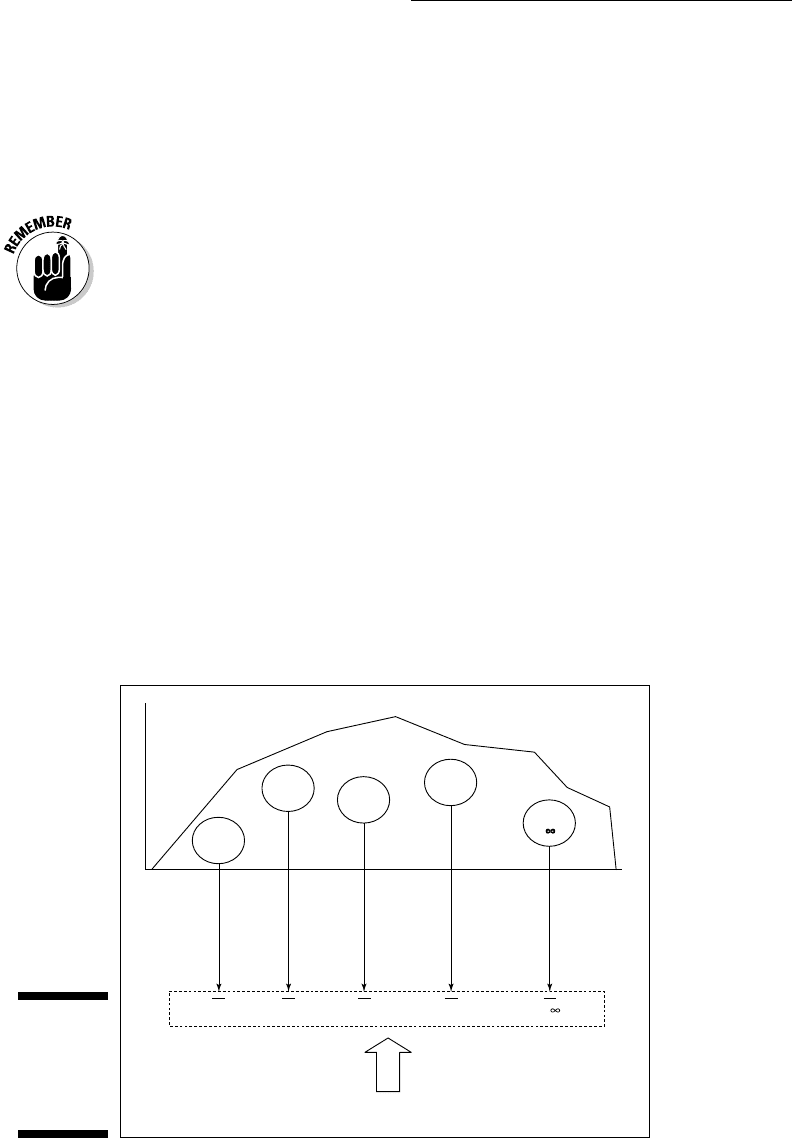
The relationship between x and f(x) for the
normal distribution is, as I mention, a pretty
complex one. Here’s the equation:
If you supply values for μ (the mean), σ (the stan-
dard deviation), and x (a score), the equation
gives you back a value for f(x), the height of the
normal distribution at x. π and e are important
constants in mathematics. π is approximately
3.1416 (the ratio of a circle’s circumference to its
diameter). e is approximately 2.71828. It’s related
to something called natural logarithms and to a
variety of other mathematical concepts. (I tell
you more about e in Chapter 20.)
In a standard normal distribution, μ = 0 and
σ = 1, so the equation becomes
I changed the x to z because you deal with
z-scores in this member of the normal distribu-
tion family.
In Excel, you can set up a range of cells that
contain standard scores, create a formula that
captures the preceding equation, and autofill
another range of cells with the formula results.
Next, select the range with the formula results.
Then you can select
Insert | Line
from the Chart area on the Ribbon and choose
the Line with Markers layout. (See Chapter 2.)
As the accompanying figure shows, this layout
nicely traces out the standard normal distri-
bution. The figure also shows the autofilled
values.
13 454060-ch08.indd 15013 454060-ch08.indd 150 4/21/09 7:27:34 PM4/21/09 7:27:34 PM

151
Chapter 8: What’s Normal?
The Formula Bar shows the Excel formula
that corresponds to the normal distribution
equation:
=((1/SQRT(2*PI())))*
EXP(-(B2^2)/2)
PI() is an Excel function that gives the value
of π. The function EXP() raises e to the power
indicated by what’s in the parentheses that
follow it.
I show you all of this because I want you to
see the equation of the normal distribution as
an Excel formula. The NORMDIST worksheet
function offers a much easier way to supply the
f(z) values. Enter this formula into C2
=NORMDIST(B2,0,1,FALSE)
autofill column C and you have the same values
as in the figure.
13 454060-ch08.indd 15113 454060-ch08.indd 151 4/21/09 7:27:34 PM4/21/09 7:27:34 PM

152
Part II: Describing Data
13 454060-ch08.indd 15213 454060-ch08.indd 152 4/21/09 7:27:34 PM4/21/09 7:27:34 PM

Part III
Drawing
Conclusions
from Data
14 454060-pp03.indd 15314 454060-pp03.indd 153 4/21/09 7:28:12 PM4/21/09 7:28:12 PM

In this part . . .
P
art III deals with using statistical methods to make
inferences about data. This is all aimed at using the
data from samples to draw conclusions about popula-
tions, and it’s the essence of statistical analysis. I begin
with the extremely important concept of sampling distri-
butions. I move on to estimation and confidence limits
and then to statistical tests geared at one sample, two
samples, and more. Part III ends with discussions of
regression and correlation — the statistics of relationships.
The statistical methods in this part are computationally
intensive. Fortunately, Excel has specialized features
for doing the calculations. The seven chapters in this
part describe Excel functions and tools for inferential
statistics.
14 454060-pp03.indd 15414 454060-pp03.indd 154 4/21/09 7:28:13 PM4/21/09 7:28:13 PM

Chapter 9
The Confidence Game: Estimation
In This Chapter
▶ Introducing sampling distributions
▶ Understanding standard error
▶ Simulating the sampling distribution of the mean
▶ Attaching confidence limits to estimates
P
opulations and samples are pretty straightforward ideas. A popula-
tion is a huge collection of individuals, from which you draw a sample.
Assess the members of the sample on some trait or attribute, calculate statis-
tics that summarize that sample, and you’re in business.
In addition to summarizing the scores in the sample, you can use the sta-
tistics to create estimates of the population parameters. This is no small
accomplishment. On the basis of a small percentage of individuals from the
population, you can draw a picture of the population.
A question emerges, however: How much confidence can you have in the
estimates you create? In order to answer this, you have to have a context in
which to place your estimates. How probable are they? How likely is the true
value of a parameter to be within a particular lower bound and upper bound?
In this chapter, I introduce the context for estimates, show how that plays
into confidence in those estimates, and describe an Excel function that
enables you to calculate your confidence level.
What is a Sampling Distribution?
Imagine that you have a population, and you draw a sample from this popula-
tion. You measure the individuals of the sample on a particular attribute and
calculate the sample mean. Return the sample members to the population.
Draw another sample, assess the new sample’s members, and then calcu-
late their mean. Repeat this process again and again, always using the same
number of individuals as you had in the original sample. If you could do this
an infinite amount of times (with the same-size sample each time), you’d have
15 454060-ch09.indd 15515 454060-ch09.indd 155 4/21/09 7:28:41 PM4/21/09 7:28:41 PM
156
Part III: Drawing Conclusions from Data
an infinite amount of sample means. Those sample means form a distribution
of their own. This distribution is called the sampling distribution of the mean.
For a sample mean, this is the context I mention at the beginning of this chap-
ter. Like any other number, a statistic makes no sense by itself. You have to
know where it comes from in order to understand it. Of course, a statistic
comes from a calculation performed on sample data. In another sense, a sta-
tistic is part of a sampling distribution.
In general, a sampling distribution is the distribution of all possible values of a
statistic for a given sample size.
I italicize that definition for a reason: It’s extremely important. After many years
of teaching statistics, I can tell you that this concept usually sets the boundary
line between people who understand statistics and people who don’t.
So . . . if you understand what a sampling distribution is, you’ll understand what
the field of statistics is all about. If you don’t, you won’t. It’s almost that simple.
If you don’t know what a sampling distribution is, statistics will be a cook-
book type of subject for you: Whenever you have to apply statistics, you’ll
plug numbers into formulas and hope for the best. On the other hand, if
you’re comfortable with the idea of a sampling distribution, you’ll grasp the
big picture of inferential statistics.
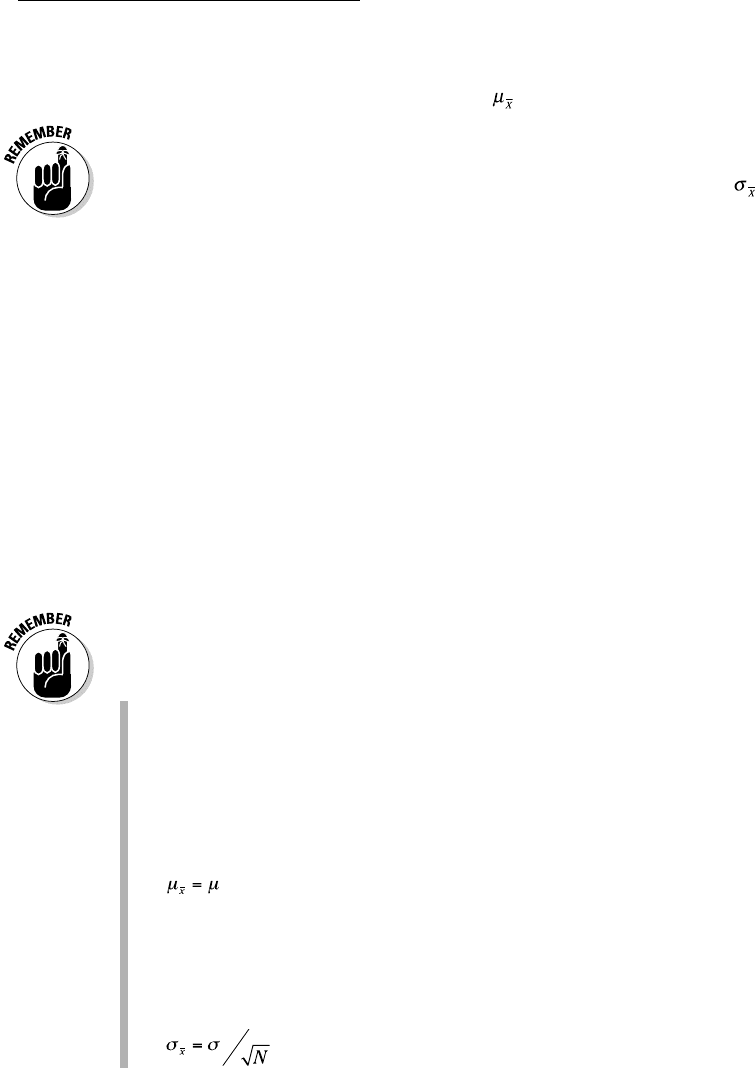
To help clarify the idea of a sampling distribution, take a look at Figure 9-1. It
summarizes the steps in creating a sampling distribution of the mean.
Figure 9-1:
The
sampling
distribution
of the mean.
Population
Sampling Distribution of the Mean
Sample
1
Sample
2
Sample
3
Sample
4
Sample
. . .
1
x
2
x
3
x
4
x x
. . .
15 454060-ch09.indd 15615 454060-ch09.indd 156 4/21/09 7:28:41 PM4/21/09 7:28:41 PM
157
Chapter 9: The Confidence Game: Estimation
A sampling distribution — like any other group of scores — has a mean and a
standard deviation. The symbol for the mean of the sampling distribution of
the mean (yes, I know that’s a mouthful) is
.
The standard deviation of a sampling distribution is a pretty hot item. It has a
special name — standard error. For the sampling distribution of the mean, the
standard deviation is called the standard error of the mean. Its symbol is
.
An EXTREMELY Important Idea:
The Central Limit Theorem
The situation I ask you to imagine is one that never happens in the real
world. You never take an infinite amount of samples and calculate their
means, and you never create a sampling distribution of the mean. Typically,
you draw one sample and calculate its statistics.
So if you have only one sample how can you ever know anything about a sam-
pling distribution — a theoretical distribution that encompasses an infinite
number of samples? Is this all just a wild-goose chase?
No, it’s not. You can figure out a lot about a sampling distribution because of
a great gift from mathematicians to the field of statistics. This gift is called the
Central Limit Theorem.
According to the Central Limit Theorem
✓ The sampling distribution of the mean is approximately a normal distri-
bution if the sample size is large enough.
Large enough means about 30 or more.
✓ The mean of the sampling distribution of the mean is the same as the
population mean.
In equation form that’s
✓ The standard deviation of the sampling distribution of the mean (also
known as the standard error of the mean) is equal to the population
standard deviation divided by the square root of the sample size.
The equation here is
Notice that the Central Limit theorem says nothing about the population. All
it says is that if the sample size is large enough, the sampling distribution of
15 454060-ch09.indd 15715 454060-ch09.indd 157 4/21/09 7:28:41 PM4/21/09 7:28:41 PM
158
Part III: Drawing Conclusions from Data
the mean is a normal distribution, with the indicated parameters. The popu-
lation that supplies the samples doesn’t have to be a normal distribution for
the Central Limit Theorem to hold.
What if the population is a normal distribution? In that case, the sampling dis-
tribution of the mean is a normal distribution regardless of the sample size.
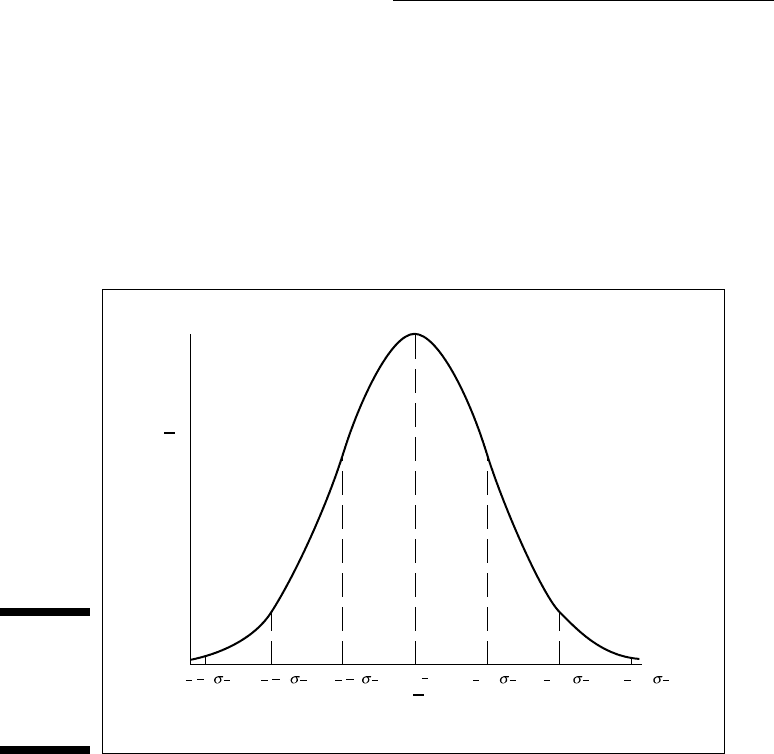
Figure 9-2 shows a general picture of the sampling distribution of the mean,
partitioned into standard error units.
Figure 9-2:
The
sampling
distribution
of the mean.
f(x)
x
x
µ
1
xx
µ
+
2
xx
µ
+
3
xx
µ
+
1
xx
µ
2
xx
µ
3
xx
µ
Simulating the Central Limit Theorem
It almost doesn’t sound right. How can a population that’s not normally dis-
tributed result in a normally distributed sampling distribution?
To give you an idea of how the Central Limit Theorem works, I created a
simulation. This simulation creates something like a sampling distribution of
the mean for a very small sample, based on a population that’s not normally
distributed. As you’ll see, even though the population is not a normal distri-
bution, and even though the sample is small, the sampling distribution of the
mean looks quite a bit like a normal distribution.
15 454060-ch09.indd 15815 454060-ch09.indd 158 4/21/09 7:28:42 PM4/21/09 7:28:42 PM