Schmuller J. Statistical Analysis with Excel For Dummies
Подождите немного. Документ загружается.

199
Chapter 11: Two-Sample Hypothesis Testing
Data Analysis Tools: t-test: Two Sample
Excel provides data analysis tools that carry out t-tests. One tool works for
the equal variance cases, another for the unequal variances case. As you’ll
see, when you use these tools you end up with more information than TTEST
gives you.
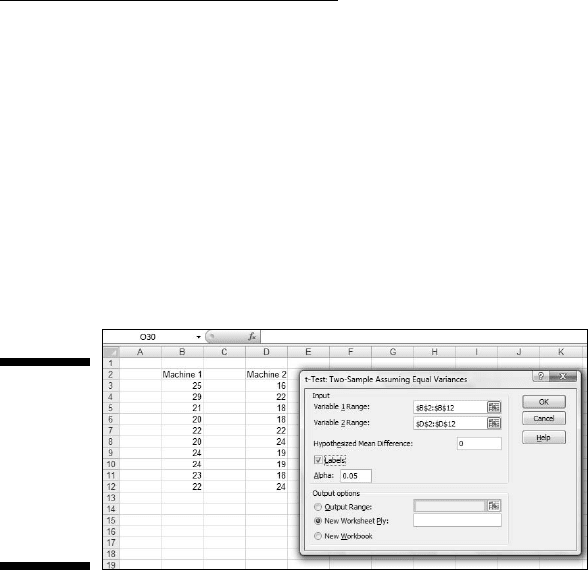
Here’s an example that applies the equal variances t-test tool to the data from
the FarKlempt machines example. Figure 11-7 shows the data along with the
dialog box for t-Test: Two-Sample Assuming Equal Variances.
Figure 11-7:
The equal
variances
t-Test data
analysis tool
and data
from two
samples.
To use this tool, follow these steps:
1. Type the data for each sample into a separate data array.
For this example, the data in the Machine 1 sample are in column B and
the data for the Machine 2 sample are in column D.
2. Select Data | Data Analysis to open the Data Analysis dialog box.
3. In the Data Analysis dialog box, scroll down the Analysis Tools list
and select t-Test: Two Sample Assuming Equal Variances. Click OK to
open this tool’s dialog box.
This is the dialog box in Figure 11-7.
4. In the Variable 1 Range box, enter the cell range that holds the data
for one of the samples.
For the example, the Machine 1 data are in $B$3:$B$12. (Note the $-signs
for absolute referencing.)
5. In the Variable 2 Range box, enter the cell range that holds the data
for the other sample.
The Machine 2 data are in $D$3:$D$12.
17 454060-ch11.indd 19917 454060-ch11.indd 199 4/21/09 7:30:22 PM4/21/09 7:30:22 PM
200
Part III: Drawing Conclusions from Data
6. In the Hypothesized Mean Difference box, type the difference
between μ1 and μ2 that H0 specifies.
In this example, that difference is 0. If the cell ranges include column
headings, check the Labels checkbox. I included the headings in the
ranges, so I checked the box.
7. The Alpha box has 0.05 as a default. Change that value if you’re so
inclined.
8. In the Output Options, select a radio button to indicate where you
want the results.
I selected New Worksheet Ply to put the results on a new page in the
worksheet.
9. Click OK.
Because I selected New Worksheet Ply, a newly created page opens with
the results.
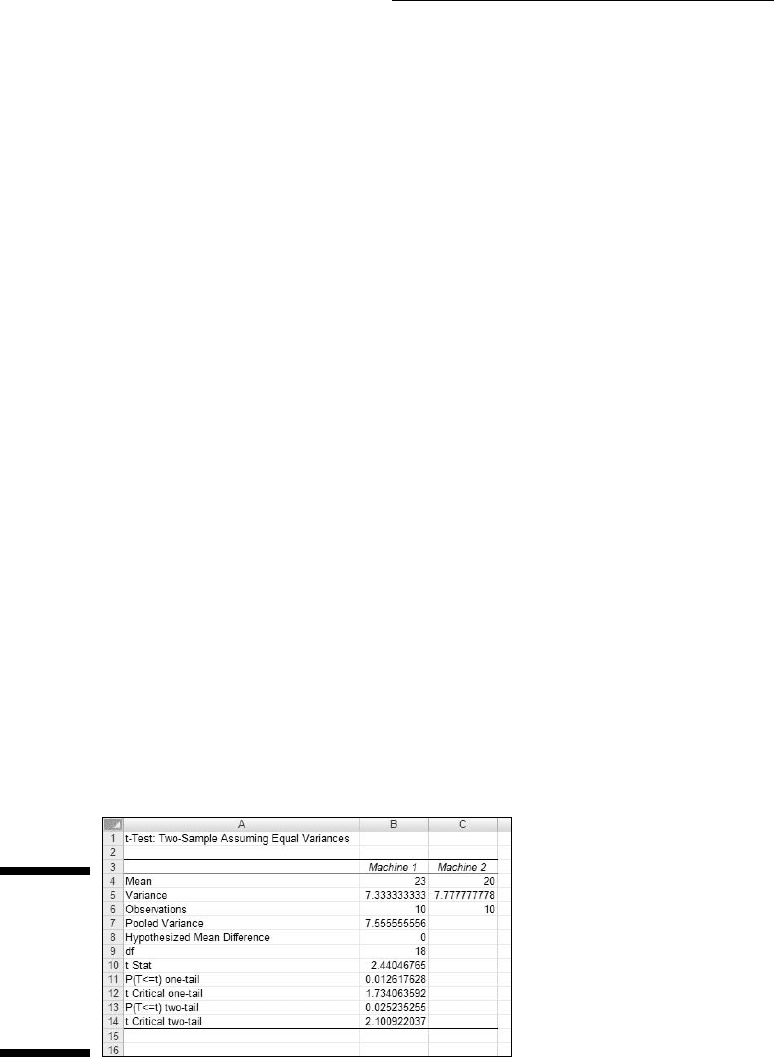
Figure 11-8 shows the tool’s results, after I expanded the columns. Rows 4
through 7 hold sample statistics. Cell B8 shows the H
0
-specified difference
between the population means, and B9 shows the degrees of freedom.
The remaining rows provide t-related information. The calculated value of the
test statistic is in B10. Cell B11 gives the proportion of area the positive value
of the test statistic cuts off in the upper tail of the t-distribution with the indi-
cated df. Cell B12 gives the critical value for a one-tailed test: That’s the value
that cuts off the proportion of the area in the upper tail equal to α.
Cell B13 doubles the proportion in B11. This cell holds the proportion of area
from B11 added to the proportion of area that the negative value of the test
statistic cuts off in the lower tail. Cell B14 shows the critical value for a two-
tailed test: That’s the positive value that cuts off α/2 in the upper tail. The
corresponding negative value (not shown) cuts off α/2 in the lower tail.
Figure 11-8:
Results of
the Equal
Variances
t-Test data
analysis
tool.
17 454060-ch11.indd 20017 454060-ch11.indd 200 4/21/09 7:30:22 PM4/21/09 7:30:22 PM
201
Chapter 11: Two-Sample Hypothesis Testing
The samples in the example I used have the same number of scores and
approximately equal variances, so applying the unequal variances version
of the t-Test tool to that data set won’t show much of a difference from the
equal variances case.
Instead I created another example, summarized in Table 11-2. The samples in
this example have different sizes and widely differing variances.
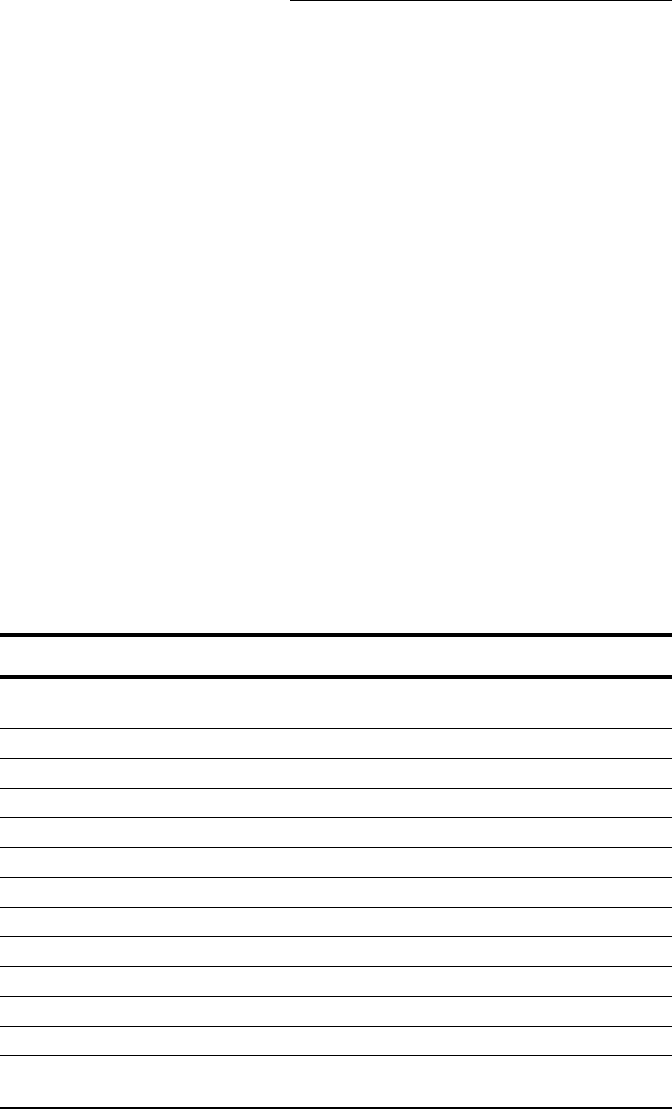
Table 11-2 Sample Statistics for the Unequal
Variances t-Test Example
Sample 1 Sample 2
Mean 52.50 41.33
Standard Deviation 499.71 41.87
Sample Size 8 6
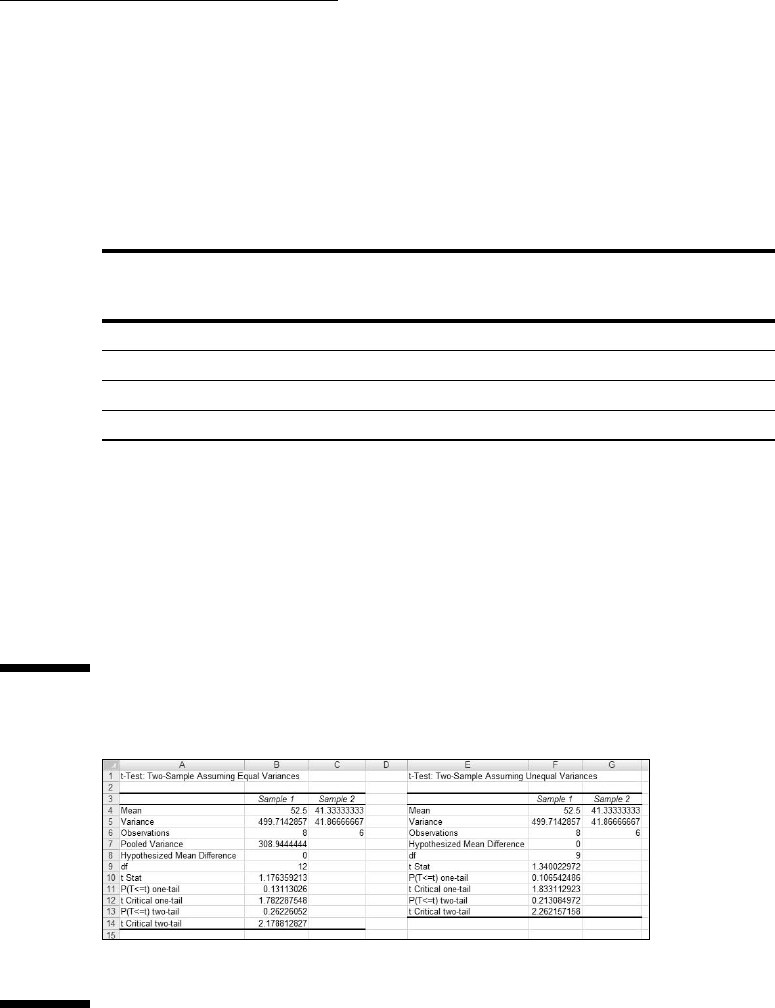
To show you the difference between the equal variances tool and the unequal
variances tool, I ran both on the data and put the results side by side.
Figure 11-9 shows the results from both tools. To run the Unequal Variances
tool, you go through the same steps as for the Equal Variances version with
one exception: In the Data Analysis Tools dialog box, you select t-Test: Two
Sample Assuming Unequal Variances.
Figure 11-9:
Results of
the Equal
Variances
t-Test data
analysis
tool and the
Unequal
Variances
t-Test data
analysis tool
for the data
summarized
in Table 11-2.
Figure 11-9 shows one obvious difference between the two tools: The Unequal
Variances Tool shows no pooled estimate of σ
2
, because the t-test for that
17 454060-ch11.indd 20117 454060-ch11.indd 201 4/21/09 7:30:22 PM4/21/09 7:30:22 PM
202
Part III: Drawing Conclusions from Data
case doesn’t use one. Another difference is in the df. As I pointed out before,
in the unequal variances case you reduce the df based on the sample vari-
ances and the sample sizes. For the equal variances case, the df in this exam-
ple is 12, for the unequal variances case, it’s 9.
The effects of these differences show up in the remaining statistics. The
t values, critical values, and probabilities are different.
A Matched Set: Hypothesis Testing
for Paired Samples
In the hypothesis tests I’ve described so far, the samples are independent of
one another. Choosing an individual for one sample has no bearing on the
choice of an individual for the other.
Sometimes, the samples are matched. The most obvious case is when the
same individual provides a score under each of two conditions — as in a
before-after study. For example, suppose ten people participate in a weight-
loss program. They weigh in before they start the program and again after
one month on the program. The important data is the set of before-after dif-
ferences. Table 11-3 shows the data:
Table 11-3 Data for the Weight-Loss Example
Person Weight Before
Program
Weight After One
Month
Difference
1 198 194 4
2 201 203 -2
3 210 200 10
4 185 183 2
5 204 200 4
6 156 153 3
7 167 166 1
8 197 197 0
9 220 215 5
10 186 184 2
Mean 2.9
Standard
Deviation
3.25
17 454060-ch11.indd 20217 454060-ch11.indd 202 4/21/09 7:30:22 PM4/21/09 7:30:22 PM
203
Chapter 11: Two-Sample Hypothesis Testing
The idea is to think of these differences as a sample of scores, and treat them
as you would in a one-sample t-test (Chapter 10).
You carry out a test on these hypotheses:
H
0
: μ
d
≤ 0
H
1
: μ
d
> 0
The d in the subscripts stands for “Difference.” Set α = .05.
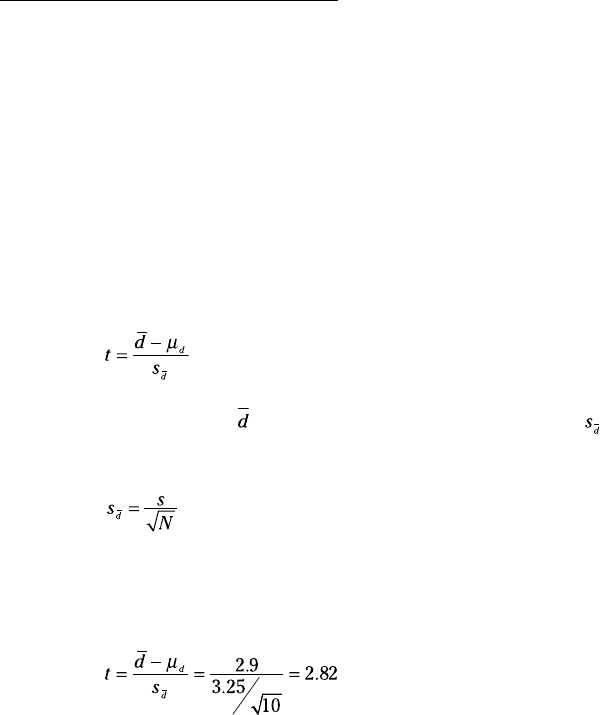
The formula for this kind of t-test is:
In this formula, is the mean of the differences. To find , you calculate the
standard deviation of the differences and divide by the square root of the
number of pairs:
The df is N-1.
From Table 11-3,
With df=9 (Number of pairs – 1), the critical value for α=.05 is 2.26. (Use TINV to
verify.) The calculated value exceeds this value, so the decision is to reject H
0
.
TTEST for matched samples
Earlier, I described the worksheet function TTEST and showed you how to
use it with independent samples. This time, I use it for the matched samples
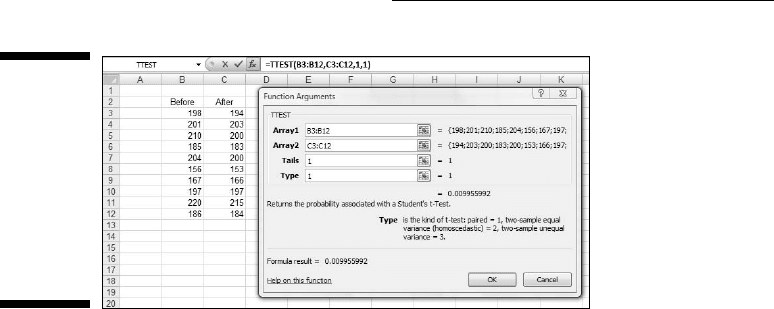
weight-loss example. Figure 11-10 shows the Function Argument box for
TTEST along with data from the weight-loss example.
17 454060-ch11.indd 20317 454060-ch11.indd 203 4/21/09 7:30:22 PM4/21/09 7:30:22 PM
204
Part III: Drawing Conclusions from Data
Figure 11-10:
The
Function
Arguments
dialog box
for TTEST
along with
matched
sample
data.
Here are the steps to follow:
1. Enter the data for each sample into a separate data array and select
a cell.
For this example, the data for the Before sample are in column B and the
data for the After sample are in column C.
2. From the Statistical Functions menu, select TTEST to open the
Function Arguments dialog box for TTEST.
3. In the Function Arguments dialog box, enter the appropriate values
for the arguments.
In the Array1 box, type the sequence of cells that holds the data for one
of the samples. In this example, the Before data are in B3:B12.
In the Array2 box, type the sequence of cells that holds the data for the
other sample. The After data are in C3:C12.
The Tails box indicates whether this is a one-tailed test or a two-tailed
test. In this example, it’s a one-tailed test so I type 1 in the Tails box.
The Type box holds a number that indicates the type of t-test to per-
form. The choices are 1 for a paired test, 2 for two samples assuming
equal variances, and 3 for two samples assuming unequal variances.
I typed 1.
With values supplied for all the arguments, the dialog box shows the
probability associated with the t value for the data. It does not show the
value of t.
4. Click OK to put the answer in the selected cell.
The value in the dialog box in Figure 11-10 is less than .05, so the decision is
to reject H
0
.
17 454060-ch11.indd 20417 454060-ch11.indd 204 4/21/09 7:30:23 PM4/21/09 7:30:23 PM
205
Chapter 11: Two-Sample Hypothesis Testing
If I assign the column headers in Figure 11-10 as names for the respective
arrays, the formula in the Formula bar can be
=TTEST(Before,After,1,1)
That format might be easier to explain if you had to show the worksheet to
someone. (If you don’t remember how to define a name for a cell range, see
Chapter 2.)
Data analysis tool: t-test: Paired
Two Sample for Means
Excel provides a data analysis tool that takes care of just about everything
for matched samples. It’s called t-test: Paired Two Sample for Means. In this
section, I use it on the weight-loss data.
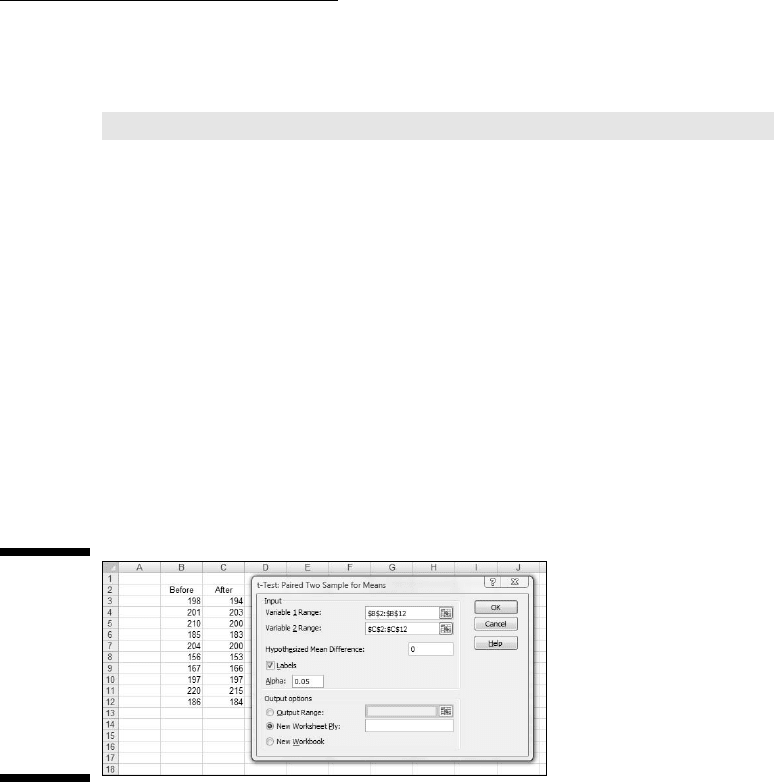
Figure 11-11 shows the data along with the dialog box for t-Test: Paired Two
Sample for Means.
Figure 11-11:
The Paired
Two Sample
t-Test data
analysis
tool and
data from
matched
samples.
Here are the steps to follow:
1. Enter the data for each sample into a separate data array.
For this example, the data in the Before sample are in column B and the
data for the After sample are in column C.
2. Select Data | Data Analysis to open the Data Analysis dialog box.
3. In the Data Analysis dialog box, scroll down the Analysis Tools list
and select t-Test: Paired Two Sample for Means. Click OK to open this
tool’s dialog box.
This is the dialog box in Figure 11-11.
17 454060-ch11.indd 20517 454060-ch11.indd 205 4/21/09 7:30:23 PM4/21/09 7:30:23 PM

206
Part III: Drawing Conclusions from Data
4. In the Variable 1 Range box, enter the cell range that holds the data
for one of the samples.
For the example, the Before data are in $B$2:$B$12. (Note the $-signs for
absolute referencing.)
5. In the Variable 2 Range box, enter the cell range that holds the data
for the other sample.
The After data are in $C$2:$C$12.
6. In the Hypothesized Mean Difference box, type the difference
between μ1 and μ2 that H0 specifies.
In this example, that difference is 0.
7. If the cell ranges include column headings, check the Labels checkbox.
I included the headings in the ranges, so I checked the box.
8. The Alpha box has 0.05 as a default. Change that value if you want to
use a different α.
9. In the Output Options, select a radio button to indicate where you
want the results.
I selected New Worksheet Ply to put the results on a new page in the
worksheet.
10. Click OK.
Because I selected New Worksheet Ply, a newly created page opens with
the results.
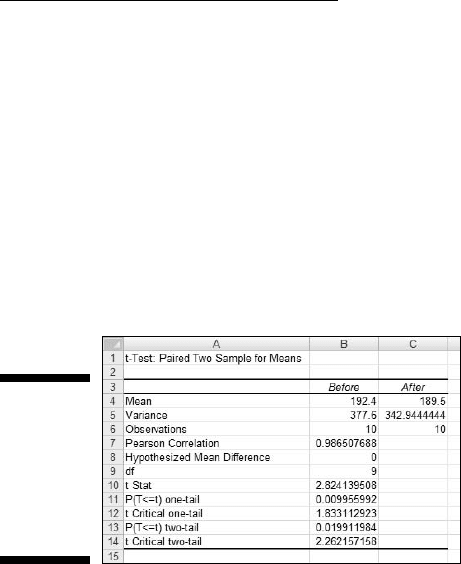
Figure 11-12 shows the tool’s results, after I expanded the columns. Rows 4
through 7 hold sample statistics. The only item that’s new is the number in
cell B7, the Pearson Correlation Coefficient. This is a number between –1 and
+1 that indicates the strength of the relationship between the data in the first
sample and the data in the second.
If this number is close to 1 (as in the example), high scores in one sample are
associated with high scores in the other, and low scores in one are associ-
ated with low scores in the other. If the number is close to –1, high scores in
the first sample are associated with low scores in the second, and low scores
in the first are associated with high scores in the second.
If the number is close to zero, scores in the first sample are unrelated to
scores in the second. Because the two samples consist of scores on the same
people, you expect a high value. (I describe this topic in much greater detail
in Chapter 15.)
Cell B8 shows the H
0
-specified difference between the population means, and
B9 shows the degrees of freedom.
17 454060-ch11.indd 20617 454060-ch11.indd 206 4/21/09 7:30:23 PM4/21/09 7:30:23 PM
207
Chapter 11: Two-Sample Hypothesis Testing
The remaining rows provide t-related information. The calculated value of the
test statistic is in B10. Cell B11 gives the proportion of area the positive value
of the test statistic cuts off in the upper tail of the t-distribution with the indi-
cated df. Cell B12 gives the critical value for a one-tailed test: That’s the value
that cuts off the proportion of the area in the upper tail equal to α.
Cell B13 doubles the proportion in B11. This cell holds the proportion of area
from B11 added to the proportion of area that the negative value of the test
statistic cuts off in the lower tail. Cell B13 shows the critical value for a two-
tailed test: That’s the positive value that cuts off α/2 in the upper tail. The
corresponding negative value (not shown) cuts off α/2 in the lower tail.
Figure 11-12:
Results of
The Paired
Two Sample
t-Test data
analysis
tool.
Testing Two Variances
The two-sample hypothesis testing I’ve described thus far pertains to means.
It’s also possible to test hypotheses about variances.
In this section I extend the one-variance manufacturing example I used in
Chapter 10. FarKlempt Robotics, Inc., produces a part that has to be a certain
length with a very small variability. They’re considering two machines to
produce this part, and they want to choose the one that results in the least
variability. They take a sample of parts from each machine, measure them,
find the variance for each sample, and perform a hypothesis test to see if one
machine’s variance is significantly greater than the other’s.
The hypotheses are:
H
0:
σ
1
2
= σ
2
2
H
1:
σ
1
2
≠ σ
2
2
As always, an α is a must. As usual, I set it to .05.
17 454060-ch11.indd 20717 454060-ch11.indd 207 4/21/09 7:30:23 PM4/21/09 7:30:23 PM
208
Part III: Drawing Conclusions from Data
When you test two variances, you don’t subtract one from the other. Instead,
you divide one by the other to calculate the test statistic. Sir Ronald Fisher is
a famous statistician who worked out the mathematics and the family of dis-
tributions for working with variances in this way. The test statistic is named
in his honor. It’s called an F-ratio and the test is the F test. The family of distri-
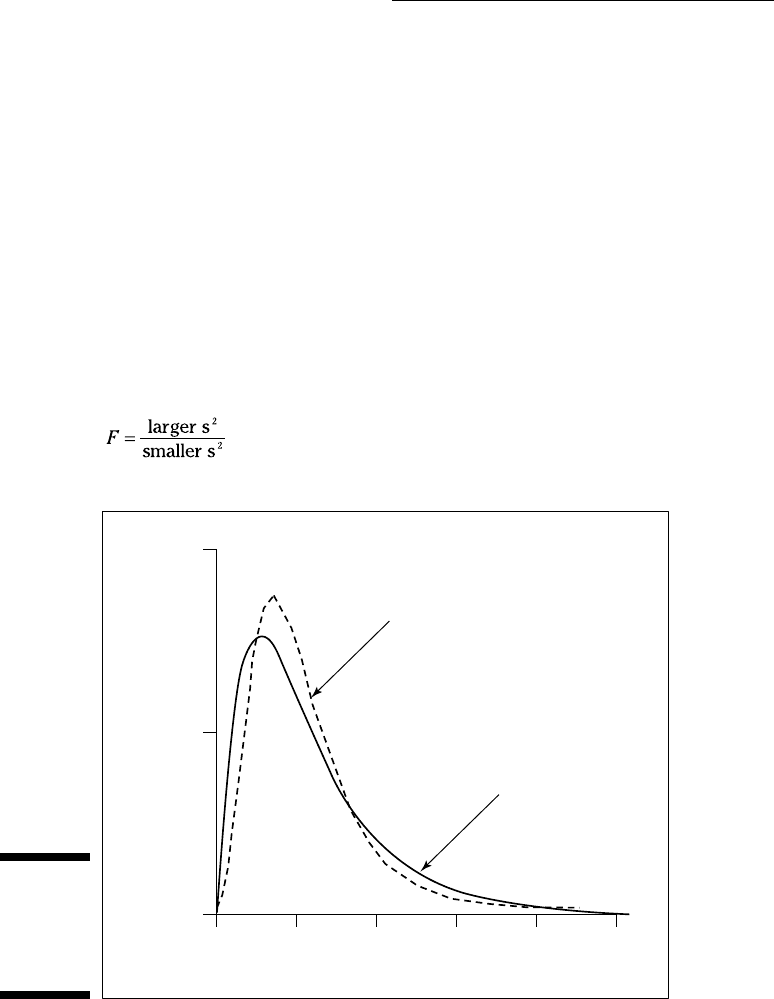
butions for the test is called the F-distribution.
Without going into all the mathematics, I’ll just tell you that, once again, df
is the parameter that distinguishes one member of the family from another.
What’s different about this family is that two variance estimates are involved,
so each member of the family is associated with two values of df, rather than
one as in the t-test. Another difference between the F-distribution and the
others you’ve seen is that the F cannot have a negative value. Figure 11-13
shows two members of the F-distribution family.
The test statistic is:
Figure 11-13:
Two mem-
bers of the
F-distribution
family.
f(F)
1.0
0.5
0.0
0
F
1 2
df = 10,20
df = 5,15
3 4 5
17 454060-ch11.indd 20817 454060-ch11.indd 208 4/21/09 7:30:23 PM4/21/09 7:30:23 PM