Takadoum J. Materials and Surface Engineering in Tribology
Подождите немного. Документ загружается.

Tribology 75
2.5.2. Surface forces measurements
Surface forces are primarily studied with two kinds of devices: the surface forces
apparatus (SFA) or the atomic force microscope (AFM).
2.5.2.1. The surface forces apparatus (SFA)
The principle of the SFA is to carefully bring together a mobile surface (a plane
or sphere) and a fixed surface (a plane) and to measure, during approach and
withdrawal, their forces of interaction as well as the distance between them
[GEO 94].
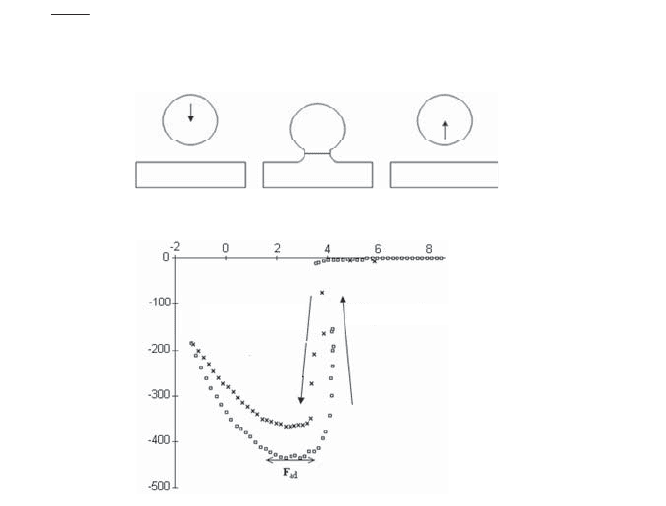
Figure 2.26 shows the evolution of the force depending on the phase of approach
or withdrawal for two carbon surfaces, a sphere and a plane, in a dry atmosphere.
During approach, a jump to contact resulting from Van der Waals forces occurred.
During withdrawal, some hysteresis is noted and the maximum adhesive force
(436 mN m
–1
) can easily be deduced. Based on this quantity, the surface energy of
carbon can be calculated by applying the JKR model (see Table 2.1) and equation [2.21]:
3
ad
F
R
J
S
Approach Adhesion Withdrawal
Displacement (nm)
Force/radius (mN m
–
1
)
Figure 2.26. Forces of adhesion of a sphere on a plane. Forces curve
obtained for two carbon surfaces with an SFA used in dry air:
a) displacement of the sphere; b) force curves [GEO 00]
Approach
Withdrawal
[2.36]
a)
b)
76 Materials and Surface Engineering in Tribology
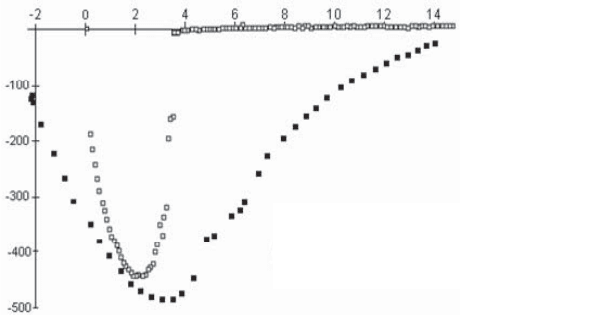
Figure 2.27 shows the impact of humidity on the force profile for two carbon
surfaces. The curves shown are for the withdrawal phase. We see clearly that the
maximum adhesive force (476 mN m
–1
) measured in a wet atmosphere (relative
humidity 30%) is greater than the equivalent for measurements in a dry atmosphere.
Moreover, the shape of the curve clearly provides evidence for the generation of an
interfacial meniscus (the withdrawal phase is accompanied by a strong tail on the
curve).
Force/radius (mN m
–
1
)
Figure 2.27. Force profile relative to displacement during withdrawal of the sphere from the
carbon plane; curves recorded in dry and wet conditions [GEO 00]
2.5.2.2. The atomic force microscope (AFM)
The principle of the AFM was presented in section 1.2.2.3.3. This technique
offers better resolution both in terms of the applied force as well as vertical
displacement, and also allows improved spatial resolution as the radius of curvature
of the AFM tip ranges from a few nanometers to a few tens of nanometers (whereas
spheres used in SFAs have radii of several millimeters).
We now present some measurement results obtained from experiments carried
out on immersed surfaces in different electrolytes.
Two metallic surfaces dipped in an electrolyte are brought close together.
Depending on the nature of the environment, the materials, the adsorbed species and
the pH of the solution, the surfaces may be subject to attraction or repulsion under
the action of a range of forces such as hydrophobia, hydration,Van der Waals forces
or electrostatic forces [BHU 05].
Dry contact
Wet contact
displacement (nm)
Tribology 77
Consider using an AFM to study the particular case of the contact between
different materials in a solution with differences in pH. We know that for a given
electrolyte, the material’s surface will develop a negative charge beyond a certain
threshold pH (pH
s
) and will develop a positive charge below this threshold. The
point corresponding to a surface charge of zero (pH = pH
s
) is known as the isoelectric
point or IEP.
As the tip of the AFM is made of silicon nitride (Si
3
N
4
) (whose IEP corresponds
to a pH of 6), then depending on the nature of the material (i.e. its IEP) brought into
contact with the tip in a given electrolyte, the two surfaces will develop same-sign or
opposite sign charges and repulse or attract.
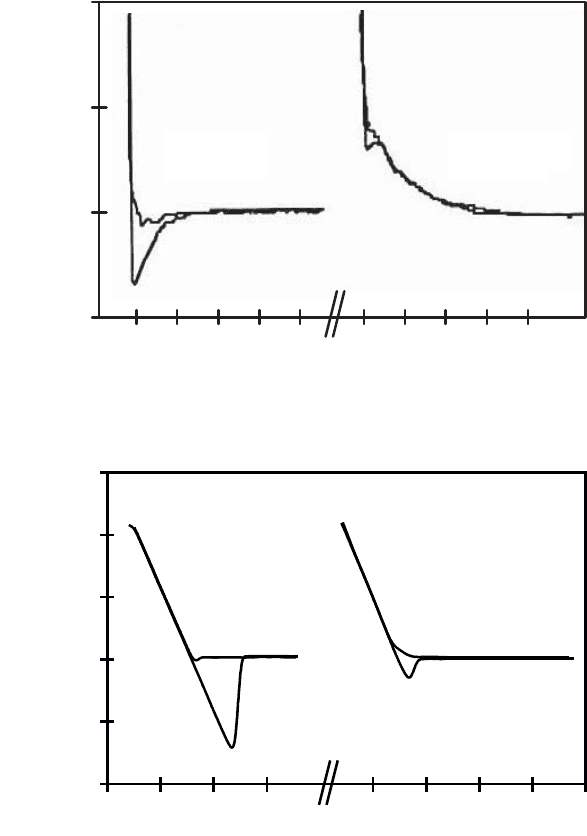
Figure 2.28a shows force curves corresponding to the contact between the tip of
the AFM (Si
3
N
4
) and a silicon oxide sample, in a 1 mM NaCl electrolyte solution, at
pH 4 and at pH 8.5. Silicon oxide has an IEP of pH 2, so its interaction with silicon
nitride (of IEP pH 6) will be attractive between pH 2 and pH 6 (the case for pH 4)
and repulsive otherwise (the case for pH 8.5) [MARTI 95]. For the pH 4 case, we note
that there is a large degree of hysteresis corresponding to strong adhesion between the
surfaces. However, at pH 8.5 the force curve shows repulsion between the surfaces.
Figure 2.28b shows force curves for a polycrystalline nickel sample in contact
with the tip of the AFM (Si
3
N
4
) in a 1 mM NaCl electrolyte solution at pH 3.3 and at
pH 10.5. Nickel is negatively charged irrespective of pH whereas silicon nitride (IEP
pH 6) is positively charged at pH 3.3 (attraction between Ni and Si
3
N
4
), and negatively
charged at pH 10.5 (repulsion between Ni and Si
3
N
4
). The attraction, which is
associated with a strong adhesive force, is clearly illustrated by the hysteresis in the
adhesion measured at pH 3.3 [GAV 02a].
As a result of experiments in nanotribology, a new approach to the interpretation of
friction has been introduced by Israelachvili [ISR 94]. He has shown that friction is not
correlated to the force of adhesion (strength of formed junctions), but to adhesion
hysteresis, i.e. the energy expended during the adhesion–rupture cycle.
This energy represents the difference between the energy required to establish
and break the contact. It reflects the irreversibility of the force responsible for the
adhesion, whereas in the Tabor and Bowden model, it is the value of this force that
determines the degree of friction.
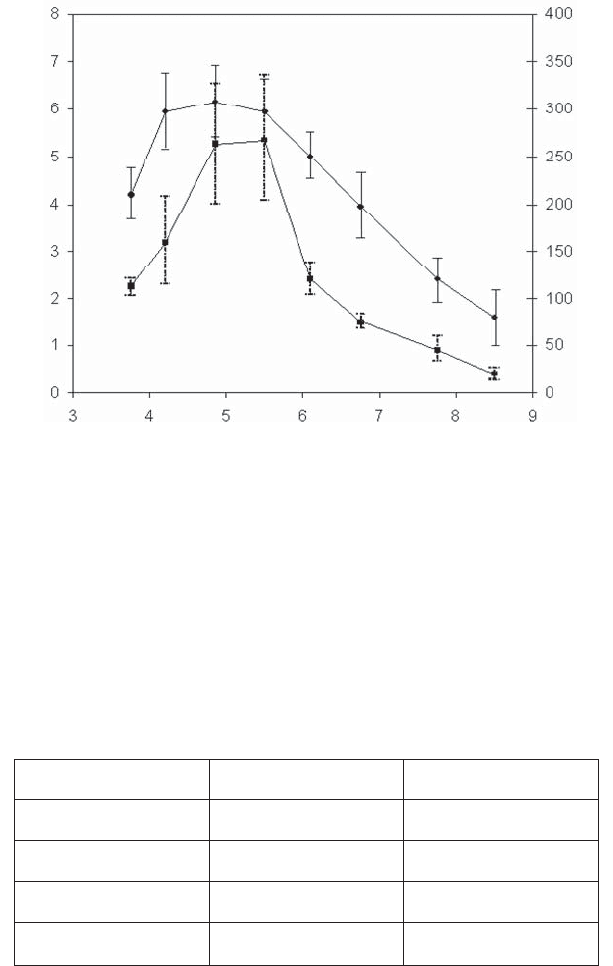
Figure 2.29 enables the unambiguous verification of this model. These results are
from the system described above and are shown in Figure 2.28a. Several force curves
were recorded at different pH levels and friction forces were measured with a lateral
force microscope (LFM) (see section 1.2.2.3.3). We note perfect correlation between
the adhesion hysteresis and the friction force.
78 Materials and Surface Engineering in Tribology
a)
a)
b)
Figure 2.28. a) Force curve recorded at pH 4 and pH 8.5 in a solution of 1 mM of NaCl
between the silicon nitride tip of the AFM and a silicon oxide sample [MARTI 95]; b) force
curve recorded at pH 3.3 and pH 10.5 in a solution of 1 mM of NaCl between the silicon
nitride tip of the AFM and a nickel sample [GAV 02a] (see Figure 1.18
for the interpretation of force curves)
Distance pointe – échantillon (nm)
Force normale (nN)
pH 4
pH 8,5
0
5
10
-5
0 20 40
0 20 40
Distance tip - sample (nm)
Normal force (nN)
pH 4 pH 8.5
pH 10,5
pH 3,3
Déflexion du microlevier (u.nité arbitraire)
0
5
10
15
-5
Déplacement (unité arbitraire)
-10
Displacement (arbitrary unit)
Deflexion of the cantilever (arbitrary
Deflection of the cantilever
(arbitrary unit)
pH 3.3 pH 10.5
Tribology 79
Figure 2.29. Lateral force (friction force) (Ŷ) and expended energy (hysteresis of adhesion)
(Ɣ) measured with AFM/LFM at different levels of pH in a solution of 1 mM of NaCl between
the silicon nitride tip of the AFM and a silicon oxide sample [MARTI 95]
2.5.2.3. Application: surface forces and micromanipulation
As shown in Table 2.3, as the dimensions of an object reduce, there is an
increase in the surface area to volume ratio, which results in surface forces playing
an increasingly important role in interactions. This is perfectly illustrated in the field
of micromanipulation – the positioning and precise movement of micron-sized
objects.
Radius (m) Surface/volume (m
–1
)
Atom 10
–10
3 u 10
10
Grain of sand 2 u 10
–4
15 u 10
3
Table-tennis ball 0.02 150
Soccer ball 0.1 30
Table 2.3. Some values of the surface/volume ratio
pH
Energie dissipée (eV) (Ɣ)
Force latérale (unités arbitraires) (Ŷ)
Lateral force (arbitrary unit) ()
Hysteresis of adhesion (eV) ( )
80 Materials and Surface Engineering in Tribology
The drive towards device miniaturization and the need to produce components
for micro-electro-mechanical systems (MEMS) motivates the need for grippers able
to hold and move micron-sized components. However, as surface forces become
greater on these scales, the force of adhesion (due to Van der Waals, electrostatic or
capillary forces) renders the micromanipulation of these objects intrinsically
difficult.
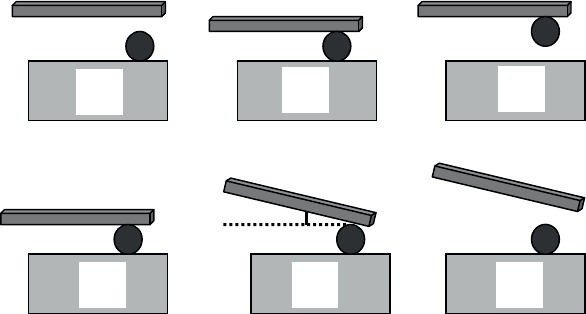
Although it is relatively easy to exploit surface forces to hold an object due to its
adhesion to the grippers it is, on the other hand, difficult to release the object and
thus free the grippers for a new manipulation. One solution to this problem consists
of tilting the grippers by some angle ș in order to minimize the force of adhesion.
This procedure is illustrated in Figure 2.30.
ș
a)
b)
c)
d) e) f)
Figure 2.30. Micromanipulation sequence: a) approach of the gripper;
b) object–gripper contact; c) the object is taken hold of; d) the object is laid down;
e) the gripper is tilted and the object is freed; f) the gripper is removed
The gripper comes into contact with the object, adheres to it and lifts it. For this
operation to succeed, the object needs to be “torn” from the substrate on which it is
resting; in other words, the object–substrate bond must be broken. The adhesive
force between the gripper and object must therefore be greater than the object–
substrate bond. Once held by the gripper, the object must be set down in a different
position but on the same substrate. For this to be possible, the object–substrate bond
must be greater than the object–gripper bond. This can be achieved by tilting of the
gripper according to an angle ș (with respect to the horizontal plane). This reduces
the object–gripper adhesive force (which is multiplied by a factor cos ș), which is
sufficient to make the object–substrate adhesion greater than that of the object–
Tribology 81
gripper. For a detailed analysis (and calculations) of the pick and place, see
[HALI 02] and [ROL 00].
Depending on the nature of the object to be moved, it is also possible to choose
two surfaces made of materials A and B and a gripper made of material C in order to
move the object from A to B without having to tilt the gripper by an angle ș. Careful
selection of the three materials can ensure that the gripper–object adhesive force is
greater than that between material A and the object, but less than the adhesion
between material B and the object.
In order for the manipulation described above to be successful, the following
double inequality between Hamaker’s constants need to be satisfied [ROL 00]:
A
(object–material B)
> A
(gripper–object)
> A
(object–material A)
[2.37]
2.5.3. Nanofriction
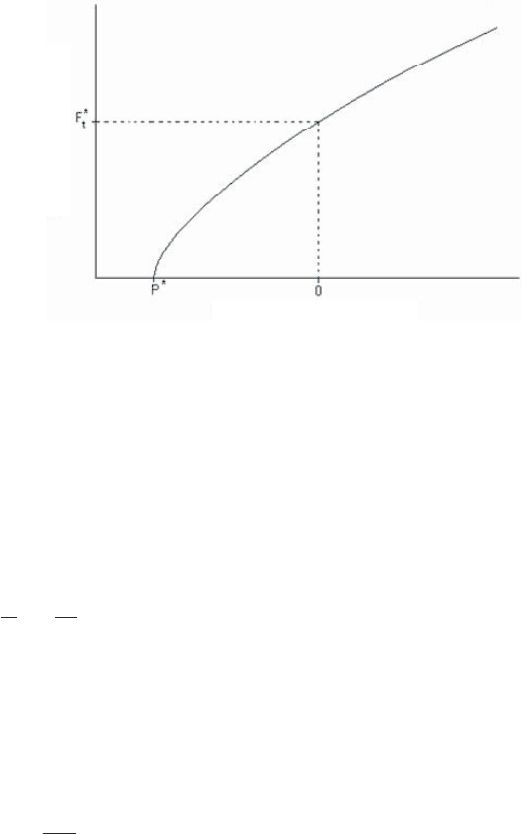
Figure 2.31 shows the variation of the friction force as a function of the normal
load for a silicon tip (of a few nanometers of radius of curvature) covered with an
amorphous layer of carbon, sliding on the surface of mica or carbon samples.
Because of surface forces, we note the existence of non-zero friction even with
no applied load (Ft* = 0 to 15 nN depending on the radius of curvature of the tip and
the nature of the samples tested) [PIE 99, SCH 97a, SCH 97b]. The friction force
cancels for a negative applied normal force P* (maximum adhesive force) between 2
and 50 nN.
This result illustrates the complex nature of nanotribology compared to classical
tribology, and shows that problems linked to friction and wear in microsystems
cannot be resolved through the naive transposition of laws and empirical solutions
that are valid on the macroscopic scale. Indeed, the size factor (the scaling from
macro to micro, or even nano) is not beneficial to miniaturization because, in
microsystems, the forces dissipated by friction in mechanical links are considerable
[MIN 98].
82 Materials and Surface Engineering in Tribology
Figure 2.31. Friction force relative to the normal load for a silicon tip covered with an
amorphous film of carbon, and sliding on the surface of mica or carbon samples.
*
t
F
and P*
range from 0 to 15 nN and from 0 to 50 nN, respectively [PIE 99, SCH 97a, SCH 97b]
2.6. Wear
Wear, corrosion and the specific degradation of polymers under ultraviolet light
are the main modes of material degradation. Wear typically induces some degree of
material loss. In the case of a hard material A in sliding contact with a soft surface
B, we write the wear experienced by surface B as:
n
F
V
K
LH
[2.38]
where V represents the total volume of material removed, L the total sliding
distance, F
n
the normal applied load and H the hardness of the softer material. K is a
(dimensionless) wear coefficient which can take values ranging from 10
–10
(mild
wear) to 10
–3
(severe wear).
The coefficient K is sometimes replaced by a coefficient K', which is given by:
'
n
V
K
LF
[2.39]
expressed in mm
3
mN
–1
.
Several methods can be used to quantify wear, such as:
–
weighing of samples once the tests have been performed;
Friction force (nN)
Applied force (nN)
Tribology 83
– quantifying the volume of removed material through the use of 3D tactile or
optical profilometers;
–
filtration and analysis of the oils and wear debris found in lubricants;
–
surface activation which consists of marking it with radiotracer isotopes and
monitoring the wear through analysis of the radioactive signal emitted; provided it
has been properly calibrated, the intensity of this signal can yield the depth of wear.
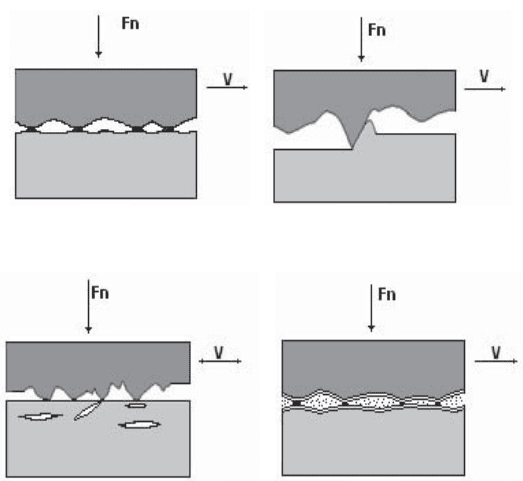
2.6.1. The different forms of wear
It is usual to classify wear in terms of four different categories: adhesive wear,
abrasive wear, fatigue wear and tribochemical wear (see Figure 2.32).
2.6.1.1. Adhesive wear
Adhesive wear (illustrated in Figure 2.32a) is characterized by the appearance of
junctions (or microwelds) between the surfaces that are subject to friction. When
these junctions are weak, shear occurs at the interface of the two surfaces and there
is no wear. However, when junctions are strong, the softer material is subject to
shearing and, as a consequence, is transferred onto the harder material.
2.6.1.2. Abrasive wear
Abrasive wear (illustrated in Figure 2.32b) occurs when a hard material is put
into contact with a soft material. This type of wear can cause scratches, wear
grooves and lead to material removal.
2.6.1.3. Fatigue wear
Surface fatigue wear (illustrated in Figure 2.32c) occurs when a material is
subject to cyclical stresses. Due to strains introduced in the superficial layers of
the material, cracks that are parallel to the surface develop within the material.
When they reach a critical size, they generate flake-like debris. This phenomenon
is also referred to as delamination wear.
2.6.1.4. Tribochemical wear
Tribochemical wear (illustrated in Figure 2.32d) is a phenomenon which
involves the growth of a film of reaction products due to chemical interactions
between the surfaces in contact with each other and the surrounding environment.
One of the most common forms of tribochemical wear is tribo-oxidation wear.
The increase in temperature due to friction accelerates the growth of an oxide film
which detaches from the surface when it reaches a certain critical thickness. The
84 Materials and Surface Engineering in Tribology
debris thus generated can take part in the wear process or be evacuated from the
friction path.
a) b)
c) d)
Figure 2.32. Main forms of wear: a) adhesive wear; b) abrasive wear;
c) fatigue wear; d) tribochemical wear
2.6.2. Wear maps
Wear maps are used to represent the different types of wear as a function of
tribological parameters [LIM 97]. Figure 2.33 shows the wear map of a steel/steel
pair in a pin-on- disk-type contact. The different domains are plotted as a function of
normalized parameters.