Vaccari D.A., Strom P.F., Alleman J.E. Environmental Biology for Engineers and Scientists
Подождите немного. Документ загружается.

Example 11.4 If an average of 41 colonies is counted per filter when 10 mL of a 10
3
dilution of the sample is filtered, what was the concentration of CFUs in the original
sample?
Answer
CFUs=mL ¼ 41 colonies=plate 10 mL 10
3
¼ 4:1 10
3
CFU=mL
Membrane filtration can be especially helpful in enum erating microorganisms present
at low concentrations in water. However, particulate material present in the sample can be
an interference.
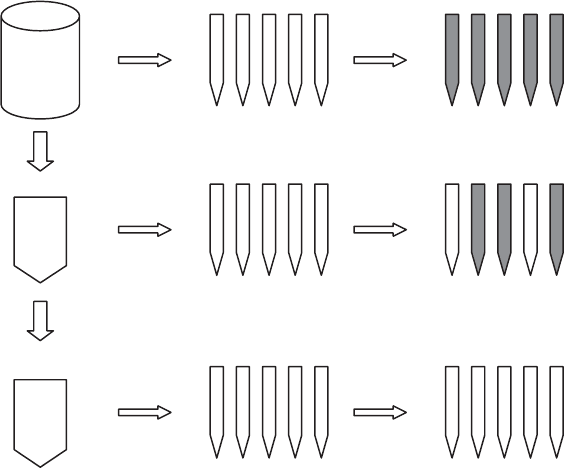
Most Probabl e Number Techniques Suppose a sample that originally contained five
bacteria per milliliter was diluted 10- and 100-fold (Figure 11.13). Then five tubes of
media were each inocula ted with 1 mL of the sample, another five tubes were each inocu-
lated with 1 mL of the 10-fold dilution, and another five tubes were each inoculated with
1 mL of the 100-fold dilution (a total of 15 tubes inoculated, five at each of the three dif-
ferent concentrations). Further, assume that each cell could grow if it is placed in a tube.
Which of the tubes are likely to show growth? Since on average the tubes receiving 1 mL
of undiluted sample receive five bacteria each, it is likely they will all grow, although
there is a statistical possibili ty that one or more tubes may not get any bacteria (and
will not grow), whereas others will probably get more than five. However, for the
10-fold dilution, on average each tube gets 0.5 cell. Of course, a tube cannot receive
0.5 cell, so that some tubes will get one or more cells and be ‘‘positive’’ (show growth),
whereas others will not get a cell and will thus be negative. Probably two or three of the
10 x dilution
10 x dilution
inoculate
inoculate
inoculate
incubate
incubate
incubate
sample
Figure 11.13 MPN method schematic. Positive tubes are shown as dark after incubation.
308
QUANTIFYING MICROORGANISMS AND THEIR ACTIVITY
tubes will end up positive. At the 100-fold dilution, on average only 0.05 cell is added to
each tube, and hence all may be expected to be negative.
The pattern of positive tubes that results (in this case, perhaps 5-3-0) is an indication of
the cell numbers originally present. Through a mathematical procedure, in fact, the most
probable number (MPN) of cells originally present resulting in that pattern can be esti-
mated. These values have been tabulated for several different numbers of replicates (e.g.,
3, 5, and 10 tubes per dilution), and also for different dilution factors (e.g., two fold as
well as 10-fold serial dilutions). Note that a positive or negative result in each tube is used
to arrive at a quantitative estimate of cell numbers. The estimate from a pattern of 5-3-0 is
an MPN of 8.0 mL
1
of the original sample. (A response of 5-2-0 gives an MPN of 5.0,
the starting value used in the example.)
An obvious disadvantage of this approach is that it produces a statistical estimate rather
than an actual count. For example, with the 5-3-0 example, there is a 95% likelihood
that the actual number is between 3.0 and 25, an undesirably broad range. On the other
hand, the MPN is potentially useful for a wide variety of samples and can be adapted for
many types of microorganisms, including some for which other methods have not been
successful.
Turbidity and Absorbance A method that can be used in laboratory cultures, especially
pure cultures, grown on soluble (and preferably colorless) media is measurement of
turbidity (cloudiness) or absorbance. Turbidity is the amount of light dispersed 90
from the path of incident light passing through a material. It is measured with a turbidi-
meter using a photocell at right angles to the light path. Absorbance is the reduction in the
transmission of light along the light path and may occur due to both dispersion and
absorption of light. Abs orbance is also called optical density (OD) and is usually mea-
sured with a spectrophotometer (also called a spectrometer). Absorbance is used more
often than turbidity because spectrometers are more commonly available than turbidi-
meters.
If a small amount of microbial suspension is placed in a sample tube, its turbidity, or
the amount of light dispersed toward the photocell, is proportional, up to a point, to the
number of particles in the suspensio n. Similarly, for absorbance, the amount of light that
passes through the suspension will be inversely proportional to the concentration of organ-
isms, provided that particle size does not change. This is a form of Beer’s law (absorbance
is proportional to concentration), which is the basis of most quantitative spectrophotome-
try (although in this case a substantial amount of the light is refracted rather than actually
absorbed). Thus, increases in either turbidity or absorbance can be used as a surrogate
measure of growth, or correlated through use of a calibration curve to microbial counts
obtained by other methods.
One advantage of using turbidity or absorbance is that they are not destructive of the
culture. In fact, special flasks with sidearms are available so that the turbidity of a pure
culture can be determined over time without the need to open the flask and risk contam-
ination. However, if particle size increases, through flocculent growth or filament elonga-
tion, turbidity and OD will underestimate the cell count or biomass. Also, this approach
generally cannot be used with environmenta l samples.
Counting Viruses and Bacteriovores Viruses are too small to see under any light micro-
scope for direct counting. Also, since they grow only wi thin cells of other organisms, they
COUNTS OF MICROORGANISM NUMBERS 309

cannot be cultured directly like bacteria. Thus, alter native methods are needed to enumer-
ate them.
If a suspension of the bacteria Escherichia coli is spread over the surface of a plate
containing an appropriate medium, a uniform bacterial lawn will develop. If at the
same time that the culture is added, a sample containing coliphage (viruses that attack
E. coli) is included, ‘‘holes’’ in the lawn will develop as the viruses infect and kill
cells and then spread to neighboring cells. These clear areas, where the bacteria have
been lysed by the phage, are referred to as plaques (Figure 11.14). The number of
such plaques is then an estimate of the number of plaque-forming units (PFUs) present
in the volume of sample added. Similarly, other phage can be enumerated using appropri-
ate host bact eria for the lawn. Analogous to CFUs, it is often expected that each PFU
stems from a single initial phage.
Many animal and plant viruses can be counted in similar ways using appropriate host
cell cultures. In these cases, however, individual infected cells may be counted rather than
plaques. Alternatively, an MPN type of procedure might be used, or if necessary, the
development of infection in exposed whole organisms.
Plaque formation can also be used to count some organisms that feed on bacteria, such
as amoeba. Host cell lysis caused by Bdellovibrio, the bacteriovorous proteobacteria
(Section 10.5.6), also forms plaques.
11.5.3 Relationship between Numbers and Mass
The size of a population of microorganisms can be expressed on the basis of their number
or their mass. These are, of course, expected to have some relationship. In fact, if the size
and shape of a particular microbe are known, its mass can usually be estimated easily.
Example 11.5 A rod-shaped bacterial cell is 0.8 mm in diameter and 2 mm in length.
What is its mass?
Figure 11.14 Sketch of petri dish with bacteriophage plaques. (Plate contains 43 PFUs.)
310
QUANTIFYING MICROORGANISMS AND THEIR ACTIVITY

Answer The rod shape can be approximated by that of a cylinder, so that its volume,
V, can be estimated as
V ¼ pr
2
h ¼ pð0:4 mmÞ
2
ð2 mmÞ1:0 mm
3
1cm
10
4
mm
3
¼ 1:0 10
12
cm
3
Most cells have a density only slightly greater than that of water, perhaps 1.05 to
1.10 g/cm
3
, so that this cell would have a mass of 1 10
12
g. Since cells are typically
about 85% water, this would be a dry weight of about 1:5 10
13
g per cell.
If 10
9
of the rods in Example 11.5 were present in a sample, this could then be estimated
to correspond to about 1 mg of the wet weight of cells (10
9
cells 10
12
g/cell ¼
10
3
g ¼1 mg). Alternatively, if the mass of these cells in a sample was known, the numbers
present could be estimated.
Most bacteria probably have wet weights in the range 0:2to3 10
12
g and dry
weights of 0.3 to 4 10
13
g.
11.5.4 Surface Area/Volume Ratio
The surfaces of prokaryotic cells are not just protective wrappings. They often are highly
active regions that may be required to transport incoming substrates, remove outgoing
products and waste s, shed excess heat, regulate internal osmotic pressure, and support
flagella. Thus, the surface area/volume (or mass) ratio ðA
S
=VÞ of prokaryotic cells
plays an important part in their survival and metabolic success.
A
S
=V is not commonly measured, but it is important to realize that it is very dependent
on cell size. For cocci, for example, assuming that they are spherical with radius r,
A
S
V
¼
4pr
2
4=3pr
3
¼
3
r
Thus, this ratio is highest in small organisms and will decrease in an inversely
proportional way with size. In fact, this is a factor that limits the size of single-celled
organisms.
11.6 MEASURING MICROBIAL ACTIVITY
In some cases it may be desirable to quantify the general or specific activity of microor-
ganisms in a system. This may then be used to estimate microbial mass or numbers, or
may be of intere st in its own right. What usually is meant by microbial activity is the rate
at which microbially mediated reactions are occurring. Thus, the rate of activity might be
determined by measuring the rate of disappearance of any of the reactants or the appear-
ance of any of the products. In some cases, it may also be measured by looking at the rate
of enzymatic activity in a sample.
MEASURING MICROBIAL ACTIVITY 311
11.6.1 Aerobic Respiration
A generalized overall reaction for aerobic respiration of organic material can be expressed
as
organic matter þ O
2
! CO
2
þ H
2
O þ new biomass þ energy
Analogous reactions can be developed for inorganic substrates such as ammonia and
hydrogen sulfide, which are used by lithotrophic organisms. The rate of change of each
of the six quantities in this equation in theory could be used to measure the rate of aerobic
microbial activity. This is typically done by making repetitive measurements of disappear-
ance or accumulation over time. However, such repeated sampling may inadvertently
affect the system itself. Alternatively, multiple replicate systems can be established
initially and one or more sacrificed at each different sampling time. A disadvantage of
this approach is the inherent variability between ‘‘replicate’’ systems.
Organic Matter Disappearance In some situations the microbial activity on a particular
compound is of interest. If this compound can be measured, its disappearance over time
will be a direct indication of activity. However, proper controls are necessary to ensure
that the activity is biological rather than the result of other mechanisms, such as volati-
lization, adsorption, or chemical transformation. Killed controls, in which any organisms
present or added are destroyed by heat, ultraviolet radiation, or chemical means, are often
best for such techniques. Also, disappearance of the parent compound does not neces-
sarily mean that it is being completely biodegraded; some compounds are merely trans-
formed to metabolic products that then persist and accumulate (see ‘‘Biodegradation’’ in
Section 13.1.3).
Alternatively, some general measure of organic material might be used, and its disap-
pearance monitored. Biochemical oxygen demand (BOD), chemical oxygen demand
(COD), and total organic carbon (TOC) are three such measures commonly used for
this purpose and are discussed further in the section ‘‘Quantification of Organic Carbon’’
in Section 13.1.3.
Measurements of organic material are often of great importance for measuring extent
of disappearance but typically are not convenient for measuring rates. Good rate measure-
ments usually require frequent sampling, which may be disruptive to the system or
demand large numbers of replicate systems for sacrifice. In most cases the need for che-
mical analysis also places practical limits on the number of samples that can be processed.
Oxygen Utilization In the headspace of a closed system of fixed volume and const ant
temperature, oxygen removed by respiration is replaced by an almost equal molar amount
of carbon dioxide produced. However, carbon dioxide, a weak acid, is easily removed by
absorption with an alkali, such as KOH solution. The pressure in the system will then drop
as oxygen is consumed. Alternatively, if the pressure and temperature of the system are
held constant, the volume will decrease. In both cases, frequent measurements can be
taken without the need for expensive or disruptive analyses. Such methods are referred
to as respirometric techniques.
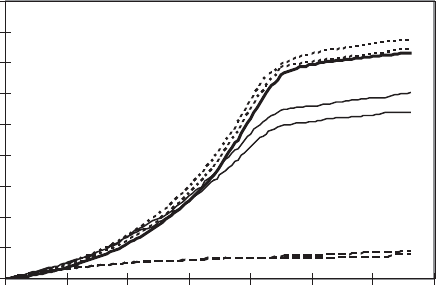
Early respirometers typically required manual measurements of changes in pressure.
Many modern systems can collect data automatically every few seconds, if desired, allow-
ing careful monitoring of the pattern of oxygen utilization (Figure 11.15). In one device,
312 QUANTIFYING MICROORGANISMS AND THEIR ACTIVITY
for example, oxygen is replace d automatically each time a slight pressure change occurs,
and the amount of oxygen supplied is recorded.
With the development of dependable electrochemical dissolved oxygen (DO) probes,
it has also become common to measure the oxygen uptake rate (OUR) directly in liquid
culture. The liquid is first aerated, if needed, and then the drop in DO over time is measured
and reported in milligrams of DO uptake per liter per minute (or hour). This may be
further normalized to the biomass present, usually measured as SS or VSS, to give a specific
OUR (SOUR), in units such as milligrams of DO uptake per minute per gram of biomass.
In systems in which the air flows through continuously, it may be possible to determine
oxygen utilization by measuring the difference in the entrance and exit concentrations of
oxygen in the airstream. Similarly, in continuous-flow liquid systems it may be possible
to measure oxygen uptake by measuring changes in DO concentrations.
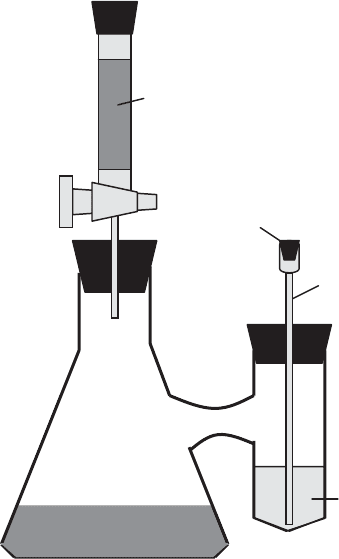
Production of Carbon Dioxide The carbon dioxide produced by respiration might be
measured directly (e.g., with an infrared spectrophotometer) or absorbed in an alkali
and measured by titration with acid. For an aerated system, the exit gas might be bubbled
through KOH solution in several flasks in series to be sure that it is all removed. Special
biometer flasks (also known as Bartha flasks after their inventor, Richard Bartha) with
sidearms containing KOH can also be used (Figure 11.1 6). Measurements of CO
2
can be
particularly useful because they indicate mineralization of organic matter. Especially if
appropriately
14
C-radiolabeled test compounds are available,
14
CO
2
production gives
clear evidence of their complete biodegradation.
Production of Water In most aqueous systems the amount of metabolic water pro-
duced is too small to measure com pared to the amount of water already in the system.
New Biomass Many of the methods described in Section 11.4 might be used to deter-
mine biomass over time. Alternatively, counts (Sections 11.5.1 and 11.5.2) might be used
and converted (Secti on 11.5.3), if necessary, to biomass. However, the relationships
0
10
20
30
40
50
60
70
80
90
0 2 4 6 8 10 12 14
Time (hr)
Oxygen Uptake (mg/L)
lean
rich
technical
reagent
Figure 11.15 Example of respirometry data. Oxygen uptake with various grades (reagent,
technical, lean, and rich) of monoethanol amine (MEA). (Data courtesy of Y. Lam, R. M. Cowan,
and P. F. Strom.)
MEASURING MICROBIAL ACTIVITY 313
between new biomass produced and other aspects of microbial activity may be complex.
These are discussed more in Section 11.7.
Energy Some of the energy released by metabolic activities is captured and used for
growth and other cell functions; the rest is given off as heat. Special instruments
known as calorimeters can sometimes be used to measure this release of heat experimen-
tally. The amo unt of heat released per mass of oxygen utilized is 14,000 J/g O
2
for oxi-
dation of a wide variety of organic compounds. Also, in some systems of interest to
environmental engineers and scientists, such as composting, sufficient heat is released
that it may be possible to measur e temperature changes or other signs of heat production
as a means of determining the rate of activity [see the discussion of equation (16.5)].
11.6.2 Anaerobic Systems
In anaerobic systems it may also be possible to measure the disappearance of organic
material or of electron acceptors such as nitrate or sulfate. Alternatively, monitoring
the appearance of particular products such as ethanol or acetate may be feasible (if they
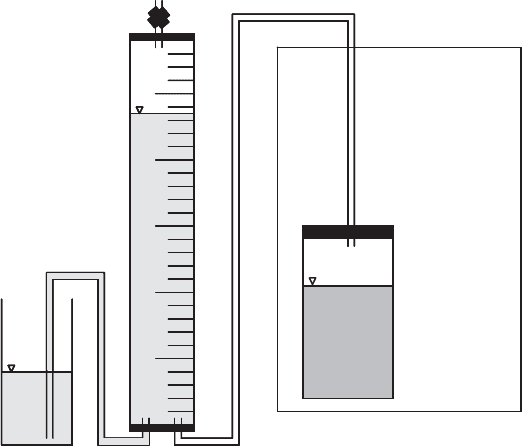
accumulate). In methanogenic systems, the rate of formation of gaseous products can be
measured volumetrically if they can be trapped in a gas collection column (Figure 11.17).
This will typically be about 65% methane and 35% carbon dioxide (with traces of other
gases). The total can be measured, or the carbon dioxide can be removed by scrubbing
with KOH.
soil
KOH
solution
plug
needle
CO
2
trap
stopcock
Figure 11.16 Biometer flasks.
314
QUANTIFYING MICROORGANISMS AND THEIR ACTIVITY
11.6.3 Enzyme Activity
The amount of activity of a particular enzyme or group of enzymes in a sample can serve
as an indication of the number and activity of microorganisms present. Probably the most
widely used is the dehydrogenase assay, in which a tetrazolium salt is converted to a
colored formazan product that is extracted and quantified. Other general enzyme assays
include those for proteases, phosphatases, and esterases. Particular activities of interest,
such as cellulose (cellulases), starch (amylases), or chitin (chitinases) degradation or
nitrogen fixation (nitrogenases), also can be quantified.
11.7 GROWTH
Some microorganisms can reproduce asexually by budding, and many eukaryotes have a
method of sexual reproduction. However, most microorganisms commonly reproduce
asexually by binary fission, and that is the means of growth that we focus on here. In
this process, a single ‘‘parent’’ cell physically splits into two genetically identical
(in the absence of mutations) ‘‘daughter’’ cells. Since the original cell does not ‘‘die’’
in this process, terms such as age and life span have a different meaning than with plants
and animals.
11.7.1 Exponential Growth
If they were able to grow freely without outside constraints (and no removal or death),
cells growing by binary fission would follow the pattern depicted in Figure 11.18.
Under these conditions the time between each successive split, producing a new
incubator
reactor
tubing
clamp
overflow
collection
vessel
gas
collection
column
gas
Figure 11.17 System for anaerobic gas production measurement.
GROWTH 315
‘‘generation’’ of daughter cells, is constant and is called the generation time ðt
g
Þ. Since
the nu mber of cells doubles each generation, the same period also is commonly referred to
as the doubling time ðt
d
Þ. This type of growth pattern is referred to as exponential
growth. Note that whereas the time period is constant, the number of new cells added
during that period doubles each time.
Most people do not have an intuitive feeling for exponential growth. As a simple men-
tal exercise, picture folding a standard sheet of paper in half, then in half again, and again.
Imagine that you could continue folding it in half 50 times. How tall would the folded
stack of paper then be: a meter? 100 m ( a football field)? New York to San Francisco
(5000 km)? After first trying to guess, cal culate an approximate answer by assuming
that the paper is 0.1 mm thick and doubles each time it is folded (or 0.1 mm 2
50
).
(Note:2
10
¼10
3
.)
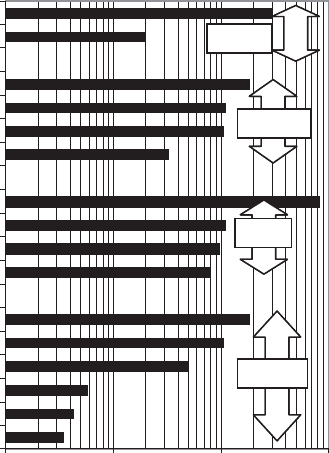
Minimum Doubling Times Under ideal growth conditions, microorganisms will
achieve their most rapid growth and hence their minimum t
d
. This value is inherent to
the particular strain of organism (for the system in which it is growing), and there is in
fact a tremendous range of minimum doubling times in the microbial world. Some exam-
ples are shown in Figure 11.19.
Many common fast-growing bacteria (e.g., Escherichia coli) can have generation times
of only 20 minutes. A few, such as the thermophile Bacillus stearothermophilus (found,
for example, in composting piles), grow even more rapidly, with minimum generation
times of around 10 minutes. This is about 1,000,000 times faster than a typical human
generation of approximately two decades!
Prokaryotes in general have faster growth rates than eukaryotes, with their greater
complexity. However, there are also slow-growing bacteri a. Organisms tend to adapt to
181624
Time
Doubling
Exponential
Growth
Pattern
Time
Doubling
Time
Doubling
Time
Doubling
Figure 11.18 Theoretical microbial growth schematic.
316
QUANTIFYING MICROORGANISMS AND THEIR ACTIVITY
their environments, so that bacteria living in systems where substrates become available
slowly will tend to be slow growing. Also, bacteria utilizing substrates that release little
energy may have minimum doubling times of several hours or even days. Such substrates
can include hard-to-degrade organic substances as well as some inorganic energy sources.
For example, the chemolithotroph Nitrobacter winogradskyi derives only 17 kcal of
energy per mole of NO
2
-N that it oxidizes to nitrate, as compared to the 600 kcal/
mol potentially available to E. coli from the oxidation of glucose. This is reflected in
the 18-hour minimum generation time of N. winogradskyi (Figure 11.19).
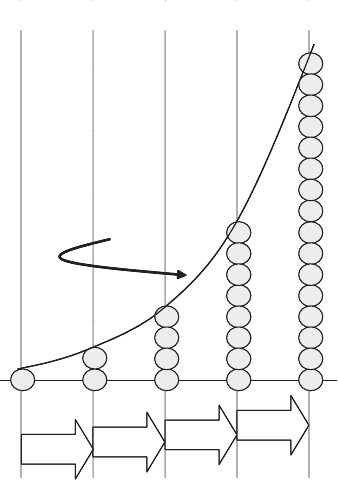
Modeling Exponential Growth If one cell begins growing exponentially, and cell num-
ber ðNÞ is plotted vs. time, initially N increases in discrete steps: 1–2–4–8–16–32–64–
(Figure 11.20). After a period of time, the cell divisions would no longer be synchronized
precisely, so that the intermediate numbers (such as 50) would be present for brief peri-
ods. Still, only whole numbers of cells can occur (not 50.2), making the plot a series of
small steps. However, once high enough numbers are reached, the rate of increase would
appear to be smooth because the steps are so small.
On the other hand, biomass increases as a continuous function (except on the molecu-
lar level). Thus, biomass is theoretically more amenable than cell number to mathematical
expression and is the focus of our discussion. In practice, howe ver, it is also usually perfectly
acceptable to use the same sorts of expressions with N, except when counts are very low.
Rather than biomass itself, more commonly it is biomass concentration ðXÞ that is
considered. This typically might be on a mass per volume basis for liquid s (e.g., mg/L
in water or media) and gases (mg/m
3
of air), or on a mass per mass basis for solids
(mg/kg of soil or sludge).
0.1 1 10 100
Escherichia coli
Bacillus subtilis
Clostridium botulinum
Rhodospirullum rubrum
Anabaena cylindrica
Nitrobacter winogradsky
Scenedesmus quadricauda
Asterionella formosa
Euglena gracilis
Ceratium tripos
Tetrahymena geleii
Paramecium caudatum
Leishmania donovani
Giardia lamblia
Saccharomyces cerevisiae
Monilinia fructicola
Generation Time (hrs)
Fungi
Algae
Protozoa
Bacteria
Fungi
Algae
Protozoa
Bacteria
Figure 11.19 Representative microbial generation times under optimal conditions.
GROWTH 317