Vaccari D.A., Strom P.F., Alleman J.E. Environmental Biology for Engineers and Scientists
Подождите немного. Документ загружается.

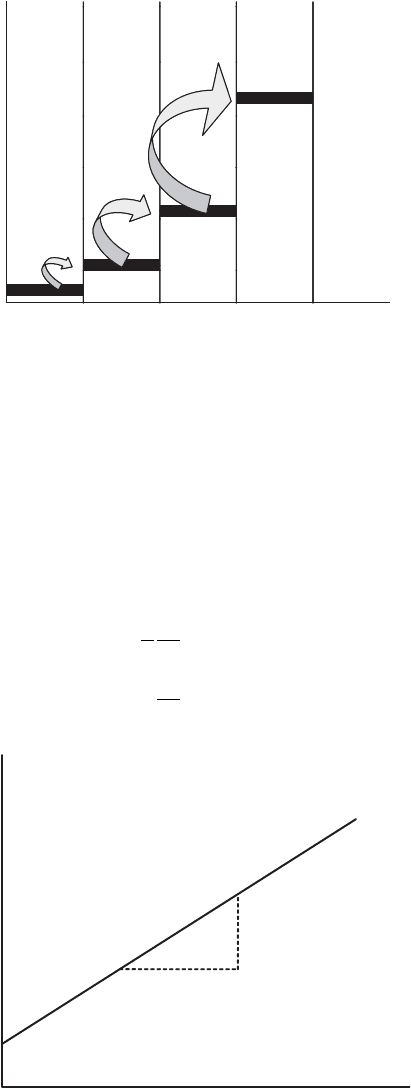
If the logarithm of X is plotted vs. time ðtÞ for an exponentially growing culture, a
straight line results (Figure 11.21). Using natural logarithms (log
e
, or ln), the equation
for a straight line then gives
ln X
t
¼ mt þ ln X
0
ð11:1Þ
where X
t
is the value of X at time t, m is the slope of the line, and X
0
is the starting value of
X (at time 0). Differentiating equation (11.1) (assuming that m is constant):
1
X
dX
dt
¼ m ð11:2Þ
dX
dt
¼ mX ð11:3Þ
Cell Number
Time
Figure 11.20 Theoretical stair-stepped batch bacterial growth curve.
Time
ln X
ln X
0
µ
0
Figure 11.21 Similar plot of exponential growth.
318
QUANTIFYING MICROORGANISMS AND THEIR ACTIVITY

From equation (11.2) it can be seen that m is equal to the rate at which the biomass
concentration is growing, divided by the biomass conce ntration at that time. Therefore,
m is referred to as the specific growth rate and has units of time
1
(inverse time, or
‘‘per time’’). Growth rates are typically expressed per minute or per hour for bacteria
in the laboratory, but more often per day in environmental systems and for other micro-
organisms, since growth rates are lower.
Returning to equation (11.1) and rearranging yileds
ln X
t
ln X
0
¼ mt
ln
X
t
X
0
¼ mt
Exponentiating each side gives
e
lnðX
t
=X
0
Þ
¼ e
mt
X
t
X
0
¼ e
mt
X
t
¼ X
0
e
mt
ð11:4Þ
There are thus three forms of the exponential growth equation: the differential form
[equation (11.3)]; the logarithmic form [equation (11.1), which gives a straight line on a
semilog plot]; and the exponential form [equation (11.4), useful for calculating the bio-
mass concentration at a time in the near future].
Equation (11.3) is the most fundamental form of the three. This is because, unlike the
other two, it is not dependent on an assumption that m is constant. It simply states that the
rate of biomass increase is proportional to the specific growth rate and to the current
amount of biomass.
Assuming again that m is constant, suppose that we look at X
t
after one doubling time,
when it would have doubled from its starting value to 2X
0
:
X
t
¼ 2X
0
¼ X
0
e
mt
d
2 ¼ e
mt
d
ln 2 ¼ mt
d
Thus, the relationship between specific growth rate and doubling time is
m ¼
ln 2
t
d
ð11:5Þ
At the minimum doubling time, the maximum specific growth rate will be achieved.
The symbol
^
mm (read ‘‘mu-hat’’) or m
max
is commonly used for this term. Using E. coli’s
minimum t
d
value of 20 min, for example:
^
mm ¼
ln 2
20 min
60 min
1h
¼
3ln2
1h
¼ 2:08 h
1
¼ 50 day
1
GROWTH 319

Example 11.6 What is the meaning of the specific growth rate, m?
Answer It is the rate of change of biomass concentration in a batch culture (one with
no inflow or outflow) at any instant, divided by the concentration at that point in time
[equation (11.2)]. Suppose that m ¼ 0:05 h
1
in a culture that at a certain time has a
concentration of 100 mg/L. From equation (11.3):
dX
dt
¼ mX ¼ 0:05 h
1
100 mg=L ¼ 5mg=L h
In other words, at that instant, the concentration would be increasing at the rate of 5 mg/L
per hour. At a later time, the concentration might reach 200 mg/L, and then
dX
dt
¼ mX ¼
0:05
h
200
mg
L
¼ 10
mg
L h
So, as the concentration increased, the rate of increase also increased, even though the
specific growth rate itself did not change.
The doubling time is easily computed from m by rearranging equation (11.5):
t
d
¼
ln 2
m
¼
0:693
0:05 h
1
¼ 13:86 h
Using equation (11.4), the biomas s concentration at a future time for an exponentially
growing culture can be calculated based on the present concentration and the specific
growth rate. As an example, starting with a single cell with a mass of 10
12
gin1L
of medium, and using the maximum specific growth rate of E. coli, after 10 hours the
biomass concentration would be
X
t
¼ X
0
e
mt
¼ 10
12
g=L e
ð2:08=hÞð10 hÞ
1mg=L
However, this equation predicts that after 2 days, the biomass of the same culture would
be 2 10
31
g, or 2 10
25
metric tons. This is about 4000 times the mass of Earth;
obviously, this exponential growth model has its limits! In the next section we show
how an improved model can be developed.
11.7.2 Batch Growth Curve
A batch system is one in which all nutrients are present at the beginning and are not
resupplied—there is no inflow or outflow, except perhaps for aeration. The flask of med-
ium above in which E. coli was growing is a good example. In nature, a fresh deposit of
cow manure on soil or the death of a fish in a pond would represent ‘‘batches’’ of nutrients
made available at one time.
As the E. coli example demonstrated, exponential growth cannot continue for very long
in a batch system. Depletion of substrates and/or buildup of inhibitory products will soon
lead to decreasing specific growth rates. Thus, much of the time, microorganisms are
likely to be growing at rates that are far below their
^
mm value. Equation (11.3) can still
be used to describe this curve, but since m 6¼ constant, it can no longer be integrated to
give equations (11.1) and (11.4) .
320 QUANTIFYING MICROORGANISMS AND THEIR ACTIVITY
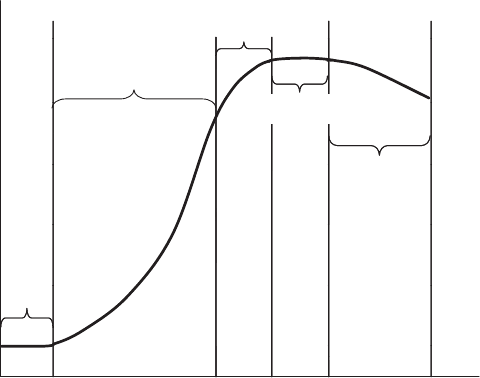
Figure 11.22 shows a typical growth curve for a newly inoculated batch laboratory cul-
ture. For convenience, it can be broken up into the five phases shown and is discussed
below. A similar response would be expected for other batch cultures.
Lag Phase The transfer of a small inoculum of ‘‘seed’’ cells into a fresh batch of med-
ium generally involves new conditions for the organisms, such as different organic sub-
strates, form of nitrogen, pH, oxygen tension, and/or salt concentration. It will frequently
take some time, referred to as a lag, for the cells to become adapted to this new environ-
ment before they start growing exponentially. This may involve production of enzymes to
metabolize new organic substrates or utilize nutrients in another form, or simply replace-
ment of cell constituents that had been depleted previously. Depending on how big a
change is required and how rapidly the organism can respond, the lag period may vary
from seconds to many hours.
Some scientists differentiate between a lag period, during which there is no growth
ðm ¼ 0Þ, and the lag phase, which lasts until exponential growth begins. For a short
time between these two points, the culture may appear to be growing at a rate that is linear
in a plot of X vs. t. This sometimes is referred to as an arithmetic growth phase.How-
ever, it should be noted that increases in biomass during exponential growth start off very
slowly, and unless very precise and sensitive measurements are made, this may mimic a
lag or arithmetic growth period.
Exponential Growth Phase If an appropriate medium has been provided, once the
organisms adapt to their new environment they will grow exponentially (m ¼ c, where
c is a constant greater than 0). Plenty of substrate and nutrients are available, and no harm-
ful products of metabolism have yet accumulated. Thus, m will approach the maximum
specific growth rate
^
mm for the organism in that particular environment (in Section
11.7.6 we discuss some factors that affect
^
mm). However, this phase can last for only a
relatively short period of time before the ideal conditions deteriorate.
Cell Density
Time
Lag
Declining
Rate of Growth
Exponential
Growth
Decay
Stationary
Figure 11.22 Typical batch bacterial growth curve.
GROWTH 321
Declining Rate of Growth Phase An old adage states that ‘‘all good things must come
to an end,’’ and this certainly applies to unrestricted growth within a batch reactor. Even-
tually, one or more factors (usually, substrate depletion, but perhaps product buildup, pH
shift, nutrient deficiency, and/or something else) trigger an inevitable decline in cell
growth rate. Biomass still increases, but at a continually decreasing rate (m > 0, but
decreasing).
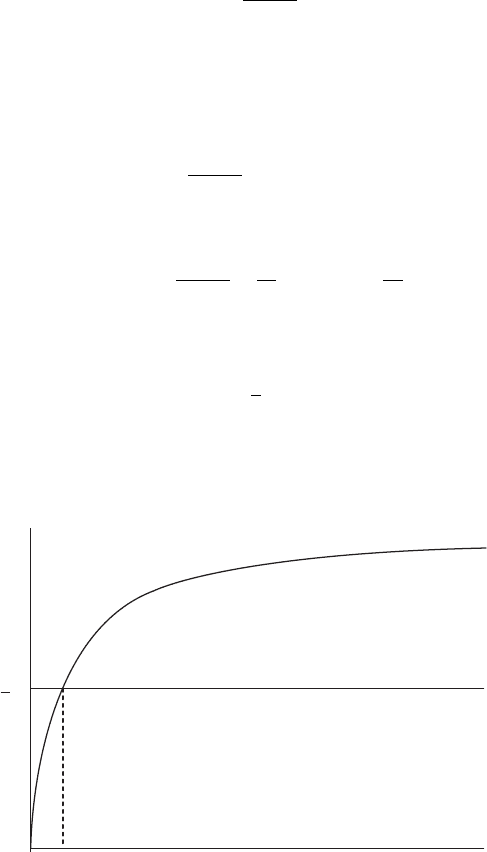
Most oft en this decrease in m is the resu lt of substrate depletion. This is commonly
modeled by Monod kinetics, in which
m ¼
^
mm
S
S þ K
s
ð11:6Þ
where S is the substrate concentration (mg/L) and K
S
is the half-saturation coefficient
(mg/L). The half-saturation coefficient is the substrate concentration that allows for
half of the maximum specific growth rate, as can be seen in Figure 11.23. At high sub-
strate concentrations,
ðS K
s
Þ;
S
S þ K
s
1; and m
^
mm ð11: 7Þ
At low substrate concentrations,
ðS K
s
Þ;
S
S þ K
s
S
K
s
; so m
^
mm
K
s
S ð11:8Þ
When S ¼ K
s
,
m ¼
1
2
^
mm ð11:9Þ
At low S [equation (11.8)], the Monod expression approaches first order; that is, the
rate is proportional to S to the first power ðS
1
¼ SÞ. Because S is often low in environmental
0
S
K
s
µ
ˆ
2
1
µ
ˆ
µ
Figure 11.23 Monod kinetics.
322
QUANTIFYING MICROORGANISMS AND THEIR ACTIVITY

systems, growth-related kinetic expressions are sometimes approximated by first-order
equations of the form kS, where k is a constant for that system. However, at high substrate
concentrations [equation (11.7) ], Monod kinetics approach zero order (since S
0
¼ 1, the
rate is unaffected by substrate concentration). Table 11.5 provides some half-saturation
and othe r coefficients. (Although the discussion so far has focused on the carbon and
energy source as the limiting nutrient, the same approach can be used for other require-
ments, such as dissolved oxygen, as indicated in the table; see ‘‘Multiple Substrates’’ in
Section 11.7.4.)
Note that the Monod equation has the same form as the Michaelis–Menten equation
used to describe enzyme kinetics (Section 5.3.1). However, unlike Michaelis–Menten
kinetics for enzymes, which can be derived from fundamental chemical kinetic principles,
the Monod expression for growth is empirical— an approximate fit to observed results.
Example 11.7 Assuming that an organism grows according to Monod kinetics with a
maximum growth rate of 10 per day and a half-saturation coefficient of 5 mg/L, how
fast would it be growing if the substrate concentration were 100 mg/L? What if it dropped
to 20 mg/L?
Answer At S ¼ 100 mg/L:
m ¼
^
mm
S
K
S
þ S
¼ 10 day
1
100
5 þ 100
¼ 10
100
105
¼ 9:52 day
1
TABLE 11.5 Examples of Monod Kinetic Coefficients
a
T
^
mm K
s
K
DO
Yb
Organism Substrate
b
(
C) (day
1
) (mg/L) (mg/L) (day
1
)
Mixed heterotrophic Sewage COD 20 6 20 0.2 0.67 0.05
bacteria
Mixed heterotrophic Monoethanol amine 20 8.8 9 0.5 0.03
bacteria
Sphaerotilus natans Glucose 20 6.5 10 0.01 0.53 0.05
Citrobacter sp. Glucose 20 9.2 5 0.15 0.55 0.15
Escherichia coli Glucose 37 35 2
Lactose 37 20 20
Pseudomonas putida Benzene 20 8.4 0.4 1.2
c
0.5
Toluene 20 8.9 0.2 1.3
c
1.4
Ammonium-oxidizing Ammonium-N 20 0.8 1.0 0.5 0.24
d
n.a.
d
bacteria
Nitrite-oxidizing Nitrite-N 20 0.8 1.3 0.7
bacteria
a
^
mm, maximum growth rate at indicated temperature ðTÞ; K
s
, half-saturation coefficient for the energy source; K
DO
,
half-saturation coefficient for dissolved oxygen; Y, yield (COD basis); b, decay coefficient.
b
Substrate used as energy source. COD, chemical oxygen demand (see Section 13.1.3).
c
Note that yields can be greater than 1.0, since during growth the organism incorporates oxygen and nutrients as
well as the benzene or toluene carbon and hydrogen.
d
Based on International Association on Water’s Activated Sludge Model No. 1 (ASM1); ASM1 lumps
ammonium oxidation with nitrite oxidation. A typical value for the decay coefficient for autotrophs was not
available.
GROWTH
323

At S ¼ 20 mg/L:
m ¼
^
mm
S
K
S
þ S
¼ 10 day
1
20
5 þ 20
¼ 10
20
25
¼ 8:00 day
1
Note that the growth rate is over 95% of the maximum with 100 mg/L of substrate, and is
still 80% of the maximum when the substrate concentration is 20 mg/L.
Stationary Phase Once the substrate is sufficiently depleted, growth nearly stops
ðm 0Þ. This plateau in biomass concentration is referred to as the stationary phase.
Actually, the cells may still be growing slowly, but this is counterbalanced by the loss
in mass through decay (the next phase).
Decay Phase If a pers on stops eating, he or she gradually loses weight. This is also true
of microorganisms. Their mass decreases, or decay occurs, if substrate is unavailable. The
cell continues to carry on some metabolic proce sses, and if there are no external sources
of energy, it must utilize internal ones. This is calle d endogenous metabolism. It will at
first be based on storage materials but will then progress to include nonessential cell com-
ponents, and eventually, essential ones. (The need to regenerate these components can be
one cause of a lag phase when organisms from an old culture are transferred to fresh med-
ium.) At some point, sufficient damage may be done so that the cell cannot recover and is
thus no longer viable.
Energy is also used for cell maintenance during growth. Thus, the observed or net
specific growth rate ðm
n
Þ actually represents a higher true growth rate combined with
some decay. Decay is often modeled as a first-order reaction with respect to biomass,
with the decay coefficient constant for a given system. In the past, the symbol k
d
was
often used for this coefficient, but now b is more common, so that
m
n
¼ m b ð11:10Þ
Like growth rate, the decay coefficient has units of inverse time. Although it can
vary considerably, in many wastewater treatment and other systems the decay coefficient
may have a value of around 0.05 day
1
. This means that about 5% of the biomas s
will decay away each day. [Actually, the amount that decays in 1 day is
ð1 e
ð1 day Þð0:05 day
1
Þ
Þ100% ¼ 4:88%. This is less than 5% becau se as the amount
of biomass present decreases, so does the amount that decays.]
Specialized resting stages, such as spores or cysts, can be formed by some microorgan-
isms. By greatly slowing down cell metabo lism, they decr ease decay rates, sometimes
very dramatically.
Overall Equation The growth equation (11.3) can now be rewritten incorporating
Monod kinetics [equation (11.6)] and decay [equation (11.10)]:
dX
dt
¼ m
n
X
¼ðm b ÞX
¼
^
mm
S
S þ K
s
b
X ð11:11Þ
324 QUANTIFYING MICROORGANISMS AND THEIR ACTIVITY
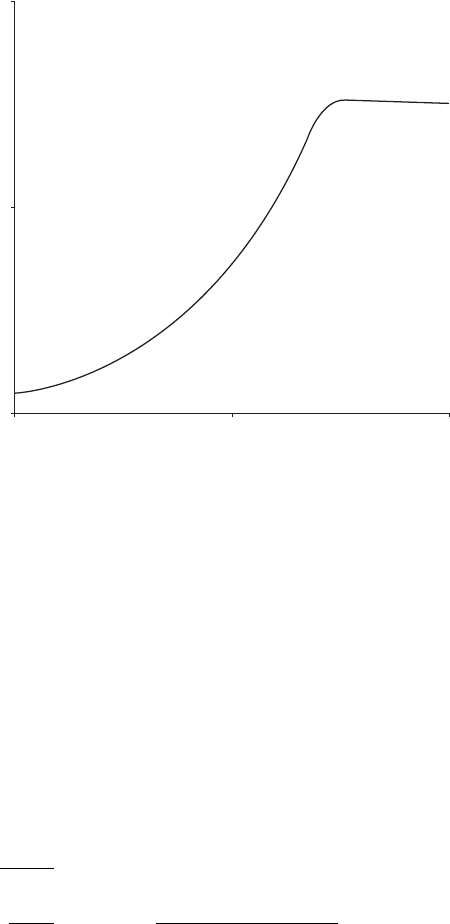
This expression will approximate the batch growth curve after the lag phase. The expo-
nential phase occurs when S K
s
, so that m
^
mm. As substrate is depleted, m decreases
and the culture enters the declining growth rate phase. Once m b, then m
n
0 and the
culture enters stationary phase. Finally, as S decreases further, m < b, so that m
n
< 0 and
the decay phase occurs. An example is shown in Figure 11.24.
Example 11.8 If
^
mm ¼ 10 day
1
, K
s
¼ 5 mg/L, and b ¼ 0:05 day
1
, at what substrate
concentration will net growth equal zero?
Answer
m
n
¼
^
mm
S
S þ K
s
b ¼ 0
S ¼ K
s
b
^
mm b
¼ 5mg=L
0:05 day
1
10 day
1
0:05 day
1
¼ 0:025 mg=L
If the substrate concentration falls below this value, the culture will be in the endogen-
ous phase.
11.7.3 Death, Viability, and Cryptic Growth
In Section 11.7.2 we described the batch growth curve based on biomass (Figure 11.22). If
cell numbers are used instea d, the curve will have a similar shape. However, cell number
0
50
100
0510
Time (hours)
Biomass Concentration (mg/L)
Figure 11.24 Batch growth curve using equation (11.11), with
^
mm ¼ 10 day
1
, K
s
¼ 5 mg/L,
Y ¼ 0:6 (explained below), b ¼ 0:1 day
1
, and starting values of S and X ¼ 120 and 5 mg/L,
respectively.
GROWTH 325

does not decrease because of decay. It will, on the other hand, decrease as a result of cell
death. Thus, this final phase is also sometimes referred to as the death phase.
Note that as decay does not necessarily lead to death, so death, or loss of viability, does
not necessarily lead to decay. Also like decay, death does not necessarily occur only in the
final phase; rather, it becomes more apparent there because it is not masked by high
growth rates. Despite these similarities, the mechanisms of death (such as predation,
lysis, acute toxicity, and lethal mutations) and decay are potentially very different.
When using biomass as a measure of microorganism concentration, viability may be of
importance (although it is often ignored). In this sense, viability refers to the fraction or
percent of the biomass that is still ‘‘alive,’’ or capable of growth. Thus, if we consider X
L
as the living biomass and X
D
as the dead biomass, the total biomass ðX
T
Þ and viability ðvÞ
will be
X
T
¼ X
L
þ X
D
v ¼
X
L
X
T
ð11:12Þ
The ‘‘growth’’ equation for each fraction can be considered using the same subscripts
for the coefficients (although only m
L
is a real growth rate). First, the rate of change of the
concentration of the living organisms is dependent on their rate of growth minus their rate
of death:
dX
L
dt
¼ m
L
X
L
m
D
X
L
The rate of change of the concentration of the dead biom ass is dependent on the rate of
formation from the death of living cells:
dX
D
dt
¼ m
D
X
L
What is typically observed is the rate of change of the total biomass:
dX
T
dt
¼ m
T
X
T
ð11:13Þ
However, the rate of change of the total biomas s can also be expressed as the sum of the
rates for the two fractions:
dX
T
dt
¼
dX
L
dt
þ
dX
D
dt
¼ m
L
X
L
ð11:14Þ
The right-hand side of equation (11.14) also makes sense, in that only the living organ-
isms can grow to produce more total biomass. However, this means that equations (11.13)
and (11.14) can be set equal:
m
T
X
T
¼ m
L
X
L
or m
T
¼ m
L
X
L
X
T
ð11:15Þ
326 QUANTIFYING MICROORGANISMS AND THEIR ACTIVITY

Substituting in equation (11.12) yields
m
T
¼ vm
L
Thus, the growth rate observed for the total biomass of a culture with a 10% viability is
only 10% of the actual growth rate of the living organisms. This means that the living
organisms are in fact growing 10 times faster than the apparent overall growth rate,
in order to produce all of both the living and the dead biomass.
If cells die and lyse (or lyse and die), their cell constituents become available as
substrates for other microorganisms. This is sometimes referred to as cryptic growth.
11.7.4 Substrate Utilization
In many cases, to the environmental engineer and scientist it might actually be the sub-
strate that is of greater direct concern than the microorganisms. For example, in biological
wastewater treatment, the ‘‘substrates’’ are the constituents of the waste that are to be
removed. Similarly, in polluted aquifers or streams, the contaminants may be the sub-
strates. In such cases, the growth of the microorganisms themselves may be of only
secondary interest.
Microorganisms may utilize substrates as a source of cellular constituents, to supply
energy, and/or as an electron acceptor. Thus, the rate of substrate utilization often is con-
sidered to be proportional to the rate of growth:
dS
dt
/mX ð11:16Þ
where the negative sign indicates that substrate is decreasing and the Monod expression
[equation (11.6)] is frequently used for m.
Yield Coefficient The proportionality coefficient for equation (11.16) is called the yield,
Y. It is often reasonable to expect that for a given amount of substrate utilized, a given
amount of biomass can be formed. Thus, Y has units of biomass produced per mass of
substrate utilized, and the equation can be rewritten as
dS
dt
¼
m
Y
X ð11:17Þ
The expression m=Y, referred to as the specific substrate utilization rate, is given the
symbol U, or sometimes k or q:
U ¼
m
Y
ð11:18Þ
Using Monod kinetics gives
dS
dt
¼
^
mm
Y
S
S þ K
s
X
GROWTH 327