Vaccari D.A., Strom P.F., Alleman J.E. Environmental Biology for Engineers and Scientists
Подождите немного. Документ загружается.


Since both
^
mm and Y are considered to be constants for a specific system, we also can define
a new coefficient, the maximum specific substrate utilization rate:
U
max
¼
^
mm
Y
The value of Y can vary tremendously, depending on both the substrate and the micro-
organism. For many carbohydrates, common heterotrophic bacteria have yields of about 0.5
to 0.6 g of dry biomass produced per gram of carbohydrate utilized. A yield value can be
greater than 1.0, and in fact typically is so for hydrocarbons as well as for the oxygen used
as an electron acceptor. On the other hand, the yield for an autolithotrophic nitrifying bac-
teria growing on nitrite may be 0.05 or less. Various units may also be used; for example,
the biomas s and organic substrate could be expressed on a basis of dry weight, carbon, or
chemical oxygen demand (see Section 13.1.3).
The yield described here is the true yield. The observed yield or actual amount of
biomass production will be lower. This is because some of the biomass produced will
be lost through decay. On the other hand, some of the substrate removed may simply
be adsorbed, or even precipitated, rather than utilized. For this reason, some prefer the
term specific substrate removal rate,orspecific substrate uptake rate, rather than
utilization.
Equation (11.18) can be rearranged as m ¼ Y
U
. Subtracting b from both sides and
remembering that m b ¼ m
n
gives
m
n
¼ YU b ð11:19Þ
Multiple Substrates It is common to focus on one substrate when examining microbial
growth. In reality, of course, organisms need many substrates: an energy source; an
electron acceptor; sources of carbon, nitrogen, phosphorus, and all the other essential
elements; and perhaps organic growth factors. Most of these will normally be present
in great excess of microbial needs, and hence can be ignored. Baron Justus von Liebig
noted this for plants in 1840, leading to Liebig’s law of the minimum: that the nutrient
in shortest supply will limit growth. For microorganisms, Monod kinetics (discussed
in Section 11.7.2) are generally used to describe this common situation, in which one
substrate is or becomes limiting. However, what if the concentrations of two (or more)
substrates are sufficiently low that they both will limit the amount and rate of growth?
One empirical approach used to describe this problem is an interactive, multiplicative
Monod model. For the case of two potentially limit ing substrates, A and B:
m ¼
^
mm
S
A
S
A
þ K
A
S
B
S
B
þ K
B
ð11:20Þ
Additional substrate terms can be added in the same way, as needed. Note that if
S
B
K
B
, the second term approaches 1, and the equation reduces to the basic Monod
expression [equation (11.6)]. This can be used to give a quantitative definition to the
term limiting substrate, as one that is not present in sufficient concentr ation to allow
growth at more than some percentage (perhaps 90 or 95%) of the maximum rate.
328 QUANTIFYING MICROORGANISMS AND THEIR ACTIVITY

Example 11.9 Suppose that a particular microorganism’s growth can be described using
the multiplicative Monod model. Given the substrate concentrations and kinetic coeffi-
cients below, what would its growth rate be? Would either of the substrates be considered
limiting (using <90% of the maximum rate as the criterion)?
Answer
S
1
¼ 25 mg=L glucose
S
2
¼ 10 mg=L ammonium-N
K
1
¼ 5:0mg=L
K
2
¼ 0:50 mg=L
^
mm ¼ 6 :0 day
1
m ¼
^
mm
S
1
K
1
þ S
1
S
2
K
2
þ S
2
¼ 6:0
25
5:0 þ 25
10
0:50 þ 10
¼ð6:0Þð0:833Þð0:952Þ¼4:8 day
1
The glucose concentration allows growth at only 83% of the maximum (limiting by the
stated criterion), whereas the ammonium-N concentration allows growth at 95% of the
maximum (not limiting, even though it is at a lower concentration than the gluc ose).
Equation (11.20) for microbial growth has the same form as equation (5.38), which
described enzyme kinetics for two substrates. However, whereas the enzymatic equation
is mechanistic (derived from enzyme kinetics), the growth equation is again empirical.
A somewhat different problem is the presence of multiple substrates fulfilling the same
nutritional need. In laboratory systems, microbiologists are able to study the uptake of a
single substrate by a pure culture of bacteria. However, in most environmental systems,
there are likely to be several utilizable organic substances present, for example, and
perhaps several electron acceptors and nitrogen sources as well. Will an organism use
only one at a time, or two or more simultaneously?
This turns out to be a very complex question, and the answer depends on the specific
substrates and organism involved. On a practical level, this is often addressed by using some
single general measure of organic matter, such as BOD or COD (see Section 13.1.3),
rather than trying to account for the actual mechanisms involved. Electron acceptors
are more likely to be used sequentially, with oxygen preferred when it is available. Howe v er ,
the ability to use a specific electron acceptor depends on the particular organism.
Of course, there are usually many different microorganisms present as well, not a pure
culture of a single species. This, similarly, is commonly handled by using a general mea-
sure of biomass that lumps all or many different species together. Although these simpli-
fications severely compromise any mechanistic basis for the models used, they have still
been found in practice to provide useful information.
11.7.5 Continuous Culture and the Chemostat
Although some microbial systems can be represented as batches (Section 11.7.2), many
others have flows of material entering and leaving, includin g streams, lakes, groundwater
GROWTH 329
aquifers, and most biological wastewater treatment plants. Such continuous culture sys-
tems receive inputs of new substrates, but also lose substrates and even organisms in the
outflow. Thus, to model a continuous culture, in addition to knowing the reactions that are
occurring, it is necessary to keep track of the inputs to and outputs from the system. This
is usually done by means of a mass balance.
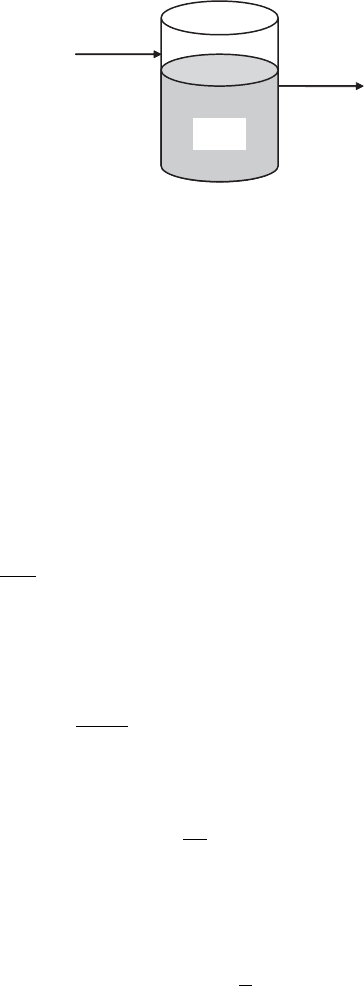
A general mass balance equation for a particular component, A, in a continuous flow
system (Figure 11.25) can be written as
rate of change of mass
A
in system ¼ðrate of mass
A
inputÞðrate of mass
A
outputÞ
þðrate of mass
A
production through reactionsÞ
or if M
A
is used for the mass of A and R
A
for the reaction term, then
dM
A
dt
¼ðrate of M
A
inputÞðrate of M
A
outputÞþR
A
For a continuous-flow ðQÞ system of volume V, in which concentration ðC ¼ M=VÞ of
component A is measured in the influent and effluent (subscripts i and e, respectively) this
can be expressed as
dðVCÞ
dt
¼ðQ
i
C
i
ÞðQ
e
C
e
ÞþðVR
C
Þð11:21Þ
Note that in a batch system, Q
i
¼ Q
e
¼ 0 and V ¼ constant, so that
dC
dt
¼ R
C
Thus, from equations (11.11) and (11.17), for biomass and substrate, respectively, we
see that
R
X
¼ m
n
X ð11:22Þ
R
S
¼
m
Y
X ð11:23Þ
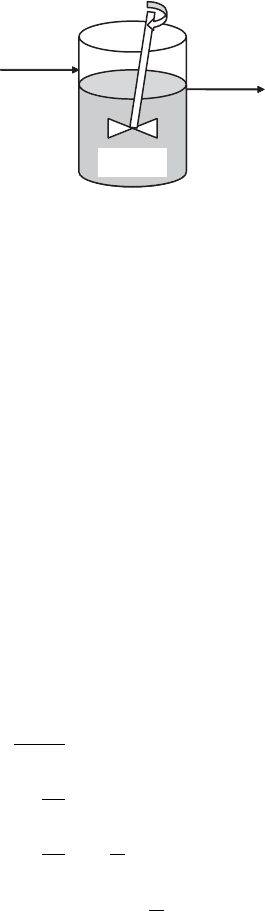
Chemostat One particular type of laboratory continuous culture system in which certain
constraints are imposed is known as a chemostat (Figure 11.26). It is of great utility as a
research tool but is also of interest because many observations about its functioning can be
generalized to other continuous culture systems, such as activated sludge wastewater
treatment.
Q
i
, C
i
Q
e
, C
e
V, C
Figure 11.25 Schematic of a continuous culture system.
330
QUANTIFYING MICROORGANISMS AND THEIR ACTIVITY
One requirement for a chemostat is that Q
i
¼ Q
e
¼ Q ¼ constant. If the influent and
effluent flows are equal and constant, the chemostat volume will also be constant. It is also
assumed that the substrate concentration in the influent ðS
i
Þ will be constant and that this
flow will contain no biomass ðX
i
¼ 0Þ.
Another require ment for a chemostat is that it must be completely mixed (indicated by
the ‘‘propeller’’ in Figure 11.26), so that the concentration of each constituent in every
drop of water in the reactor is equivalent to its concentration in every other drop. A con-
sequence of complete mixing is that the concentration in the effluent will be equal to the
concentration in the reactor ðX
e
¼ X; S
e
¼ SÞ, since a drop leaving the reactor is equiva-
lent to a drop inside the reactor. This means that if the influent concentration is 1000 mg/L
of substrate, for example, and the effluent concentration is 5 mg/L, the concentration
everywhere within the reactor is 5 mg/L. Thus, a microorganism in this reactor ‘‘sees’’
only 5 mg/L of substrate, never the 1000 mg/L being fed to it. This concept may seem
diffi cult to grasp at first, but keep in mind that every drop entering the reactor (at 1000 mg/L)
is instantaneously mixed and diluted throughout the reactor volume, and that further, the
substrate in it is being consumed by the microorganisms present.
The general mass balance equation [equation (11.21)] can now be rewritten for
biomass in the chemostat as
dðVXÞ
dt
¼ Q
i
X
i
Q
e
X
e
þ VR
X
V
dX
dt
¼ 0 QX þ Vm
n
X
dX
dt
¼
Q
V
X þ m
n
X
¼ m
n
Q
V
X
¼ðm
n
DÞX ð11:24Þ
where D ¼ Q=V: D has units of (tim e)
1
and is referred to as the dilution rate. It repre-
sents the number of times the contents of the reactor is replaced per unit of time. The
inverse of D, referred to as the hydraulic residence time (HRT), indicates the amount
of time the water (and hence any soluble materials) spends in the reactor. It is widely
used in environmental engineering and science for a variety of reactor types and systems
and is often represented by the symbol y, so that y ¼ V= Q ¼ 1=D.
X
i
= 0
S
i
Q
e
= Q
V, X, S
X
e
= X
S
e
= S
Q
i
= Q
Figure 11.26 Schematic of a chemostat.
GROWTH 331

For substrate, the mass balance equation is
dðVSÞ
dt
¼ Q
i
S
i
Q
e
S
e
þ VR
S
V
dS
dt
¼ QS
i
QS
e
V
m
Y
X
dS
dt
¼ DðS
i
S
e
Þ
m
Y
X
ð11:25Þ
One characteristic that makes the chemostat so interesting is that once it is inoculated
with microorganisms that can grow in the system and utilize the substrate, it will naturally
move toward a stable condition referr ed to as steady state. Steady state occurs when the
concentrations in the reactor no longer change, that is, when dX=dt ¼ 0 and dS=dt ¼ 0. If
the microorganisms grow faster ðdX=dt > 0Þ, the substrate concentration drops
ðdS=dt < 0Þ, and this slows the growth back down. If the growth is too slow
ðdX=dt < 0Þ, organisms wash out of the system faster than they are growing; this drop
in biomass allows the substrate to increase ðdS=dt > 0Þ, and this leads to faster growth.
Thus, the biomass concentration grows to the point at which it uses up substrate at the
same rate that it is added.
At steady state,
dX
dt
¼ðm
n
DÞX ¼ 0 ð11:26Þ
and X does not change. This can occur under two conditions: when m
n
D ¼ 0 ðm
n
¼ DÞ
or when X ¼ 0 (no biomass in the system). If X 6¼ 0, substituting for m
n
and using
~
SS for
the steady state value of S, gives
m
n
¼
^
mm
~
SS
~
SS þK
s
b ¼ D ð11:27Þ
Thus, for the steady-state chemostat reactor, the net growth rate is equal to the dilution
rate. Since D ¼ QN; the dilution rate can be controlled merely by controlling Q for a
given reactor volume. Thus, the biological growth rate can be controlled directly by the
chemostat operator. A similar relationship holds for some wastewater treatment processes,
such as activated sludge (Section 16.1.3), in which the net growth rate can be control led
by the amount of sludge wasting. This gives the process operator a means of direct control
over the biology of the process.
Equation (11.27) can be solved for the effluent substrate concentration:
~
SS ¼
K
S
ðD þ bÞ
^
mm ðD þ bÞ
ð11:28Þ
Note that since
~
SS is a function of only constants, it too must be a constant, confirming
that dS=dt ¼ 0:
dS
dt
¼ DðS
i
~
SSÞ
m
Y
~
XX
¼ 0
332 QUANTIFYING MICROORGANISMS AND THEIR ACTIVITY
Solving for
~
XX gives
~
XX ¼
DðS
i
~
SSÞY
m
However, at steady state, m
n
¼ m b ¼ D (if
~
XX 6¼ 0), so m ¼ D þ b. Substitution
then gives
~
XX ¼
DðS
i
~
SSÞY
D þ b
ð11:29Þ
Considering equation (11.26) and its meaning shows one value of the chemostat as a
research tool. Once set up and inoculated, a chemostat will automatically run to a steady
state in which X and S will be constant. If the setup conditions are reasonable, so that
~
XX 6¼ 0, the net growth rate will be equal to the dilution rate ðm
n
¼ DÞ. Since D ¼ Q=V,
this means that any desired growth rate up to almost
^
mm can be chosen simply by adjusting
the flow rate ðQÞ in a reactor of constant volume V.
Equation (11.28) shows further that the steady-state value of substrate will depend on
the dilution rate but will be independent of the influent substrate concentration. A higher
S
i
leads to a higher steady-state biomass concentration
~
XX [equation (11.29)], not a higher
~
SS. Thus, by selecting Q, chemostat operators can select the effluent substrate concentra-
tion; then choosing the influent substrate conce ntration allows them to pick the biomass
concentration. This type of relationship holds true similarly for the activated sludge
process.
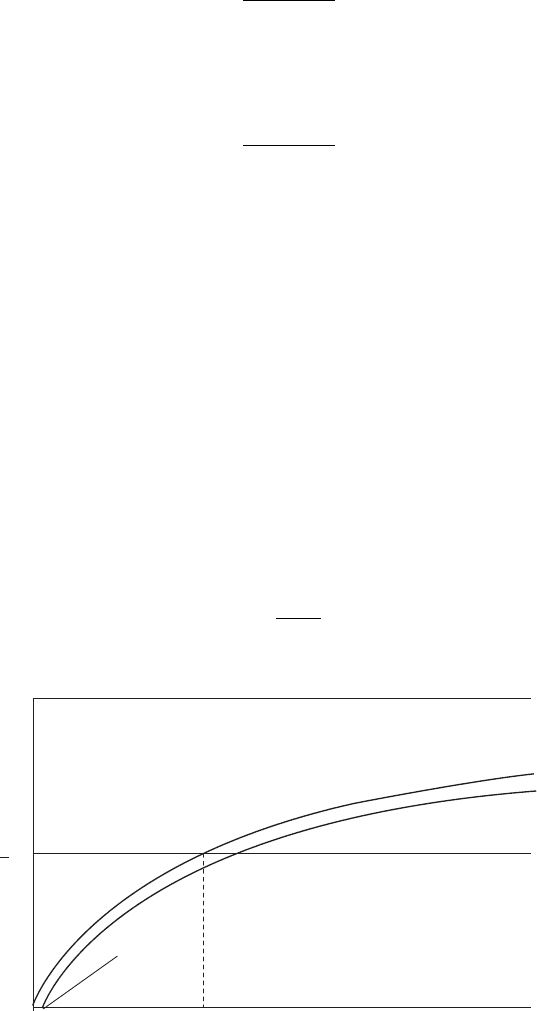
It is also possible to calcul ate a minimum steady-state substrate concentration ð
~
SS
min
Þ
that can be approached in a chemostat. This will occur when m
n
¼ D ¼ 0 (Fig ure 11.27).
Substituting into equation (11.28) yields
~
SS
min
¼
K
S
b
~
mm b
0
S
µ
ˆ
µ
ˆ
2
1
K
s
S
min
~
µ
D = µn = µ − b
Figure 11.27 Steady-state substrate minimum,
~
SS
min
, in a chemostat.
GROWTH 333
This value can only be approached, since if D ¼ 0, then Q ¼ 0, and the system becomes a
batch, not a chemostat.
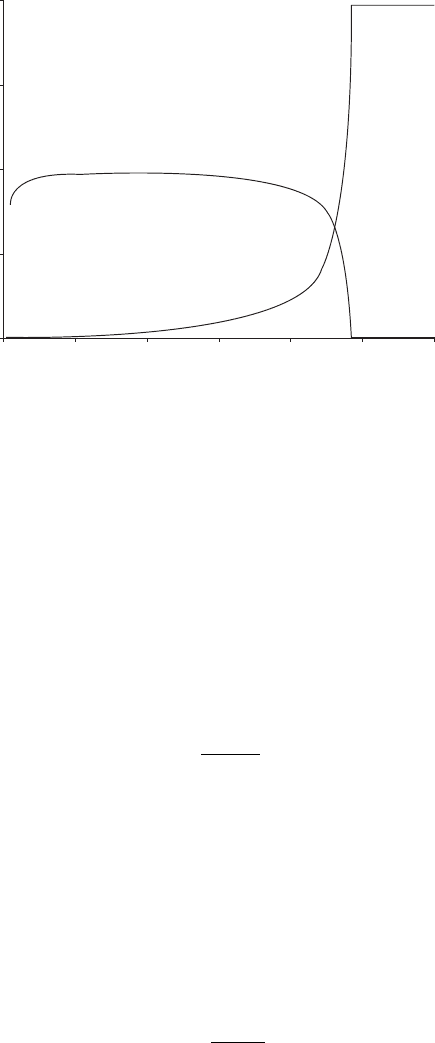
On the other hand, if D is too high, the organisms cannot grow fast enough to maintain
themselves in the reactor (Figure 11.28). At this critical dilution rate ðD
c
Þ, or washout
rate,
~
XX ¼ 0 and thus
~
SS ¼ S
i
. In other words, as D (and hence, growth rate) increases,
~
SS
also increases until it reaches the influent concentration. Since it cannot go any higher,
neither can growth rate, and the culture washes out. The highest net growth rate that
can be approached (at steady state) is thus
D
c
¼ m
n
¼
^
mm
S
i
S
i
þ K
s
b
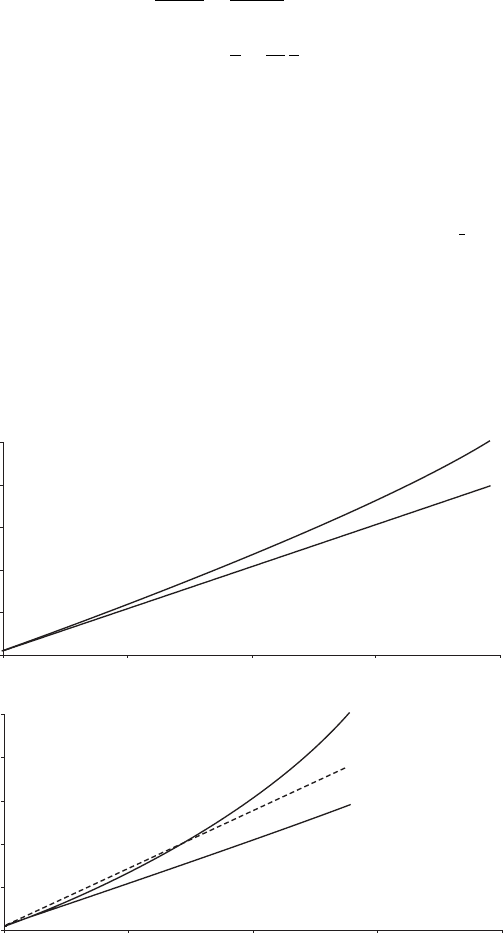
Determining Microbial Kinetic Coefficients in Chemostats One use of chemostats is
for determining the microbial kinetic coefficients
^
mm and K
s
. For this purpose, chemostats
are run several times at different dilution rates and the steady-state substrate concentration
is determined for each. A plot of
~
SS vs. D is then made (Figure 11.28). Note in the figure
that at values of D > D
c
,
~
XX ¼ 0 and
~
SS ¼ S
i
. Also, at low values of D, the importance of
decay ðbÞ leads to a decrease in
~
XX.
From the development of equation (11.28), we can see that
D þ b ¼
^
mm
~
SS
~
SS þK
s
ð11:30Þ
Such nonlinear equations are becoming readily usable on computers, but a traditional
linearization method, the Lineweaver–Bur ke plot, may still be useful to know. (It can
0
50
100
150
200
02468
D
c
10 12
D (da
y
−1
)
mg/L
X
~
S
~
Figure 11.28 Theoretical plots of
~
SS and
~
XX vs. D in a chemostat. Values used in equations (11.28)
and (11.29) were
^
mm ¼ 10 day
1
, K
s
¼ 5 mg/L, b ¼ 0:05 day
1
, Y ¼ 0:5, and S
i
¼ 200 mg=L.
334
QUANTIFYING MICROORGANISMS AND THEIR ACTIVITY
also be applied to data collected from batch cultures.) This involves inverting equation
(11.30):
1
D þ b
¼
~
SS þK
s
^
mm
~
SS
¼
1
^
mm
þ
K
s
^
mm
1
~
SS
ð11:31Þ
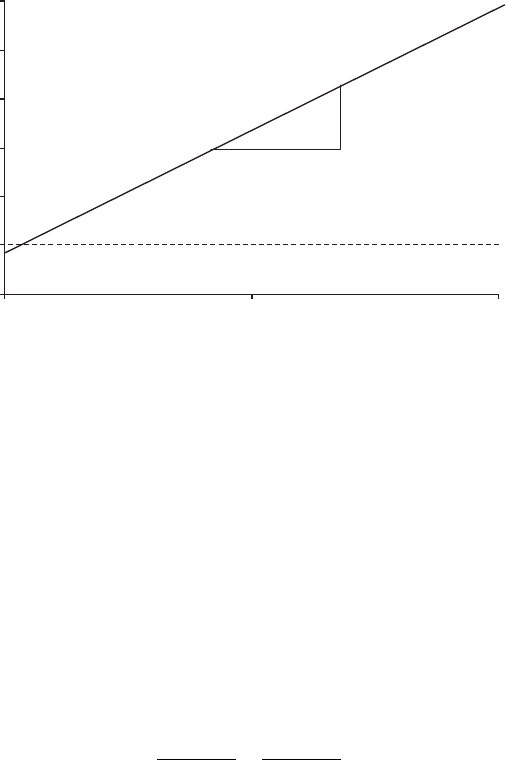
For values of D b, a plot of 1=D vs. 1=
~
SS now gives a straight line with an intercept
of 1=
^
mm and a slope of K
s
=
^
mm (Figure 11.29). The value of
^
mm is then obtained by taking the
inverse of the y-intercept value. K
s
can also be calculated from the slope once
^
mm is known;
however, for imperfect data with their variability, it is usually better (particularly if b is
not very small; see the ‘‘apparent slope’’ in Figure 11.29) to obtain it from the plot of
~
SS vs.
D (Figure 11.28). This is done by noting the D value that corresponds to
1
2
^
mm, then finding
the corresponding S value that gives this growth rate (by definition, K
s
). (To improve the
quality of the estimates of the coefficients obtained, the slope K
s
=
^
mm can then be calculated
and used to better draw the Lineweaver–Burke plot, with the new intercept giving a better
value of
^
mm, which can then be used in turn to better estimate K
s
from the plot of
~
SS vs. D.
After two or three iterations, the values will stabilize on the best estimate for the data.)
0
1
2
3
4
5
02468
0
1
2
3
4
5
02468
1/
S
(L/m
g
)
~
1/D
1/D
1/(D + b)
1/(D + b)
apparent
slope
(a)
(b)
1/D (day)
1/D (day)
Figure 11.29 Lineweaver–Burke plot. In part ðaÞ the same coefficients are used as in Figure 11.28
to generate the theoretical curves. In part ðbÞ the value of b ¼ 0:15, showing its effect on the
nonlinearity of the 1=D plot.
GROWTH 335
One criticism of the use of Lineweaver–Burke plots is that with some data they do not
give very good estimates of the coefficients (particular ly for K
s
values obtained from the
slope only rather than the
~
SS vs. D plot). Nonlinear regression is now a preferred approach
if sufficient data points have been collected.
The coefficients Y and b can also be found from chemostat data. Since m
n
¼ D in a
chemostat, we can rewrite equation (11.19) as
D ¼ YU b ð11:32Þ
Thus, by plotting D vs. U, Y (the slope) and b (the negative of the y -axis intercept) can be
determined (Figure 11.30). For this purpose, U can be determined as
U ¼
QðS
i
~
SSÞ
V
~
XX
¼
DðS
i
~
SSÞ
~
XX
11.7.6 Environmental Factors
In addition to the concentrations of various substrates, other environmental factors, such
as temperature, pH, pressure, moisture, and salinity, can clearly affect microbial growth.
These can be viewed as influencing the kinetic coefficients, such as
^
mm, K
s
, Y, and b, that
are used to describe growth and substrate utilization. (In fact, the observation that they
vary is the reason that they have been referred to in this chapter as coefficients, rather
than constants.) The effects of temperature and pH, which are usually the most important
such factors in systems of interest to environmental engineers and scientists, are discussed
briefly below.
Temperature As discussed in Chapter 10, microorganisms are capable of growth at a
wide variety of temperatures. However, each species has a particular minimum and max-
imum temperature at which it can grow, and an optimum temperature within that range.
−1
0
1
2
3
4
5
0510
U (m
g
substrate/m
g
biomass · da
y
)
D (day
−1
)
−b
Y
Figure 11.30 Determining Y and b. The same coefficients were used to generate the plot as in
Figure 11.28, except that b ¼ 0:15.
336
QUANTIFYING MICROORGANISMS AND THEIR ACTIVITY
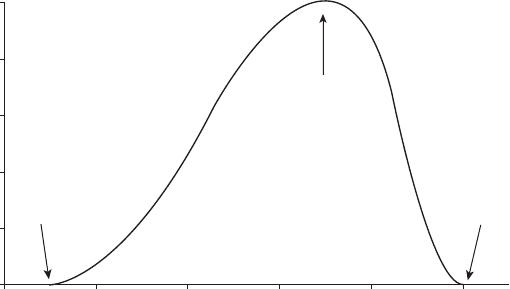
These three values are referred to as the organism’s cardinal temperatures (Figure 11.31).
The minimum temperature for growth probably represents the point at which the cell’s
lipid-rich membr anes become too rigid to be functional (somewhat like the increase in
viscosity of an automobile’s engine oil in winter), and/or reactions become too slow to
maintain esse ntial cell processes. The maximum temperat ure is reached when critical
cell components are destroye d; in most cases this results from the denaturation (loss
of three-dimensional structure) of proteins. The optimum usually is taken to be the tem-
perature giving the highest
^
mm value, but it can also refer to a slightly different temperature
(due to changes in yield or decay, for example) at which doubling time is shortest or
biomass accumulation is most rapid.
The minimum and maximum temperatures for growth may form a narrow band or be
widely separated. Similarly, growth rates may drop off rapidly as temperature departs
from the optimum, or there may be a broad plateau of nearly optimal temperatures. How-
ever, the optimum temperature is always closer to the maximum than it is to the mini-
mum. This is because increases in temperature will lead to increases in reaction rates,
speeding growth, up to the point at which the enzymes or other cell constituents become
unstable.
A common way to incorporate temperature effects into models is to use the following
approximation, which is derived from work by von Arrhenius in the nineteenth century.
Based on equation (5.48), the maximum specific growth rate
^
mm
T
at the temperature of
interest (T,in
C) is estimated from the rate
^
mm
20
at 20
Cas
^
mm
T
¼
^
mm
20
T20
ð11:33Þ
where is a dimensionless (no units) empirical coefficient, often taken to be 1.05 in the
absence of an experimentally derived value. A related rule of thumb that is sometimes
used is that reaction rates (and hence growth) will double for every 10
C increase in tem-
perature. This is called the Q
10
rule and corresponds to an value in equation (11.33) of
about 1.07. However, both of these approximations are suitable for mesophilic organisms
only at temperatures between their minimum and optimum; outside this range (such as
can occur in composting) they can give grossly misleading results.
0
2
4
6
8
10
01020304050
T (°C)
µ (
day
−1
)
minimum
maximum
optimum
Figure 11.31 Dependence of microbial growth on temperature for a hypothetical mesophile.
GROWTH 337