Velten K. Mathematical Modeling and Simulation: Introduction for Scientists and Engineers
Подождите немного. Документ загружается.


2.3 Multiple Linear Regression 75
column for the response variable y. We will refer here to the file volz.csv which
you find in the book software. The data in this file have been produced in a PhD
thesis which was concerned with the prediction of the wilting of roses [47]. More
precisely, the intention of this PhD thesis was to find out whether the wilting of
roses can be predicted based on the concentrations of certain carbohydrates within
a rose. If reliable predictions could be made in this way, then this could serve as a
base for the development of a practical tool for the quality control of roses produced
on a big scale. Opening
Volz.csv in Calc, you will see 19 columns of data. The
first 18 columns (
Conc1–Conc18) contain concentrations of various carbohydrates
measured at some particular time. The last column called
DegWilt characterizes
rose wilting, giving the number of days after the carbohydrate measurements until
a certain, fixed degree of wilting is observed (see [47] for details).
Now to treat these data using regression, we need an equation expressing the
response variable y (corresponding to
DegWilt) depending on the explanatory
variables x
1
, ..., x
18
(corresponding to Conc1–Conc18). A straightforward (linear)
generalization of Equation 2.27 is
ˆ
y(x
1
, x
2
, ..., x
18
) = a
0
+ a
1
x
1
+ a
2
x
2
+···+a
18
x
18
(2.44)
which is the simplest form of a multiple linear regression equation.
Note 2.3.1 (Multiple regression) Multiple regression functions
ˆ
y(x) compute
aresponsevariabley using explanatory variables x = (x
1
, ..., x
n
)(n > 1) and
regression coefficients a
0
, a
1
, ..., a
s
.If
ˆ
y(x) depends linearly on a
0
, a
1
, ..., a
s
,
it can be fitted to measurement data using multiple linear regression. See
Section 2.4 for multiple nonlinear regression.
Similar to Equation 2.41 above, the general form of a multiple linear regression
equation involving an arbitrary number of n ∈ N explanatory variables is
ˆ
y(x) = a
0
+ a
1
f
1
(x) +a
2
f
1
(x) +···+a
s
f
s
(x) (2.45)
where x = (x
1
, x
2
, ..., x
n
)
t
and the f
i
are arbitrary real functions. Note that this
regression equation is linear since it is linear in the regression coefficients
a
0
, ..., a
s
, although the f
i
may be nonlinear functions (compare the discussion of
the GAG data example in Section 2.2.6). For example, a regression function such as
ˆ
y(x
1
, x
2
) = a
0
+ a
1
x
1
+ a
2
x
2
+ a
3
x
2
+ a
4
y
2
+ a
5
xy (2.46)
can be treated using multiple linear regression since in this equation
ˆ
y is obtained
as a linear combination of the regression coeffcients a
0
, ..., a
5
, although it depends
nonlinearly on the explanatory variables, x and y.
Similar to the discussion of linear regression above, let us assume a general
datasetthatisgivenintheform(x
i1
, x
i2
, ..., x
in
, y
i
)or(x
i
, y
i
)wherei = 1, ..., m.

76 2 Phenomenological Models
Then, as before, the coefficients a
0
, a
1
, ..., a
s
of Equation 2.45 are determined from
the requirement that the differences
ˆ
y(x
i
) −y
i
should be small, which is again
expressed in terms of the minimization of the RSQ:
RSQ =
m
i=1
y
i
−
ˆ
y(x
i
)
2
(2.47)
min
a
0
,a
1
, ... ,a
n
∈R
RSQ (2.48)
2.3.2
Solution Using Software
To solve this problem using R, the same procedure can be used that was described
in Section 2.2 above. You can use the ‘‘Statistics/Fit models/Linear regression’’
menu option of the R Commander, selecting
Conc1,...,Conc18 as the explanatory
variables and
DegWilt as the response variable. Alternatively, you can use an R
program such as
LinRegEx2.r which you find in the book software. LinRegEx2.r
works very similarly to LinRegEx1.r which was discussed above in Section 2.2
(you will find a few remarks on
LinRegEx2.r further below). Either of these two
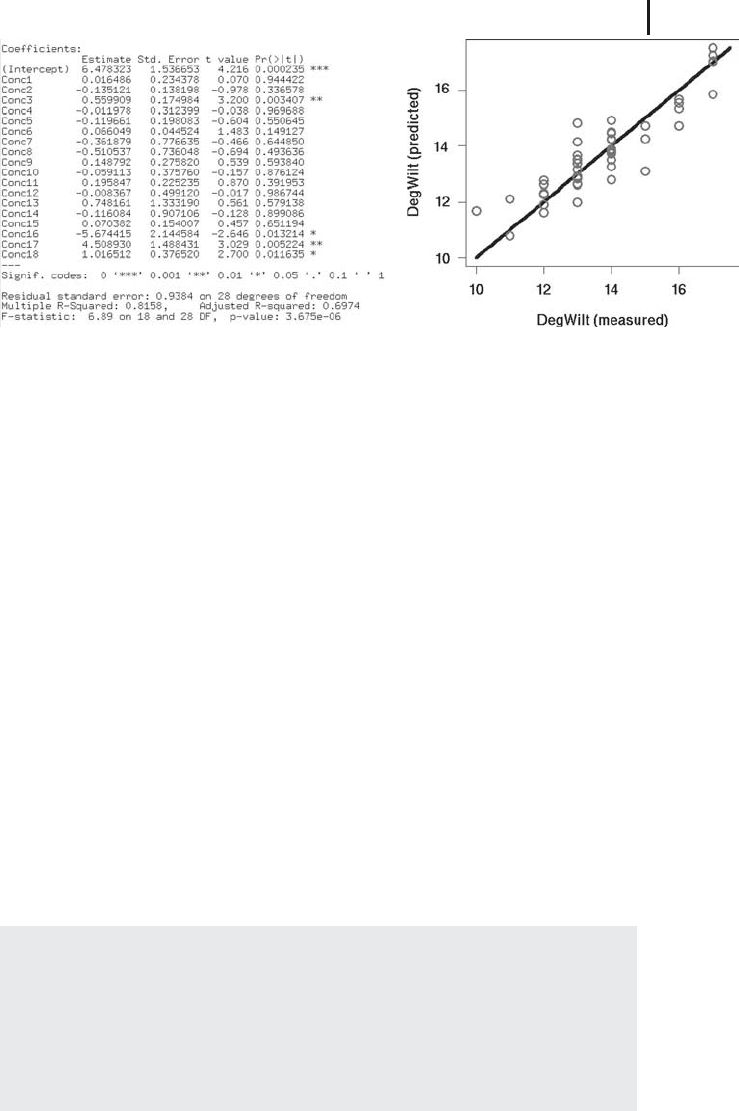
ways produces the result shown in Figure 2.4a.
The interpretation of Figure 2.4a goes along the same lines as the interpretation
of Figure 2.2 above. First of all, you find the estimates of the regression coeffi-
cients a
0
, a
1
, ..., a
18
in the Estimate column of Figure 2.4a: a
0
= 6.478323, a
1
=
0.016486, ..., a
18
= 1.016512. The regression equation 2.44 thus becomes:
ˆ
y(x
1
, x
2
, ..., x
18
) = 6.478323 + 0.016486x
1
+···+1.016512x
18
(2.49)
The regression coefficients a
0
, a
1
, ..., a
18
can be viewed as realizations of corre-
sponding random variables α
0
, α
1
, ..., α
18
,andthe‘‘Std. Error’’ and ‘‘t value’’
columns of Figure 2.4a report statistical properties of these random variables as
discussed in Section 2.2.4 above. Similar to Equation 2.36, this statistical analysis
is based on the assumption that the data can be expressed as follows:
y
i
= α
0
+ α
1
x
i1
+···+α
18
x
i18
+
i
, i = 1, ..., m (2.50)
Again, the error terms
i
are assumed to be homoscedastic (i.e. normally
distributed with zero expectation and a constant variance σ
2
).
Figure 2.4b compares the predicted and measured values of
DegWilt in a type of
plot which we call a predicted-measured plot. Note the difference between this figure
and Figure 2.2 in Section 2.2.2: Figure 2.2 plots the response variable against the
explanatory variable, while Figure 2.4b involves the response variable only. A plot of
the response variable against the explanatory variables similar to Figure 2.2 cannot
be done here since this would involve a 19-dimensional space (18 explanatory
variables +1 response variable). Figure 2.4b is an elegant way to get a graphical
2.3 Multiple Linear Regression 77
(b)(a)
Fig. 2.4 (a) Result of a multiple regression using R based
on the data
Volz.csv (response variable: DegWilt,ex-
planatory variables:
Conc1,Conc2,...). (b) Comparison of
predicted (
ˆ
y)andmeasured(y)valuesof
DegWilt.Thecir-
cles are at the coordinates (y
i
,
ˆ
y(x
i
)) (i = 1, ..., m), the line
is
ˆ
y = y. The figure was produced using
LinRegEx2.r.
idea about the quality of a regression even in the presence of a great number of
explanatory variables. As to the interpretation of Figure 2.4b, note that the line
ˆ
y = y displayed in the figure is not a regression line. Rather, it can be used to
assess the prediction error for each of the predicted values,
ˆ
y(x
i
). If
ˆ
y(x
i
)coincides
with the corresponding measurement value, y
i
,wewillhave
ˆ
y(x
i
) = y
i
and hence
this will generate a circle lying exactly on the line
ˆ
y = y. On the other hand, any
deviations between
ˆ
y(x
i
)andy
i
will generate corresponding deviations between
thecircle(y
i
,
ˆ
y(x
i
)) and the line
ˆ
y = y. Therefore, the data will lie very closely to
the line in such a predicted/measured plot if the regression equation matches the
data very well, and they will substantially deviate from that line if the regression
equation substantially deviates from the data. Figure 2.4b thus tells us that this
is an regression model of an average quality: some of the predictions match the
data very well, but predictions and measurements may also deviate by several
days. See also Figure 2.8 for a comparison of a conventional plot with a predicted
measured plot.
Note 2.3.2 (Predicted-measured plot) In a predicted-measured plot such as
Figure 2.4b, predicted values (
ˆ
y(x
i
)) of the response variable are plotted against
measured values (y
i
) of the response variable. Deviations between data and
predictions can thus be seen in terms of deviations from the line
ˆ
y = y.
Predicted-measured plots are particularly useful to evaluate regressions involving
more than two explanatory variables, since in that case the response variable
cannot be plotted against all explanatory variables.

78 2 Phenomenological Models
The average quality of this regression is also reflected by the coefficient of
determination shown in Figure 2.4a, R
2
= 0.8158. As explained in the previous
section, this means that about 20% of the variation of the measurement data are
not explained by the explanatory variables of the current regression model (see
Note 2.2.4). If we need better predictions, we should thus try to find additional
explanatory variables that could then be used in an extended multiple regression
model. Note that the data circles in Figure 2.4b follow lines parallel to the y-axis of
the plot since the degree of wilting is expressed using integers in
Volz.csv.
It can be shown that the R
2
value defined as in Equations 2.34 and 2.35
may increase as additional explanatory variables are incorporated into the model,
even if those additional variables do not improve the quality of the model [19].
Therefore, comparisons of R
2
values derived from regression models involving
different numbers of explanatory variables can be questionable. A standard way to
circumvent this problem is the use of the adjusted coefficient of determination,which
adjusts the R
2
value with respect to the number of variables and sample size [19].
The adjusted R
2
value appears in the linear regression results produced by R (see
Adjusted R-squared in Figure 2.4a).
The R program
LinRegEx2.r that was used to produce Figure 2.4b is again based
on R’s
lm command, and it works very similarly to the corresponding program
LinRegEx1.r that was discussed in Section 2.2.5 above. As was explained there,
the regression equation must be written based on the variable names that are
used in the data. In
Volz.csv, Conc1–Conc18 are the explanatory variables and
DegWilt is the response variable. In analogy to line 1 of program 2.37, the multiple
regression equation can thus be written as
eq=DegWilt~Conc1+Conc2+Conc3+ ...+Conc18
(2.51)
If you are using this kind of notation, all explanatory variables must be explicitly
written in the code, including
Conc4–Conc17 which were left out in Equation
2.51 for brevity. In
LinRegEx2.r, Equation 2.51 is written using the abbreviated
notation ‘‘
eq=DegWilt∼.’’. In this notation, the dot serves as a placeholder
that stands for all variables in the dataset except for the response variable. This
notation can be modified in various ways (see R’s help pages). For example,
‘‘
eq=DegWilt∼.-Conc17’’ results in a multiple regression model that uses all
explanatory variables except for
Conc17.
2.3.3
Cross-Validation
Although R
2
values and plots such as Figure 2.4b give us some idea regarding the
quality of a regression model, they cannot guarantee a good predictive capability of
the model. For example, new data may be affected by a new explanatory variable
that has been held constant in the regression dataset. Suppose we want to predict
the yield of a particular crop based on a regression equation that was obtained
using data of crops growing under a constant temperature of 20
◦
C. Although

2.3 Multiple Linear Regression 79
this equation may perform with R
2
= 1 on the regression dataset, it will probably
be completely useless on another dataset obtained for crops growing under a
constant temperature of 10
◦
C.Togetatleastafirstideaastohowaparticular
regression model performs on unknown data, a procedure called cross-validation
can be used. Cross-validation approaches mimic ‘‘new data’’ in various ways, for
example, based on a partitioning of the dataset into a training dataset which is used
to obtain the regression equation, and a test dataset which is used to assess the
regression equation’s predictive capability (a so-called holdout validation approach,
see [48]).
The R program
LinRegEx3.r in the book software performs such a cross-
validation for the rose wilting data,
Volz.csv. This program is very similar
to
LinRegEx2.r, except for the following lines of code that implement the
partitioning of the data into training and test datasets:
1: Dataset=read.table(FileName, ...)
2: TrainInd=sample(1:47,37)
3: TrainData=Dataset[TrainInd,]
4: TestData=Dataset[-TrainInd,]
5: RegModel=lm(eq,data=TrainData)
6: DegWiltTrain=predict(RegModel,TrainData)
7: DegWiltTest=predict(RegModel,TestData)
(2.52)
After the data have been stored in the variable Dataset inline1ofprogram
2.52, 37 random indices between 1 and 47 (referring to the 47 lines of data in
Volz.csv) are chosen in line 2. See [45] and the R helppagesformoredetailson
the
sample command that is used in line 2. The 37 random indices are stored in
the variable
TrainInd which is then used in line 3 to assemble the training dataset
TrainData based on those lines of Dataset which correspond to the indices in
TrainInd. The remaining lines of Dataset are then reassembled into the test
dataset
TestData in line 4. The regression model RegModel is then computed
using the training dataset in line 5 (note the difference to line 4 of program 2.37
where the regression model is computed based on the entire dataset). Then, the
predict command is used again to apply the regression equation separately to the
training and test datasets in lines 6 and 7 of Equation 2.52.
Figure 2.5 shows an example result of
LinRegEx3.r. You should note that if you
run
LinRegEx3.r on your machine, the result will probably be different from the
plot shown in Figure 2.5 since the
sample command may select different training
and test datasets if it is performed on different computers. As explained in [45],
the
sample command is based on an algorithm generating pseudorandom numbers,
and the actual state of this algorithm is controlled by a set of integers stored in the
R object
.Random.seed. As a result of this procedure, LinRegEx3.r may generate
different results on different computers depending on the state of the algorithm
on each particular computer. Figure 2.5 compares the measured and predicted
values of
DegWilt similar to Figure 2.4b above. As could be expected, there are
larger deviations between the line
ˆ
y = y and the data for the test dataset which
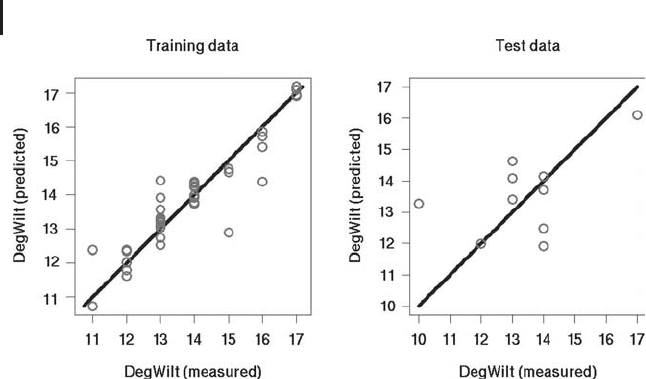
80 2 Phenomenological Models
Fig. 2.5 Comparison of predicted (
ˆ
y)andmeasured(y)val-
ues of
DegWilt using a randomly selected training dataset
(n = 37) and a complementary test dataset (n = 10). In
each of the plots, the circles are at the coordinates (y
i
,
ˆ
y(x
i
))
(i = 1, ..., m)andthelineis
ˆ
y = y. The figure was produced
using
LinRegEx3.r.
was not used in the regression procedure. This is also reflected by the R
2
values
(training data R
2
: 0.86, test data R
2
: 0.22) and by the mean deviations (training
data: 0.41 days, test data: 1.13 days) computed by
LinRegEx3.r. Repeating the
cross-validation procedure several times and averaging the results, one gets a fairly
good idea of the predictive capability of a regression model, at least referring to
data that are similar to the dataset under consideration (which excludes data that
have e.g. been obtained using different temperatures etc. as discussed above).
2.4
Nonlinear Regression
2.4.1
The Nonlinear Regression Problem
Until now, we have considered (multiple) linear regression functions of the general
form
ˆ
y(x) = a
0
+ a
1
f
1
(x) +a
2
f
1
(x) +···+a
s
f
s
(x) (2.53)
where a
0
, a
1
, ..., a
s
are the regression coefficients, x = (x
1
, ..., x
n
), and f
1
(x), ...,
f
s
(x) are arbitrary real functions (see the discussion of Equation 2.45 in Section 2.3.1
above). As explained above, regression functions of this kind are called linear since
ˆ
y(x) is obtained as a linear combination of the regression coefficients. In many
2.4 Nonlinear Regression 81
applications, however, the regression functions will depend in a nonlinear way on
the regression coefficients. Using a = (a
1
, ..., a
s
) this can be expressed in a general
form as
ˆ
y(x) = f (x, a) (2.54)
where f is some general real function (a slightly more general, vectorial form of
this equation will be given at the end of this section). Similar to the procedure
explained in Sections 2.2.1 and 2.3.1 above,
ˆ
y(x) is fitted to measurement data based
on a minimization of the RSQ.
2.4.2
Solution Using Software
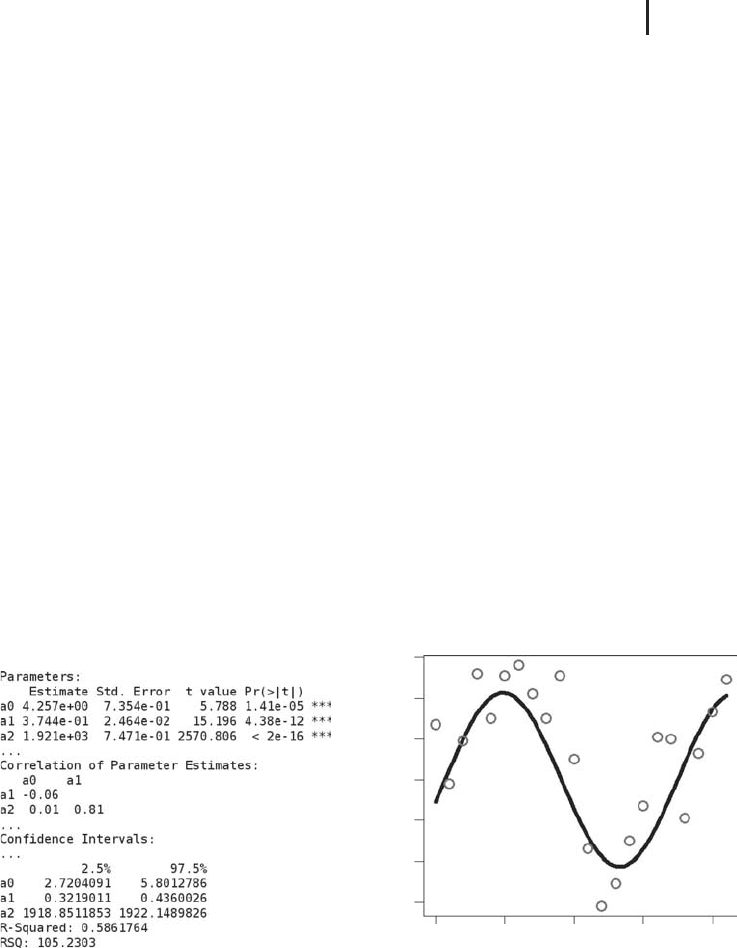
Let us look at some examples. Figure 2.6 shows US investment data (expressing
the relative change of investments compared with a reference value) described in
[49, 50]. These data are a part of R’s
Ecdat library, and they are a part of the book
software in the file
klein.csv. As a result of the economic cycle, the data show
an oscillatory, sinusoidal pattern. This means that if we want to describe these data
using a regression function, it is natural to apply a general sine function such as
ˆ
y(x) = a
0
· sin(a
1
· (x − a
2
)) (2.55)
Using
f (x, a) = f (x, a
0
, a
1
, a
2
) = a
0
· sin(a
1
· (x − a
2
)) (2.56)
1920
6
1925 1930 1935 1940
4
2
0
−2
−4
−6
Year
I(%)
(a) (b)
Fig. 2.6 (a) Nonlinear regression result produced by R’s
nls function based on Equation 2.55, Klein.csv and
NonRegEx1.r. (b) Comparison of the regression function
Equation 2.55 (line) with the data
Klein.csv (circles).
Figure produced using
NonRegEx1.r.

82 2 Phenomenological Models
it is seen that Equation 2.55 has the general form of Equation 2.54, and thus it is a
nonlinear regression function. Note that it cannot be brought into the linear form
of Equation 2.53 since a
1
and a
2
appear in the (nonlinear) sine function. Three
regression coefficients can be used to fit this function to the data: a
0
determines the
amplitude of the function, a
1
determines its period, and a
2
moves the sine along
the x-axis.
Using R, a nonlinear regression based on Equation 2.55 and the data in
Klein.csv can be performed by a simple editing of LinRegEx1.r which was
discussed in Section 2.2 above. This leads to the R program
NonRegEx1.r in the
book software. Let us look at the essential commands in
NonRegEx1.r that do the
nonlinear regression (everything else is very similar to
LinRegEx1.r):
1: eq=inv~a0*sin(a1*(year-a2))
2: parstart=c(a0=5,a1=2*pi/15,a2=1920)
3: FileName="Klein.csv"
4: Dataset=read.table(FileName,
...)
5: RegModel=nls(eq,data=Dataset,start=parstart)
(2.57)
Line 1 defines the regression function according to Equation 2.55. Note that
ˆ
y
and x have been replaced by the appropriate column names of
Klein.csv, inv,
and
year, respectively. The equation eq defined in line 1 is then used in line 5
to compute the regression model based on R’s
nls function. This is the essential
difference to the linear regression models in the previous sections, which could all
be treated using R’s
lm function.
Note 2.4.1 (R’s nls function) In contrast to the lm function which was used
for linear regression above, the
nls function determines the parameter estimates
based on an iterative numerical procedure. This means that the computation begins
with certain starting values of the parameters which are then improved step by
step until the problem is solved with sufficient accuracy.
The required accuracy can be controlled via the R function
nls.control,see
R’s help pages. Details about the iterative procedure used by
nls can be found in
[43, 51]. The starting values must be provided by the user, which is done in line
2 of program 2.57. Generally, the iterative procedure called by
nls will converge
better if the starting values of the parameters are chosen close to the solution of the
regression problem. This means that if
nls does not converge, you should try other
starting values of the parameters until you obtain convergence. It may also happen
that you do not get convergence for any set of starting values, which usually means
that your regression equation is inappropriate, so try another model in that case.
To choose the starting values, you should of course use any kind of available a priori
information on the parameters that you can get. For example, if you know certain
limits for the parameters based on theoretical considerations it is usually a good

2.4 Nonlinear Regression 83
idea to choose the starting value exactly between those limit values. On the other
hand, you may use parameter values from the literature or try to derive estimated
values from the data. In our case, reasonable estimates can be derived from the
data in Figure 2.6. Looking at the data you see that the amplitude of the oscillation
is about ±5, so it is a good idea to choose a
0
= 5. Furthermore, the data suggest
a period length of about 15 years, so we set a
1
= 2π/15 since R’s sine function
expects its argument in radians. Finally, the period begins at the x coordinate 1920
and hence we set a
2
= 1920. Exactly these starting values for the parameters are
defined in line 2 of program 2.57, and they are then used in line 5 as an argument
of the
nls function. Running NonRegEx1.r using these starting values, the result
showninFigure2.6aandbisobtained.
Figure 2.6b compares the regression function Equation 2.55 that is obtained
using the estimates of the coefficients a
0
, a
1
,anda
2
from Figure 2.6a with the data
Klein.csv. As can be seen, the regression function correctly describes the general
tendency of the data. A substantial (but inevitable) scattering of the data around
the regression function remains, which is also expressed by an R
2
value of only
0.58 (Figure 2.6a). The confidence intervals in Figure 2.6a have been generated using
R’s
confint command, see NonRegEx1.r. These confidence intervals refer to the
random variables which generate the estimates of a
0
, a
1
,anda
2
,andwhichwe
denote as α
0
, α
1
,andα
2
analogous to Section 2.2.4. For example, for α
0
we have a
confidence interval of [2.7204091, 5.8012786] which means that this interval covers
the unknown ‘‘true’’ expected value of α
0
with a probability of 95% [19]. In this way,
we get an idea of how sharply α
0
and the other parameters can be estimated from
the data. As Figure 2.6a shows, we have smaller confidence intervals around α
1
and
α
2
, which means that these parameters can be estimated with a higher precision
from the data compared to α
0
.
The
nls function also reports correlations between the parameter estimates
(Figure 2.6b). For example, Figure 2.6a reports a correlation of 0.01 between α
0
and α
1
and a correlation of 0.81 between α
1
and α
2
(where we have used Greek
letters α
0
, α
1
,andα
2
to denote the random variables which generate the estimates
of a
0
, a
1
,anda
2
, analogous to Section 2.2.4). Such correlations can be used to
improve the experimental design with respect to an improved estimability of the
parameters as discussed in [41]. As discussed there, particularly high correlations
between two estimated parameters may indicate that the information content in
the dataset does not suffice for a discrimination between those two parameters, or
they may indicate degeneracies in the model formulation.
2.4.3
Multiple Nonlinear Regression
The procedure explained in the last section covers a great number of examples
which involve a single independent variable. Similar to linear regression, however,
nonlinear regression may of course also involve several independent variables. As
an example, let us consider the calibration of a Stormer viscometer. Appropriate

84 2 Phenomenological Models
data are a part of R’s MASS library, and you will also find these data in the file
stormer.csv in the book software. In [45], the principle of a stormer viscometer
is explained as follows (see [52] for more details):
Note 2.4.2 (Stormer viscometer) A stormer viscometer measures the viscosity
of a fluid by measuring the time taken for an inner cylinder in the mechanism to
perform a fixed number of revolutions in response to an actuating weight. The
viscometer is calibrated by measuring the time taken with varying weights while
the mechanism is suspended in fluids of accurately known viscosity.
The calibration dataset thus comprises three columns of data: the viscosity v
[10
−1
Pa.s], the weight w [g], and the time T [s] which correspond to the three
columns
Viscosity, Wt,andTime of the file stormer.csv.Itisknownfrom
theoretical considerations that v, w,andT are related as follows [45]:
T =
a
1
v
w − a
2
(2.58)
Once a
1
and a
2
are known, this equation can be used to determine the viscosity v
from known values of w and T. To determine a
1
and a
2
from the calibration dataset
stormer.csv, we can perform a nonlinear regression using Equation 2.58. Using
the identifications
ˆ
y = T, x
1
= v,andx
2
= w, Equation 2.58 can be written using
the above notation as
ˆ
y(x
1
, x
2
) =
a
1
x
1
x
2
− a
2
(2.59)
Note that this equation cannot be written in the form of Equation 2.53 since a
2
appears in the denominator of the fraction on the right-hand side of Equation 2.59,
and hence it is a nonlinear regression equation. Basically, this regression problem
canbetreatedbyasimpleeditingof
NonRegEx1.r, replacing line 1 of program
2.57 by
eq=Time~a1*Viscosity/(Wt-a2)
(2.60)
Note that Equation 2.60 corresponds exactly to Equation 2.58 above as the
columns
Viscosity, Wt,andTime of the file stormer.csv correspond to v, w,
and T. Note also that if formulas such as Equation 2.60 are used in the
nls
command, all operators such as *, / and so on, will have their usual arithmetical
meaning (see [45] and R’s help pages). This means that you do not have to use
R’s inhibit function
I() similar to Equation 2.42 to make sure that all operators
are used as arithmetical operators. The R program
NonRegEx2.r implements the
stormer viscometer regression problem using Equation 2.58. It uses a
1
= 1and
a
2
= 0asstartingvalues.nls converges without problems for these values, and
you should note that these values have been chosen without using any a priori
knowledge of the system: a
1
= 1 has been chosen based on the simple idea that we