Klipp E., Herwig R., Kowald A., Wierling C., Lehrach H. Systems Biology in Practice: Concepts, Implementation and Application
Подождите немного. Документ загружается.

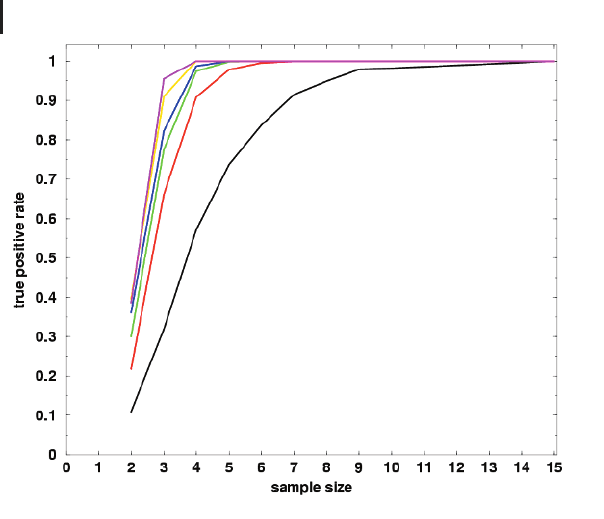
Figure 9.3 shows a simple simulation of this fact. Replicate series are sampled
from a Gaussian distribution with mean m = 1 and s
2
= 0.04 (i.e., CV = 0.2) for the
control series. In order to simulate fold changes, the mean of the treatment series is
changed, subsequently holding the CV constant (for example, m = 2 and s
2
= 0.16
[i.e., CV = 0.2] if a fold change of factor two is simulated). Then, replicates are
sampled from that distribution. A Welsh test is performed and it is marked whether
the P-value is significant (<0.05) or not. The sampling is repeated 1000 times and
the number of positive test results is denoted. The curves show the dependency of
the true positive rate on the sample size. For example, a 1.5-fold change is detectable
in only 32% of all cases when three repetitions are used. This number increases to
95% when eight replicates are used (black line). The simulation suggests that a fold-
change analysis should be performed with at least four independent replicates.
The planning and design of experiments are tightly connected to normalization
and pre-processing steps. For example, when a spotting device is used, pin effects
should be measured by spotting different replicates on the same array with different
pins. If two labeling dyes are used, then experimental replicates should incorporate
dye swaps. Studies of experimental design for series of such types of microarray ex-
periments can be found in Yang and Speed (2002).
300
9 Analysis of Gene Expression Data
Fig. 9.3 Simulation of the dependency of fold-
change detection on the sample size. Experi-
mental error is assumed to be 20%, i.e., CV of
replicated control and treatment series equals
0.2. Samples are drawn from Gaussian distribu-
tions with mean equal to 1 for the control series
and mean equal to 1.5 (black), 2 (red), 2.5
(green), 3 (blue), 5 (yellow), and 10 (magenta)
for the treatment samples, respectively, in order
to simulate the fold changes. Sampling is re-
peated 1000 times and the proportion of true-po-
sitive test results (P<0.05) is plotted (y-axis)
over the sample size (x-axis).

9.2.2
Tests for Differential Expression
Let x
1
,…,x
n
and y
1
,…,y
m
be the independent samples derived from replicated meas-
urements of the same probe across two conditions (treatment and control). Differen-
tial expression of the gene represented by the probe in the two conditions can be
judged by the location tests introduced in Chapter 3 (Section 3.4). These tests can be
used to assign to each single gene observation a P-value that judges the significance
of the fold change, i.e., the significance of the rejection of the null hypothesis of
equal population means. Here, it is notable that such a P-value is valid only if the dis-
tributional assumptions are valid. For example, if a t-test is applied to a single gene
observation resulting in a P-value of 0.01, this value is true only if both series are
Gaussian distributed and have equal variances. Furthermore, the test assumes that
the replicates are independent of each other. Strikingly, there are many studies
around that miss this fact entirely, for example, applying a Gaussian-based t-test
without checking the validity of the distributional assumptions. Thus, replicates on
the same array and replicates in different experiments should not be mixed since
they have different characteristics and cannot be treated as independent replicates.
Important issues of a test procedure are (1) whether the distributional assumptions
are valid, (2) whether the replicates are independent of each other, (3) whether the
number of replicates is sufficient to detect the fold change that you are interested in,
and (4) whether outliers are removed from the samples. Most commonly, modifica-
tions of four different tests are applied in microarray data analysis: Student’s t-test,
Welch’s test, Wilcoxon’s rank sum test, and permutation tests. While the first two
tests assume Gaussian-distributed data and that the P-values are calculated by a
probability distribution, the latter two are nonparametric and the P-values are calcu-
lated with combinatorial arguments.
A permutation test (Lehmann 1979) has the following schema:
1. Choose a suitable test statistic, T, that reflects expression changes and calculate
the value from the two signal series,T = t
obs
.
2. Mix the two series and assign them to two groups of size n and m according to a
random permutation, j, and calculate the test statistic, T = t
j
rand
.
3. Repeat step 2 for all possible permutations or for a fixed number of K different
permutations.
4. Calculate the P-value by counting how many random assignments result in a va-
lue of the test statistic as extreme or more extreme than the observed one divided
by the total number of permutations, p
j; t
rand
j
t
obs
jj
no
K
.
A suitable test statistic, T, could be, for example, the t-test statistic (compare
Eq. (3-11) in Chapter 3) or the absolute difference of the group means T(x
1
,…,x
n
,
y
1
,…,y
m
)=
x
y
.
Wilcoxon’s rank sum test is based on the sum of ranks of the replicates from the
treatment sample within the combined sample of n+m values. This test (and other
301
9.2 Fold-change Analysis

tests based on linear rank statistics such as the van der Waerden test) is preferable to
the t-tests if the distributional assumptions cannot be proven to be Gaussian.
Furthermore, for noisy data this test yields more robust results since it is less sensi-
tive to outlier values (recall Example 3.26). It should further be noted that any rank-
based method is invariant against strictly monotone transformations of the data
such as a log transformation. For larger sample sizes, n + m > 25, we can approxi-
mate the P-value of the Wilcoxon rank test by the standard normal distribution
(Eq. (3-12) in Chapter 3). However, most practical applications will be based on a
rather smaller number of observations (sample sizes on the order of 3–12). There-
fore, those P-values must be calculated exactly. This can be done using a recursive
method (Herwig et al. 2001).
Let w(z, n, m) be the number of possible rank orderings that result in a value of T
equal to z. This number is a sum of the number of possible rank orderings of T that
contain the highest rank, m+n, and those that do not, which can be described as
wz; n; m
wz m n
; n 1; m
wz; n; m 1
: (9-7)
If T contains the highest rank, then we can describe this with the left part of the
above sum and reduce the first sample by 1. If T does not contain the highest rank,
then we can describe this with the right part of the sum and reduce the second sam-
ple by 1. The P-value of the observation, T = t
obs
, can be derived by counting all com-
binations of rank orderings that yield a more extreme value of T divided by the total
number of possible rank orderings, i.e.,
p
2
P
zt
obs
wz; n; m
n m
n
if t
obs
E
H
0
T
and
p
2
P
zt
obs
wz; n; m
n m
n
if t
obs
< E
H
0
T; (9-8)
where E
H
0
(T) is the theoretical expectation of Tunder the null hypothesis that no ex-
pression difference is present (Lehmann 1979).
Example 9.1: Wilcoxon test revisited
Consider the case n=m=3. There are
6
3
20 different possible rank order-
ings that lead to the following distribution of values of T:
302
9 Analysis of Gene Expression Data
T 6789101112131415
Combinations 1123 333211

For example, if the three observations from the treatment sample have ranks 1, 3,
and 5, this will lead to a value of T = 9. The theoretical expectation of Tunder the hy-
pothesis that no expression difference is present is (compare Eq. (3-71) in Chap-
ter 3) E
H
0
T
nn m 1
2
10:5. Thus, the P-value of the observation ac-
cording to Eq. (9-8) is p 2
1 1 2 3
20
0:7 and the observation is not signifi-
cant to reject the null hypothesis. It is clear that the distribution of T is symmetric
around the expectation value. This example illustrates a disadvantage of the test:
with small sample sizes, hardly any result will be significantly below the 0.05 le-
vel. This results from the combinatorial nature of the P-value computation in con-
trast to t-tests, where a theoretical probability distribution is assumed. However,
for reasonable sample sizes the number of permutations increases rapidly. For ex-
ample, there are 70, 720, and 12,870 possible combinations of rank orderings for
sample sizes equal to 4, 6, and 8, respectively.
Example 9.2: Comparison of tests
In a microarray study incorporating approximately 15,000 different cDNAs and
four independent hybridization experiments, we investigated the early differentia-
tion event in human blastocysts, i. e., the formation of the trophectoderm and the
inner cell mass. HMBG1 is a specific gene of interest because it has been pub-
lished as a potential “stemness” gene in human stem cell lines, i.e., a gene that is
relevant for remaining pluripotency of cells. HMBG1 is a member of the high-
mobility group of transcription factor–encoding proteins that act primarily as ar-
chitectural facilitators in the assembly of nucleoprotein complexes, e.g., the initia-
tion of transcription factor target genes.
The four measurements for the trophectoderm and ICM, respectively, are
32,612, 46,741, 29,238, 32,671
and 49,966, 58,037, 94,785, 122,044.
P-values are 3.7E-02 for Student’s t-test, 6.8E-02 for the Welch test, and 2.9E-02
for the Wilcoxon test. The ANOVA test results in a non-significant P-value. This
example shows how a high variance (ICM sample) can mislead the Gaussian-
based tests, whereas the rank-based test is fairly stable. Note that ranking sepa-
rates the groups perfectly.
9.2.3
Multiple Testing
The single-gene analysis described above has a major statistical drawback. We cannot
view each single test separately but have to take into account the fact that we perform
thousands of tests in parallel (for each gene on the array). Thus, a global significance
303
9.2 Fold-change Analysis

level of a = 0.05, for example, performed with n = 10,000 cDNAs will imply a false-
positive rate of 5%. This means that we must expect that 500 (!) individual tests are
false-positive results and thus that many cDNAs are falsely identified as potential tar-
gets. Inclusion of such false positives in the further analysis steps can be extremely
costly. Therefore, corrections for multiple testing are commonly applied to microar-
ray studies that assure a global significance rate of 5%.
Let a
g
be the global significance level and let a
s
be the significance level at the sin-
gle-gene level. It is clear that we cannot assure a global significance level a
g
without
adjusting the single-gene levels. For example, the probability of making the correct
decision given that we reject the null hypothesis (i.e., the probability of selecting a
truly differentially expressed gene) is
p
s
1 a
s
:
The probability of making the correct decision on the global level is the product of
the probabilities on the individual levels:
p
g
1 a
s
n
:
The probability of drawing the wrong conclusion in either of the n different tests is
P wrong
a
g
1 1 a
s
n
: (9-9)
For example, if we have 100 different genes on the array and we set the gene-wise
significance level to 0.05, we will have a probability of 0.994 of making a type I error.
This is the so-called family-wise error rate (FWER) of the experiment, i.e., the global
type I error rate. Multiple testing corrections try to adjust the single-gene level type I
error rate in such a way that the global type I error rate will be below a given thresh-
old. In practice, that means that the calculated P-values have to be corrected.
The most conservative correction is the Bonferroni correction. Here, we approxi-
mate Eq. (9-9) by the first terms of the binomial expansion, i.e.,
1 a
s
n
X
n
i0
n
i
1
ni
a
i
s
: (9-10)
Thus, we rewrite
a
g
1
X
n
i0
n
i
a
s
i
na
s
) a
s
a
g
n
: (9-11)
The Bonferroni correction of the single-gene level is the global level divided by the
number of tests performed. This is far too conservative. For example, when using an
array of n = 10,000 probes and an experiment FWER of 0.01, only those observations
whose P-value is below 1.0e-06 would be judged as “significantly differentially ex-
304
9 Analysis of Gene Expression Data

pressed.” Fairly few genes would meet this requirement. The result would therefore
consist of many true negatives.
The Bonferroni correction is too strict in the sense that we apply the same signifi-
cance level to all genes. Consider now the following stepwise procedure. For a given
global significance level a
g
, sort the probes in increasing order after their P-values are
calculated on the single-gene basis. If p
1
<
a
g
n
, then adjust the remaining n –1P-va-
lues by comparing the next P-value p
2
<
a
g
n 1
, etc. If m is the largest integer for which
p
m
<
a
g
n m 1
, then we call genes 1, …, m significantly differentially expressed.
This procedure is called Holm’s stepwise correction, and it assures that the global
significance level is valid. Although it is more flexible than the Bonferroni correc-
tion, it is still too strict for practical purposes.
A widely used method for adjusting P-values is the Westfall and Young step-down
correction (Westfall and Young 1993). This procedure is essentially based on permu-
tations of the data.
1. Perform d = 1, …, D permutations of the sample labels, and let p
i
be the gene-wise
P-value of the ith probe.
2. For each permutation, compute the P-value p
id
from the dth permutation for the
ith probe.
3. Adjust the P-value of probe i by
~
p
i
d; min
i
p
id
p
i
D
.
The advantage of this resampling method is that, unlike the approaches above, it
takes data dependencies into account.
An alternative to controlling the FWER is the computation of the false discovery
rate (FDR). The FDR is defined as the expected number of type I errors among the
rejected hypotheses (Benjamini and Hochberg 1995). The procedure follows the fol-
lowing scheme:
1. As in the case of Holm’s procedure, sort the probes in increasing order after their
P-values are calculated on the single-gene basis. Select a level a
g
for the FDR.
2. Let j
max j; p
j
ja=n
.
3. Reject the hypotheses for j 1; :::; j
.
Recent variations of controlling the FDR with application to microarray data have
been published (Tusher 2001; Storey and Tibshirani 2003).
The practical use of multiple testing is not entirely clear. Whereas on the one
hand it is useful to select false-positive results from true-positive results, this will on
the other hand discard a lot of potentially useful targets, and the experimentalist
might lose important biological information.
305
9.2 Fold-change Analysis
9.2.4
ROC Curve Analysis
In Section 3.4, we introduced the basic types of errors of a statistical test procedure.
If, in practice, a training sample is available (e. g., a set of gene probes known to be
differentially expressed and a set of probes that is known to be unchanged), for each
test result we can calculate the true- and false-positive rates. The performance of a
specific test (normalization method, etc.) can then be displayed using a receiver oper-
ating characteristic (ROC) curve. The purpose and result of a ROC curve analysis is,
306
9 Analysis of Gene Expression Data
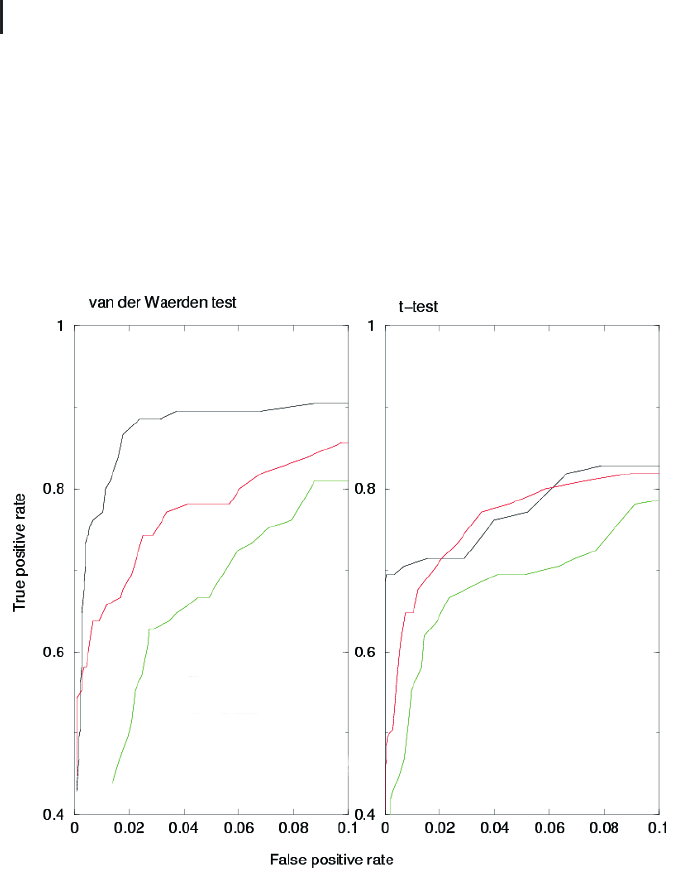
Fig. 9.4 ROC curve for visualizing performance
of normalization methods and test procedures.
Six independent hybridization experiments were
performed with wild-type zebrafish embryos
(control) and lihtium-treated embryos (treat-
ment). The true-positive sample was identified
by 105 cDNAs that were verified by an indepen-
dent experimental technique (in situ hybridiza-
tion); the false-positive sample was estimated
by 2304 copies of an Arabidopsis thaliana cDNA
whose complementary sequence was spiked to
the treatment and control target samples, re-
spectively. Left graph: The van der Waerden test
is used for judging differential expression on
three different normalization methods: global
median normalization (black), variance stabiliza-
tion (red), and linear regression (green). Right
graph: Student’s t-test is used for judging differ-
ential expression using the same normalization
methods. ROC analysis reveals that the nonpara-
metric test outperforms the Gaussian-based test
and, furthermore, that the global normalization
performs best with both test methods compared
to the other methods.

for example, to evaluate several normalization and test procedures and to choose the
best methods.
Figure 9.4 shows a typical example of a ROC curve analysis. Here, we map the
false-positive rate (x-axis) and the true positive rate (y-axis) and compare the perfor-
mance of three normalization procedures and two statistical tests on an experimen-
tal test set with known expression changes. Ideally, the ROC curve has an integral of
one and is a straight line (no false positives, maximal sensitivity), and those proce-
dures that give the highest overall integral are preferable. Alternatively, one might se-
lect a specific area of interest (for example, a false-positive rate below the experimen-
tal significance level) and choose the procedure that shows the highest performance
in the selected area. Similar ROC curve analysis has been used to compare different
normalization strategies (Irizarry et al. 2003).
9.2.5
Validation Methods
Typically, computationally selected targets will be verified by an independent experi-
mental method. This method varies depending on the question of interest. For example,
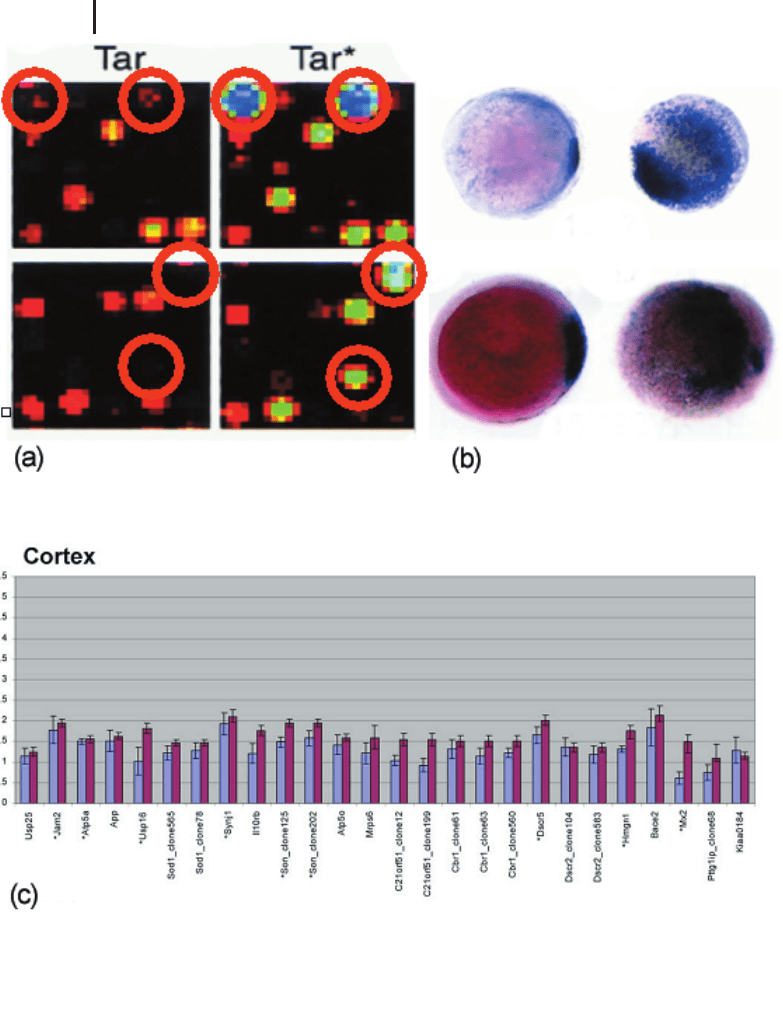
if one is interested in localizing gene expression,whole-mount in situ hybridizations are
used to visualize changes in gene expression in a specific tissue (Fig. 9.5a, b). The state-
of-the art validation of array measurements is RT-PCR (compare Chapter 4). This is a
very sensitive technique that allows the amplification of small quantities of a given
mRNA that might be far below the detection limit of array measurements (Fig. 9.5c).
Verification of the microarray results with RT-PCR typically yields a success rate of
80%, meaning that 80% of the predicted fold changes by microarrays can be verified
by the independent measurements (Dickmeis et al. 2001; Kahlem et al. 2004).
9.3
Clustering Algorithms
Clustering algorithms are a general group of tools from multivariate explorative sta-
tistics. They are used to group data objects according to their pairwise similarity with
respect to a set of characteristics measured on these objects. Clustering algorithms
are widely used in order to identify co-regulated genes with microarray experiments.
There is a simple assumption behind that strategy: the concept of “guilt by associa-
tion.” The rationale behind this concept is that those genes whose probes show a si-
milar profile through a set of experimental conditions will share common regulatory
rules. Thus, gene expression clusters are used to identify common functional charac-
teristics of the genes.
Clustering algorithms are explorative statistical methods that group together genes
with similar profiles and separate genes with dissimilar profiles, whereby similarity
(or dissimilarity) is defined numerically by a real-valued pairwise (dis)similarity func-
tion. Considering p experiments that have been performed on n different gene probes
on the array, the profile of gene i is a p-dimensional vector x
i
x
i1
; :::; x
ip
and a
307
9.3 Clustering Algorithms
308
9 Analysis of Gene Expression Data
Fig. 9.5 Validation of array data. (a) Visual in-
spection of expression strength of two selected
genes from a developmental study on zebrafish
embryos (Dickmeis et al. 2001). Both cDNAs
show a strong overexpression when comparing
Tar*-injected target material with Tar wild-type.
(b) In situ hybridizations verify the overexpres-
sion by localized gene expression. (c) Histogram
showing the correlation between array and qPCR
results for cortex brain tissue from control mice
and TS65Dn mice (a mouse model for trisomy
21). Blue bars represent mean ratios of three in-
dependent array hybridizations, and red bars re-
present mean ratios of two independent qPCR
experiments (Kahlem et al. 2004).

pairwise similarity measure can be any function d:<
p
<
p
!<. Intuitively, one
would prefer functions that reflect some kind of geometric distance such as the Eucli-
dean distance, or more generally, the Minkowsky or l
q
distances defined by
d
q
x
n
; x
m
P
p
i1
x
ni
x
mi
jj
q
1
q
: (9-12)
Note that for q = 1 we have the Manhattan distance and for q = 2 we have the Eucli-
dean distance. Another class of pairwise similarity measures is correlation measures
such as Pearson’s or Spearman’s correlation coefficient (Section 3.4.2).
A practical problem occurs with missing values since there may be some measure-
ments that yield an unreliable value for a given probe. However, one wants to keep
the other reliable measurements of that probe and use its profile for further analysis.
The fact that the profile now consists only of p–1 values has to be taken into ac-
count. The treatment of missing values is a characteristic of the pairwise similarity
measure. For example, one could try to estimate the distance of two vectors with
missing values by the valid values. Assuming two vectors x
n
, x
m
, the squared Eucli-
dean distance is given by d
2
2
x
n
; x
m
P
p
i1
x
ni
x
mi
2
if both vectors have no mis-
sing values. If there are missing values, count the number of coordinate pairs that
include at least one missing value, k, compute the distance on the remaining coordi-
nate pairs, and estimate the distance by a multiplicative factor proportional to the
amount of missing pairs, i.e., d
2
2
x
n
; x
m
p
p k
P
i
x
ni
x
mi
2
. If, for example, half
of the data are missing, the remaining distance is multiplied by 2. This and other ad-
justments for missing data can be found in the book of Jain and Dubes (1988).
Example 9.3: Data transformation
In practice, it might be useful to transform data prior to computing pairwise
distances. Consider the profiles x
1
= (100,200, 300), x
2
= (10,20,30) and x
3
=
(30,20,10). Euclidean distance will assign a higher similarity to the pair x
2
, x
3
than to the pair x
1
, x
2
because it takes into account only the geometric distance of
the three data vectors. Correlation measures would assign a higher similarity to
the pair x
1
, x
2
than to the pair x
2
, x
3
since they take into account whether the com-
ponents of both vectors change in the same direction. For example, if these data
were derived from a time series measurement, one would argue that both vectors
x
1
, x
2
increase with time (although on different levels of expression), whereas x
3
decreases with time. Therefore, in many applications it makes sense to transform
the data vectors before calculating pairwise similarities. A straightforward geo-
metric data transformation would be to divide each component x
j
of a p-dimen-
sional data vector x =(x
1
,…,x
p
)
T
by its Euclidian norm, i. e., perform the transfor-
mation
~
x
j
x
j
x
kk
. The resulting effect is that after transformation each data vector
~
x
has a Euclidean norm of 1 and is mapped to the unit sphere.
309
9.3 Clustering Algorithms