Klipp E., Herwig R., Kowald A., Wierling C., Lehrach H. Systems Biology in Practice: Concepts, Implementation and Application
Подождите немного. Документ загружается.

310
9 Analysis of Gene Expression Data

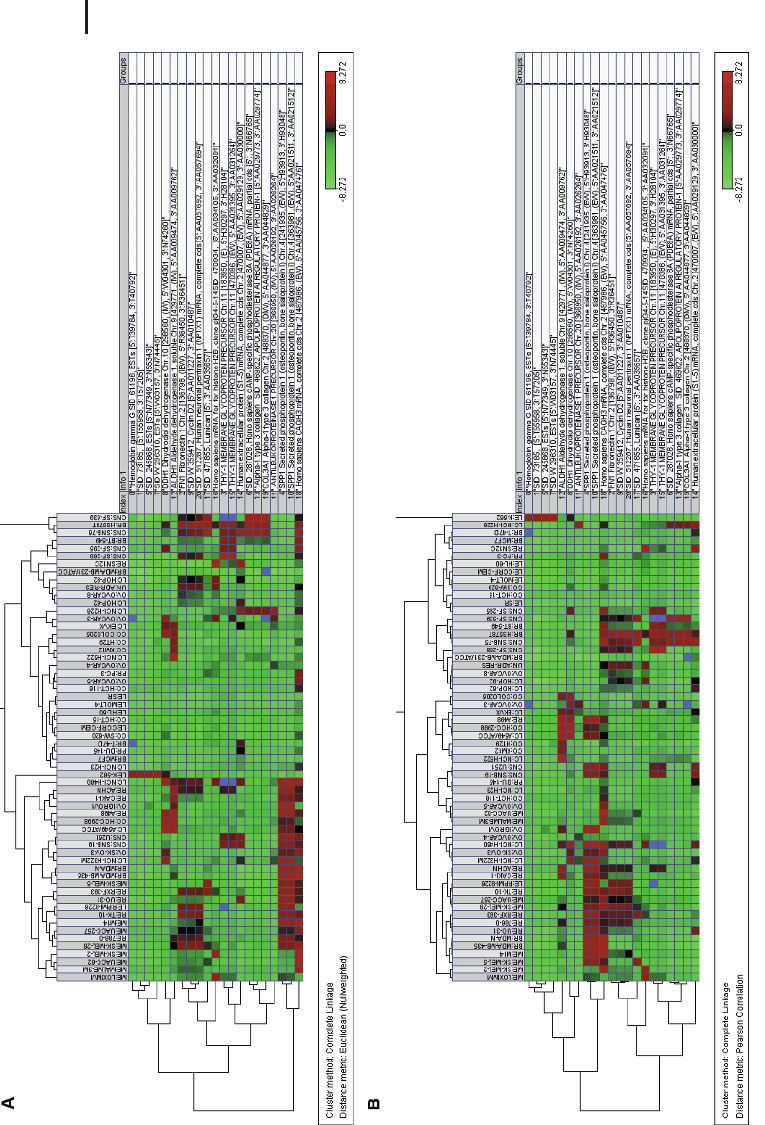
The choice of the similarity measure is important since it influences the output of
the clustering algorithm. It should be adapted to the question of interest. Figure 9.6
shows two different clustering results using two different distances.
Two classes of clustering algorithms are commonly distinguished, namely, the
hierarchical and partitioning methods (Jain and Dubes 1988; Mirkin 1996). In con-
trast to partitioning methods that try to find the “best” partition given a fixed num-
ber of clusters, hierarchical methods calculate a full series of partitions starting from
n clusters, each of which contains one single data point, and ending with one cluster
that contains all n data points (or vice versa); in each step of the procedure, two clus-
ters are merged according to a pre-specified rule. In the following we describe the
classical hierarchical algorithm and commonly used partitioning methods (self-orga-
nizing maps and K-means).
Not surprisingly, there are many other cluster algorithms used in the context of
gene expression profiling, e. g., algorithms based on graph theoretic concepts (CAST
[Ben-Dor et al. 1999], CLICK [Sharan and Shamir 2000], gene shaving [Hastie et al.
2000], and algorithms that are used in supervised classification approaches such as
support vector machines [Brown et al. 1999]).
9.3.1
Hierarchical Clustering
Let x
1
,…,x
n
be the p-dimensional data points (expression profiles of n gene repre-
sentatives across the p experiments). The process of hierarchical algorithms requires
a dissimilarity measure, d, between pairs of clusters (related to a dissimilarity mea-
sure,
~
d, between pairs of data points) and an update procedure for recalculation of
the merged clusters. It then has the following scheme:
1. For v = n start with the finest possible partition.
2. Calculate a new partition by joining two clusters that minimize d.
3. Update the distances of the remaining clusters and the joined cluster.
4. Stop if v = 1, i.e., all data points are in one cluster; otherwise, repeat steps 1–3. (9-13)
Several cluster dissimilarity measures are in use:
single linkage d C
n
k
; C
n
l
min
x
i
2C
n
k
;x
j
2C
n
l
~
d x
i
; x
j
; (9-14)
complete linkage d C
n
k
; C
n
l
max
x
i
2C
n
k
;x
j
2C
n
l
~
d x
i
; x
j
; (9-15)
311
9.3 Clustering Algorithms
Fig. 9.6 Influence of similarity measure on
clustering. Two dendrograms of a subgroup of
genes using the microarray expression data of
Ross et al. (2000) were generated using hierarch-
ical clustering with Euclidean distance (a) and
Pearson correlation (b) as pairwise similarity
measure. Although all other parameters are kept
constant, results show differences in both gene
and cancer cell line groupings. Clustering was
performed with the J-Express Pro software pack-
age (Molmine, Bergen, Norway).
3

and average linkage d C
n
k
; C
n
l
1
jC
n
k
jjC
n
l
j
X
x
i
2C
n
k
;x
j
2C
n
l
~
d x
i
; x
j
: (9-16)
Here, C
u
i
, denotes the ith cluster at the nth iteration step (i = k,l ). In the single-
linkage procedure, the distance of two clusters is given by the minimal pairwise
distance of the members of the one and the members of the other; in the com-
plete-linkage procedure, the distance of two clusters is given by the maximal pair-
wise distance of the members of the one and the members of the other; and in the
average-linkage procedure, the distance of two clusters is given by the pairwise dis-
tance of the arithmetic means of the clusters. In all three procedures, those two
clusters that minimize the cluster distance over all possible pairs of clusters are
merged.
Once two clusters have been merged to a new cluster, the distances to all other
clusters must be recomputed. This is usually implemented using the following re-
cursive formula:
d C
n1
m
; C
n
k
[ C
n
l
a
k
d C
n
m
; C
n
k
a
l
d C
n
m
; C
n
l
b d C
n
k
; C
n
l
gjd C
n
m
; C
n
l
d C
n
m
; C
n
k
j: (9-17)
where the parameters depend on the cluster distance measure. The parameters for
the update procedure are summarized in the table below:
Method a
i
(i = k,l) bc
Single linkage 0.5 0 –0.5
Complete linkage 0.5 0 0.5
Average linkage
jC
n
i
j
jC
n
k
jjC
n
l
j
00
The parameter b is 0 in these examples, but other update methods exist (e.g., the
centroid and the Ward method) that incorporate a positive b.
Hierarchical methods have been applied in the context of clustering gene expres-
sion profiles (Eisen et al. 1998; Wen et al. 1998; Alon et al. 1999). They are memory
intensive because all pairwise distances must be calculated and stored. Hierarchical
methods suffer from the fact that they do not “repair” false joining of data points
from previous steps; indeed, they follow a determined path for a given rule. Figure
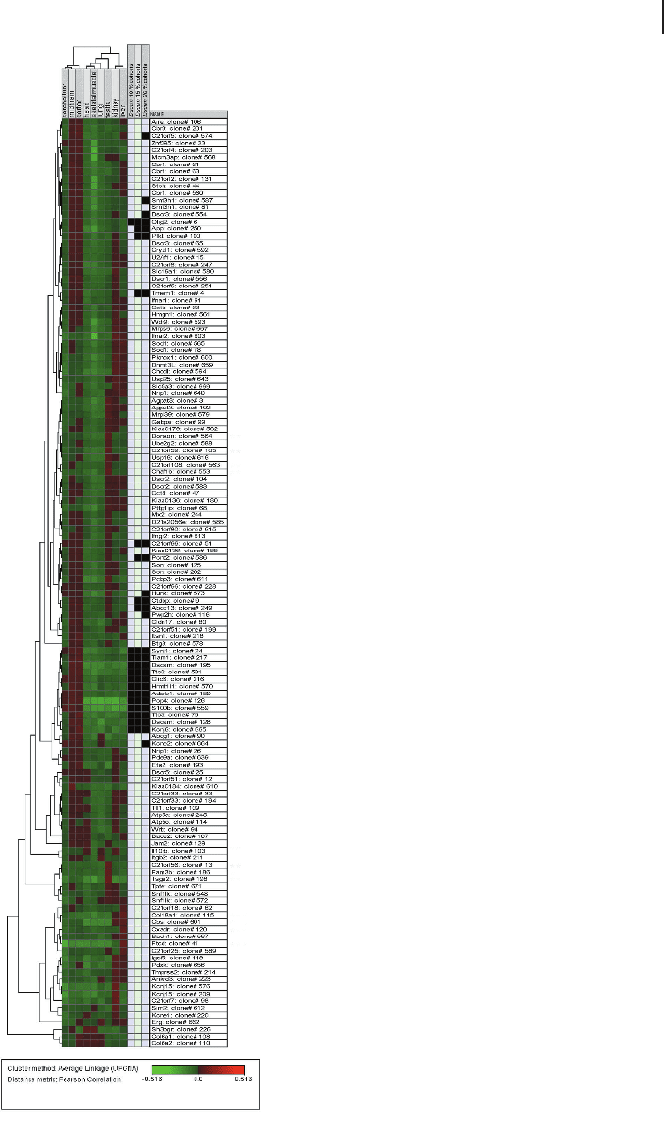
9.7 displays this problem. In a recent study, Kahlem et al. (2004) studied the gene ex-
pression profiles of chromosome 21 mouse orthologs in nine different mouse tis-
sues from a mouse model for trisomy 21 (TS65Dn mouse). Among genes predomi-
nantly active in the brain, they found DSCAM, a cell surface protein acting as an
axon guidance receptor. A hierarchical clustering using average linkage as an update
rule was performed, and the resulting dendrogram is displayed. This cluster is sig-
312
9 Analysis of Gene Expression Data
313
9.3 Clustering Algorithms
Fig. 9.7
Practical example of a dendrogram from nine different mous
e tissues.
For each cDNA the logarithm (base 2) of the ratio between
the normalized in-
tensity in the specific tissue and the average of intensities
of this cDNA across
the nine control tissues was calculated. Ratios are represe
nted with a color gra-
dient spanning from green (underexpressed) to red (overexpressed).
Hierarchi-
cal clustering was performed with the average-linkage update
rule and Pearson
correlation as similarity measure (J-Express, Molmine, Bergen
, Norway). Addi-
tionally, clones with the most similar expression profiles
to DSCAM (with re-
spect to the Pearson correlation) are displayed: 10%-closest
(13 clones, left col-
umn), 15%-closest (20 clones, middle column), and 20
%-closest (26 clones,
right column). Note that in hierarchical clustering procedure
s, clones with simi-
lar expression profiles can be split to different parts of the d
endrogram (e.g.,
Olig2) and
vice versa
(e.g., Abcg1).

nificantly non-random; however, several of the profiles numerically close to DSCAM
are missing (black bars) due to false joining in previous steps.
Another problem with hierarchical clustering methods is that it may be difficult to
decide on a representative member for each cluster, especially when using the sin-
gle-linkage algorithm. In contrast, when a partitioning algorithm is used, the center
of each cluster is a natural representation of the cluster’s feature.
9.3.2
Self-organizing Maps (SOMs)
Clustering methods are implicitly used in the construction of self-organizing maps
(SOMs), a method in the neural network framework introduced by Kohonen (1997).
Kohonen’s algorithm tries to find an illustrative display of n-dimensional data points
in a given lattice, L, of points, usually in two or three dimensions such that the high-
dimensional data structure (neighborhoods, topological ordering, clusters) is pre-
served and can be detected in this low-dimensional structure. The points r
j
B L are
called nodes (neurons). Each node r
j
has a representation in the n-dimensional space
of the data points; this representation is called reference vector, c
j
(or weight vector
of the neuron). Basically, there are two main steps repeated for each data vector for a
number of iterations, on the order of tens of thousands iterations:
1. Randomly initialize the reference vector c
1
j
for each node.
2. For each iteration step n + 1 do the following:
a. Randomly pick an input data vector x
m1
. Denote by c
m
j
the weight vector of the
jth node at iteration n. The matching node is defined by
c
m
j
0
2 arg min d
2
x
m1
; c
m
j
;j
no
, where d
2
is defined in Eq. (9-12).
b. Update the reference vector of the matching node and its neighbors by the up-
date formula c
m1
j
c
m
j
Z
n
h
n
j
0
j
x
m1
c
m
j
.
3. Assign each data vector to the cluster with the most similar reference vector.
0<Z
(u)
< 1 is called the learning function, which monotonically decreases with the
number of iterations; 0 < h
u
j
0
j
< 1 is called the neighborhood function, which de-
creases monotonically with the distance of the nodes.
The main task of the neighborhood function is to provide learning, i.e., updating
of the weights, not only for the best matching node but also for its neighbors. The
task of the learning function is to shrink learning in time as iterations increase.
The result of Kohonen’s algorithm is that units that are spatially close tend to de-
velop similar weight vectors. Of course, the rate at which the neighborhood shrinks
is critical. If the neighborhood is large and it shrinks slowly, the cluster centers will
tend to stick close to the overall mean of all of the samples.
Commonly used neighborhood functions are h
u
j
0
j
e
d
2
r
j
0
;r
j
2
2 s
2
u
and
h
u
j
0
j
1; d
2
r
j
0
; r
j
< su
0; d
2
r
j
0
; r
j
su
, where r
j
0
is the matching node, r
j
is the adapted node
314
9 Analysis of Gene Expression Data

whose reference vector is updated, and s
2
(u) is the neighborhood radius that de-
creases with the number of iterations. Self-organizing maps have been used in the
context of clustering gene expression profiles (Tamayo et al. 1999; Törönen et al.
1999).
9.3.3
K-means
K-means algorithms are a fast and large-scale-applicable clustering method. The
main idea behind these techniques is the optimization of an objective function usually
taken up as a function of the deviates between all patterns of the data points from their
respective cluster centers. The most commonly used optimization is the minimiza-
tion of the within-cluster sum of squared Euclidean distances utilizing an iterative
scheme that starts with a random initialization of the cluster centers and then alters
the clustering of the data to obtain a better value of the objective function.
K-means algorithms alternate between two steps until a stopping criterion is satis-
fied. These steps are a pairwise distance measure of the data vectors and the cluster
centers related to the optimization criterion and an update procedure for the cluster
centers.
In most cases, Euclidean distance has been used as pairwise similarity measure
because of its computational simplicity. The cluster center at each iteration can be
calculated in a straightforward manner by the arithmetic mean of the data vectors
currently assigned to the cluster, which is known to minimize the within-cluster
sum of squared Euclidean distances.
The original K-means algorithm reads as follows:
1. Start with an initial partition of the data points in K cluster with cluster centers
c
1
1
; :::; c
1
K
and let W
(1)
be the value of the initial objective function.
2. At the nth step of the iteration, assign each data point to the cluster with the low-
est pairwise distance.
3. Recompute the cluster centers c
m1
1
; :::; c
m1
K
by minimizing W
n1
.
4. If for all k, c
m
k
c
m1
k
< e, stop; otherwise, return to step 2.
5. Assign each data vector to the nearest cluster center. (9-18)
If the pairwise distance is defined as the Euclidean distance, the algorithm mini-
mizes the within-cluster sum of squares of the K clusters if the cluster centers at
every iteration are recomputed as the arithmetic means of the respective data points.
Other pairwise distance measures found in the literature (Jain and Dubes 1988) in-
clude l
1
-metric (K-median clustering) and l
?
-metric (K-midranges clustering). A
common criticism of K-means algorithms focuses on the fact that the number of
centers has to be fixed from the beginning of the procedure. Furthermore, the re-
sults are highly dependent on the initialized set of centers. Alternative algorithms
have been published that do not require one to determine the number of clusters in
advance, and thus they overcome this criticism (MacQueen 1967; Herwig et al. 1999;
Tavazoie et al. 1999).
315
9.3 Clustering Algorithms

A simple approach to refining the K-means algorithm employs two thresholding
parameters (sequential K-means). The original idea dates back to MacQueen (1967).
A parameter r controlling the distance within the clusters is used to define new clus-
ter centers, and a parameter s controlling the distance between cluster centers is
used to merge cluster centers. The algorithm reads as follows:
1. Initialize K cluster centers c
1
1
; :::; c
1
K
.
2. Select a new data point x
i
at the n+1th step.
3. Compute the distances to all cluster centers from the previous step c
m
1
; :::; c
m
K
. Let
w
n
1
; :::; w
n
K
be the weights of the clusters in that step, i.e., the number of data
points already assigned to the cluster centers. If min
d c
m
j
; x
i
;j 1; :::; K
< r,
then (a) assign x
i
to the cluster center with the minimal distance, c
m
j
0
and up-
date the centroid and its weight by w
n1
j
0
w
n
j
0
1 and c
m1
j
0
w
n
j
0
c
m
j
0
x
i
w
n1
j
0
and
(b) compute the distance of the updated center to each of the other cluster centers.
While min
d c
m
j
; c
m1
j
0
;j 1; :::; K
< s, merge the center with the minimal
distance and update again according to (a). Repeat this step until for all centers
d c
m
j
; c
m1
j
0
s. If min
d c
m
j
; x
i
;j 1; :::; K
r, initialize a new cluster
center by c
m1
K1
x
i
and w
n1
K1
1.
4. Reclassify the data points.
The above algorithm iteratively allows one to join clusters that are similar to each
other and to initialize new cluster centers in each step of the iteration; thus, it is a
very flexible alternative. It should be pointed out that K-means algorithms are not
very stable in their solutions, i.e., running the same algorithm with different para-
meters will lead to different results. Thus, this algorithm should not be applied only
one time on the dataset but rather several times with several initializations of cluster
centers. In a post-processing step the stable clusters can then be retrieved.
9.4
Validation of Gene Expression Data
9.4.1
Cluster Validation
Many clustering algorithms are currently available, each of which claims special
merits and has some interpretation that makes it suitable for a class of applications.
However, it is important to compare the output of cluster algorithms in order to de-
cide which one gives best results for the current problem. For that purpose, cluster
validation measures are used. In principle, two groups of measures can be sepa-
rated: external and internal measures (Jain and Dubes 1988). External validation
measures incorporate a priori knowledge on the clustering structure of the data, e.g.,
in simulation experiments when the true partition of the data is known or in real ex-
316
9 Analysis of Gene Expression Data

periments when specific gene clusters are known. Typically, an external cluster vali-
dation measure is a numerical function that evaluates two different groupings of the
same dataset. This is done by the following scheme. Assume that we have np-di-
mensional data vectors x
1
,…,x
n
; and that a clustering result generates a partition of
this dataset in disjoint subsets. This is implicitly done with partitioning algorithms
(cf. Section 9.3), whereas with hierarchical algorithms the dendrogram has to be cut
in a suitable post-processing step. Each partition can be represented by a binary nxn
partitioning matrix, C =(c
ij
), with
c
ij
0; if data vectors i and j are not in the same cluster
1; if data vectors i and j are in the same cluster
Let C and T be two partitioning matrices computed from two different clustering
algorithms. Then, most external indices are defined as numerical functions on the
262 contingency table
C/T 0 1 Total
0 n
00
n
01
n
0.
1 n
10
n
11
n
1.
Total n
.0
n
.1
n
2
Here, n
11
denotes the number of pairs that are in a common cluster in both parti-
tions, and n
1.
and n
.1
are the marginals of the partition matrices Tand C, respectively.
Likewise, the other cell entries are defined. A commonly used index is for example
the Jaccard coefficient,
J T; C
n
11
n
11
n
01
n
10
;
which measures the data pairs clustered together proportionally to the marginals.
Other examples are Hubert’s G statistic, the goodness-of-fit statistic, or measures
based on information theory (Jain and Dubes 1988; Mirkin 1996; Herwig et al. 1999).
Internal validation measures compare the quality of the calculated clusters solely
by the data itself. Indices of quality are topological concepts, e.g., compactness or
isolation, that are computed by numerical functions, information theoretic concepts
that quantify, e. g., high informative clusters, and variance concepts that quantify the
overall variance explained by the cluster. A widely used topological measure is the
Silhouette index (Rousseeuw 1984). Consider a clustering of n data vectors that re-
sults in K clusters, S
1
,…,S
K
. For each data vector, x
i
, we can calculate two topological
values. Let S
l
be the cluster that is assigned to x
i
. Then, the compactness value de-
scribes the average distance of x
i
to all other data points in the same cluster, i.e.,
a
i
1
S
l
jj
1
X
x
k
2S
l
;k6i
d x
i
; x
k
;
317
9.4 Validation of Gene Expression Data

where d is a suitable distance measure. The isolation value describes the minimal
average distance to all other clusters, i.e.,
b
i
min
1
S
j
X
x
k
2S
j
d x
i
; x
k
;j 1; ...; K; j 6 l :
The compactness (isolation) of a cluster is defined as the average compactness
(isolation) value of its cluster members. Apparently, clusters of high quality are com-
pact and isolated. The Silhouette index combines compactness and isolation by
SI x
i
b
i
a
i
max a
i
; b
i
fg
: (9-19)
The value of the Silhouette index is bound to the interval [–1,1]. Negative values in-
dicate that this data vector should belong to a different cluster rather than the com-
puted one.
Another approach in cluster validation is to calculate “figures of merit” (Yeung
et al. 2001). Here, the predictive power of the clustering is quantified in a straightfor-
ward way by leaving out one of the p conditions from the gene expression matrix,
clustering the gene expression profiles according to the remaining p–1 conditions,
and calculating the mean deviation of the patterns of the data points and the respec-
tive cluster centroids according to the left-out condition.
Cluster validation is an important topic that has drawn insufficient attention in gene
expression analysis. Currently, the situation is somewhat troublesome for the user of
clustering software packages. On the one hand there is the choice between a multitude
of sophisticated algorithms, algorithmic parameters, and visualization tools. However,
each of these methods will generate a different result, contributing to the confusion
and frustration of the user, and there are too few tools that validate and compare results
and select the best one. Thus, future research will focus on the comparison and inte-
gration of different methods in order to reduce the bias of the individual methods.
9.4.2
Principal Component Analysis
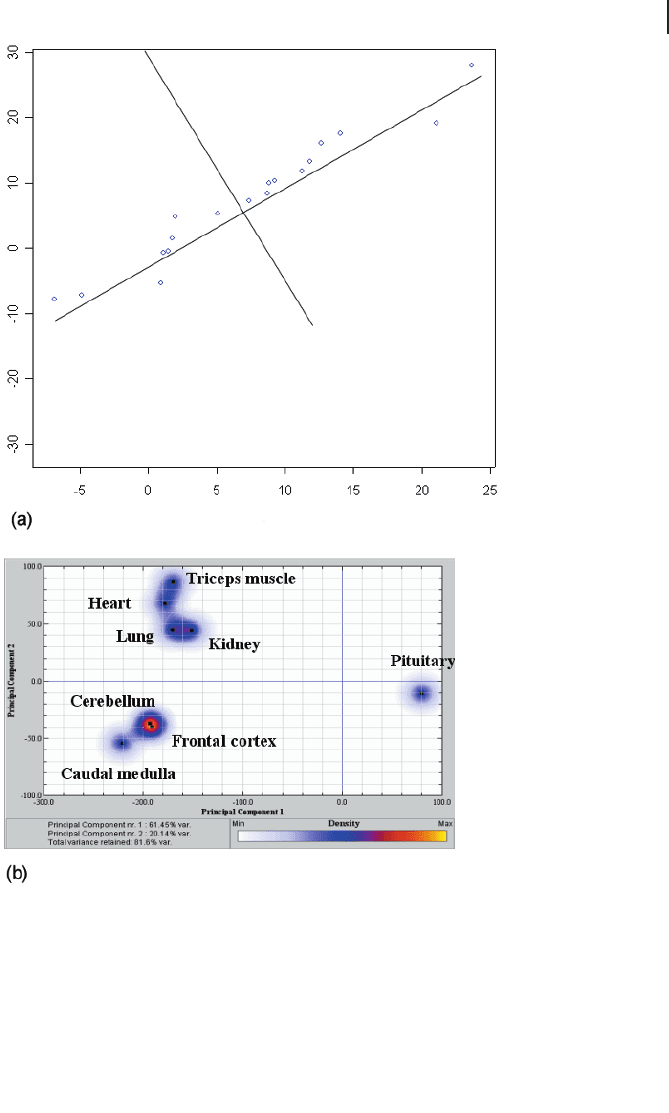
Principal component analysis (PCA) is a statistical method to reduce dimensionality
and to visualize high-dimensional data in two or three dimensions. Consider an nxp
expression matrix X where rows correspond to genes and columns correspond to ex-
periments. Thus, each gene is viewed as a data vector in the p-dimensional space. In
general not all dimensions will contribute equally to the variation across the genes;
therefore, we can hope to reduce the overall dimension to the central ones. The idea
of PCA is to transform the coordinate system to a system whose axes display the
maximal directions of variations of the data sample (Jolliffe 1986).
Figure 9.8a shows an example for p = 2. Here, essentially one dimension contains
the variation of the sample and thus the dimensionality can be reduced to one after
transforming the coordinate system appropriately.
318
9 Analysis of Gene Expression Data
89
319
9.4 Validation of Gene Expression Data
Fig. 9.8 PCA performance. (a) Two-dimen-
sional example of dimension reduction. The
scatterplot shows a high-correlated data sample
that shows significant variation with respect to
the coordinate axes. Applying PCA will replace
the original axes by principal components cen-
tered at the mean data vector whose directions
determine the data variation. In the new coordi-
nate system, component 1 explains practically
the complete data variation. (b) Practical exam-
ple of visualization of eight bovine tissues. Gene
expression was measured with DNA arrays and
a subset of probes was preselected that sepa-
rates these tissues appropriately. PCA allows the
display using only two main directions and ex-
plaining 82% of the variance. The analysis was
generated with J-Express Pro (Molmine, Bergen,
Norway).