Masters G.M. Renewable and Efficient Electric Power Systems
Подождите немного. Документ загружается.


138 THE ELECTRIC POWER INDUSTRY
The variable costs, which are also annualized, depend on the unit cost of fuel,
the O&M rate for actual operation of the plant, and the number of hours per year
the plant is operated.
Variab le ($/yr-kW) = [Fuel ($/Btu) × Heat rate (Btu/kWh)
+ O&M ($/kWh)] × h/yr (3.19)
In (3.19) it is assumed that the plant runs at full rated power while it is operated,
but no power at other times. Adjusting for less than full power is an easy mod-
ification that will be introduced later. Also, (3.19) assumes that the fuel cost is
fixed, but it too is easily adjusted to account for fuel escalation and inflation. For
our purposes here, these modifications are not important. They will, however,
be included in the economic analysis of power plants presented in Chapter 5.
Table 3.3 provides some representative costs for some of the most commonly
used power plants.
Example 3.3 Cost of Electricity from a Coal-Fired Steam Plant. Find the
annual revenue required for a pulverized-coal steam plant using parameters given
in Table 3.3. Assume a fixed charge rate of 0.16/yr and assume that the plant
operates at the equivalent rate of full power for 8000 hours per year. What should
be the price of electricity from this plant?
Solution From (3.18) the annual fixed revenue required would be
Fixed costs = $1400/kW × 0.16/yr = $224/kW-yr
TA BLE 3.3 Example Cost Parameters for Power Plants
Technology Fuel
Capital
Cost
($/kW)
Heat
Rate
(Btu/kWh)
Fuel
Cost
($/million Btu)
Var i abl e
O&M
(¢/kWh)
Pulverized coal steam Coal 1400 9,700 1.50 0.43
Advanced coal steam Coal 1600 8,800 1.50 0.43
Oil/gas steam Oil/Gas 900 9,500 4.60 0.52
Combined cycle Natural gas 600 7,700 4.50 0.37
Combustion turbine Natural gas 400 11,400 4.50 0.62
STIG gas turbine Natural gas 600 9,100 4.50 0.50
New hydroelectric Water 1900 — 0.00 0.30
Source: Based on data from Petchers (2002) and UCS (1992).
BASELOAD, INTERMEDIATE AND PEAKING POWER PLANTS 139
The variable cost for fuel and O&M, operating 8000 hours at full power, would be
Variab le = ($1.50/10
6
Btu × 9700 Btu/kWh + 0.0043$/kWh) ×8000 hr/yr
= $150.80/kW-yr
For a 1-kW plant,
Electricity generated = 1kW× 8000 hr/yr = 8000 kWh/yr
Price = 1kW×
(224 + 150.80)$/yr-kW
8000 kWh/yr
= $0.0469/kWh = 4.69¢/kWh
In the above example, it was assumed that in a year with 8760 hours, the plant
would operate at full power for 8000 hours and no power for 760 hours. The
same 8000 kWh/yr could, of course, be the result of operating all 8760 hours,
but not always at the full rated output. The resulting price of electricity would
be the same in either case. One way to capture this subtlety is to introduce the
notion of a capacity factor (CF):
Annual output (kWh/yr) = Rated power (kW) × 8760 h/yr × CF (3.20)
Solving (3.20) for CF gives another way to interpret capacity factor as the ratio
of average power to rated power:
CF =
Average power (kW) × 8760 h/yr
Rated power (kW) × 8760 h/yr
=
Average power
Rated power
(3.21)
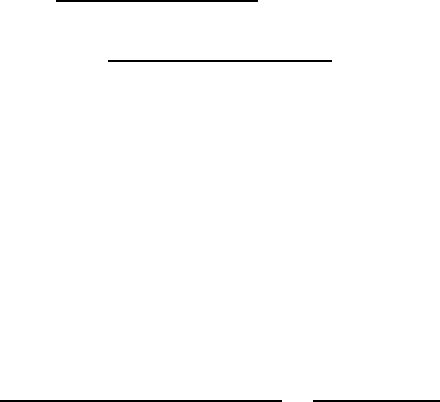
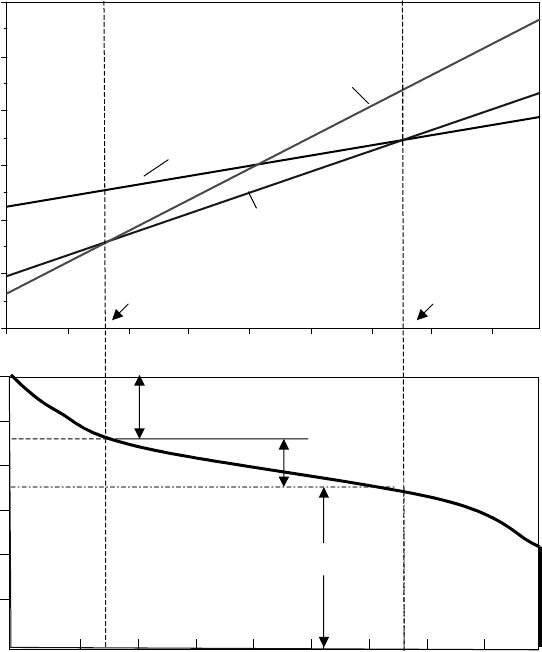
Figure 3.27 shows how total revenues required for the coal plant in Example 3.3
vary as a function of its capacity factor (or as a function of hours per year at full
power). Under the circumstances in the example, the average cost of electricity
($0.0469/kWh) is the slope of a line drawn to the point on the curve corresponding
to the 8000 hours of operation (CF = 0.9132). Clearly, the average cost increases
as CF decreases, which helps explain why peaking power plants that operate only
a few hours each day have such high average cost of electricity.
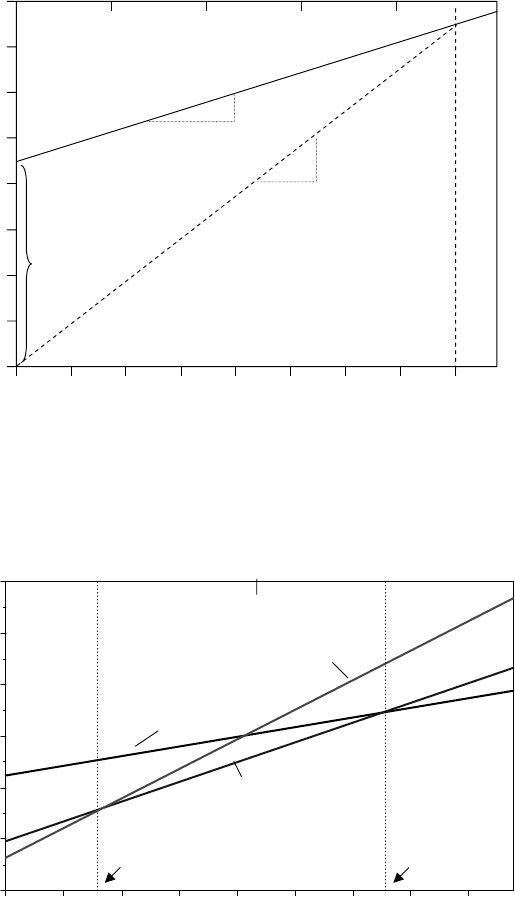
When plots like that shown in Fig. 3.27 are drawn on the same axes for
different power plants, the resulting screening curves provide the first step in
determining the optimum mix of different power plant types. The screening curve
for the pulverized coal plant in Fig. 3.27, along with analogous curves for the
combined-cycle plant and the combustion turbine described in Table 3.3, are
shown in Fig. 3.28. What these screening curves show is that the combustion
turbine, which is cheap to build but expensive to operate, is the least-cost option
as long as it doesn’t operate more than 1675 h/yr (CF ≤ 0.19), making it the
best choice for peaking power plants. The coal-steam plant, with its high capital
cost and low fuel cost, is the least expensive as long as it runs at least 6565 h/yr
140 THE ELECTRIC POWER INDUSTRY
800070006000500040003000200010000
0
50
100
150
200
250
300
350
400
Equivalent Hours Per Year at Rated Power
Capacity factor
Revenue required ($/kW-yr)
0 0.2 0.4 0.6 0.8
1.00.913
Slope = Variable costs
$0.0189/kWh
Slope = Average cost
$0.0469/kWh
Fixed
costs
$224/kW-yr
8760
Figure 3.27 The average cost of electricity is the slope of the line drawn from the origin
to point on the revenue curve that corresponds to the capacity factor. The data shown are
for the coal plant in Example 3.3.
800070006000500040003000200010000
0
100
200
300
400
500
600
Revenue Required ($/yr-kW)
Equivalent Hours Per Year at Rated Power
0 0.19 0.5 0.75 1.0
Capacity Factor
Coal-steam
Combustion
turbine
Combined-cycle
6565 hrs1675 hrs
Figure 3.28 Screening curves for coal-steam, combustion turbine, and combined-cycle
plants based on data in Table 3.3. For plants operated less than 1675 h/yr, combustion
turbines are least expensive; for plants operated more than 6565 h/yr, a coal-steam plant
is cheapest; otherwise, a combined-cycle plant is least expensive.
BASELOAD, INTERMEDIATE AND PEAKING POWER PLANTS 141
(CF ≥ 0.75), making it an ideal baseload plant. The combined cycle plant is the
cheapest option if it runs somewhere between 1675 and 6565 h/yr (0.19 ≤ CF ≤
0.75), which makes it well suited as an intermediate load plant.
3.9.2 Load–Duration Curves
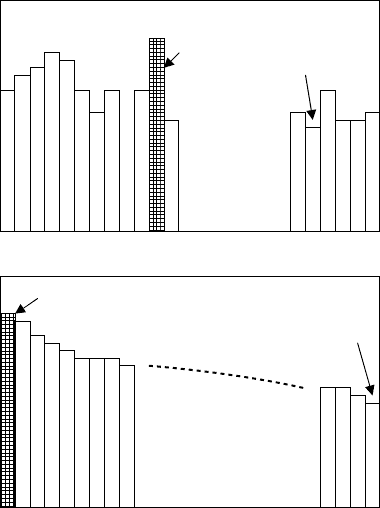
We can imagine a load–time curve, such as that shown in Fig. 3.26, as being a
series of one-hour power demands arranged in chronological order. Each slice
of the load curve has a height equal to power (kW) and width equal to time
(1 h), so its area is kWh of energy used in that hour. As suggested in Fig. 3.29,
if we rearrange those vertical slices, ordering them from highest kW demand to
lowest through an entire year of 8760 h, we get something called a load–duration
curve. The area under the load–duration curve is the total kWh of electricity used
per year.
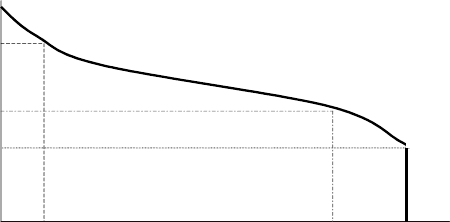
A smooth version of a load-duration curve is shown in Fig. 3.30. Notice that
the x axis is still measured in hours, but now a different way to interpret the curve
presents itself. The graph tells how many hours per year the load is equal to or
above a particular value. For example, in Fig. 3.30, the load is above 3000 MW
123456
123456
………hour number in the year... 8760
kW Demand
HOUR-BY-HOUR
LOAD CURVE...
Area of each rectangle is
kWh of energy in that
hour…
Total area is kWh/yr
LOAD CURVE
REORDERED FROM
HIGHEST TO
LOWEST..
Total area is still kWh/yr
kW Demand
Highest
Lowest
“LOAD−DURATION CURVE”
……… 8760
Highest
Lowest
Figure 3.29 A load–duration curve is simply the hour-by-hour load curve rearranged
from chronological order into an order based on magnitude. The area under the curve is
the total kWh/yr.
142 THE ELECTRIC POWER INDUSTRY
6000
5000
4000
3000
2000
1000
0
0 1000 HRS 7000 8760
INTERPRETING THE CURVE...
THE LOAD IS ALWAYS BETWEEN 2000 MW AND 6000 MW
THE LOAD IS GREATER THAN 5000 MW FOR 1000 HOURS/YR
THE LOAD IS GREATER THAN 3000 MW FOR 7000 HOURS/YR
THE LOAD IS BETWEEN 3000 MW AND 5000 MW FOR 6000 HOURS (7000-1000)
Demand (MW)
Figure 3.30 Interpreting a load–duration curve.
for 7000 h each year, and it is above 5000 MW for only 1000 h/yr. It is always
above 2000 MW and never above 6000 MW.
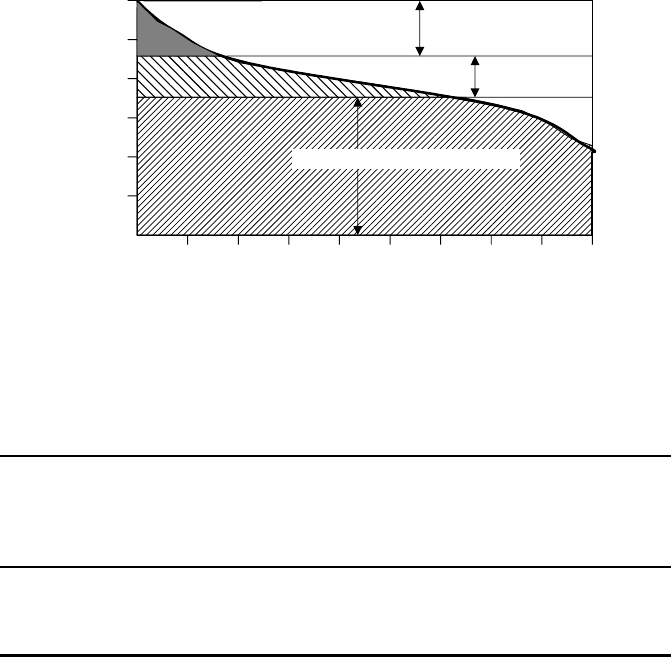
By entering the crossover points in the resource screening curves into the
load-duration curve, it is easy to come up with a first-cut estimate of the opti-
mal mix of power plants. For example, the crossover between gas turbines and
combined-cycle plants in Fig. 3.28 occurs at 1675 hours of operation, while the
crossover between combined-cycle and coal-steam plants is at 6565 hours. Those
are entered into the above load–duration curve and presented in Fig. 3.31. The
screening curve tells us that coal plants are the best option as long as they
operate for more than 6565 h/yr, and the load–duration curve indicates that the
demand is at least 3500 MW for 6565 h. Therefore we should have 3500 MW
of baseload, coal-steam plants in the mix. Combined-cycle plants need to operate
at least 1675 h/yr and less than 6565 h to be most cost-effective. The screen-
ing curve tells us that 1200 MW of these intermediate plants would operate
within that range. Since combustion turbines are the most cost effective as long
as they don’t operate more than 1675 h/yr, and the load is between 4700 MW
and 6000 MW for 1675 h, the mix should contain 1300 MW of peaking gas
turbines.
The generation mix shown on a load-duration curve allows us to find the
average capacity factor for each type of generating plant in the mix, which
will determine the average cost of electricity for each type. Figure 3.32 shows
rectangular horizontal slices corresponding to energy that would be generated by
each plant type if it operated continuously. The shaded portion of each slice is
the energy actually generated. The ratio of shaded area to total rectangle area is
the capacity factor for each. The baseload coal plants operate with a CF of about
91%, the intermediate-load combined-cycle plants operate with a CF of about
47%, and the peaking gas turbines have a CF of about 10%. Those capacity
factors, combined with cost parameters from Table 3.3, allow us to determine
the cost of electricity from each type of plant.
BASELOAD, INTERMEDIATE AND PEAKING POWER PLANTS 143
1675 6565
4700
0 8760
6000
0
3500
1000
4000
1300-MW Combustion turbines
1200-MW Combined-cycle
3500-MW Coal-steam
Hours
800070006000500040003000200010000
0
100
200
300
400
500
600
Revenue Required ($/yr-kW)
Coal-steam
Combustion
turbine
Combined-cycle
6565 h1675 h
Demand (MW)
Figure 3.31 Plotting the crossover points from screening curves (Fig. 3.28) onto the
load–duration curve (Fig. 3.30) to determine an optimum mix of power plants.
The process and results for our example utility are summarized in Table 3.4.
The baseload plants deliver energy at 4.69¢/kWh, the intermediate plants for
6.23¢/kWh, and the combustion-turbine peakers for 12.87¢/kWh. The peaker
plant electricity is so much more expensive in part because they have lower
efficiency while burning the more expensive natural gas, but mostly because
their capital cost is spread over so few kilowatt-hours of output since they are
used so little.
Using screening curves for generation planning is merely a first cut at deter-
mining what a utility should build to keep up with changing loads and aging
existing plants. Unless the load–duration curve already accounts for a cushion
of excess capacity, called the reserve margin, the generation mix just estimated
144 THE ELECTRIC POWER INDUSTRY
4700
0 8760
6000
0
3500
1300-MW CT
Hours
1200-MW CC
CF ≈ 0.10
CF ≈ 0.47
Demand (MW)
3500-MW Coal-steam CF ≈ 0.91
Figure 3.32 The fraction of each horizontal rectangle that is shaded is the capacity factor
for that portion of the generation facilities.
TA BLE 3.4 Unit Cost of Electricity from the Three Types of Generation for the
Example Utility
a
Generation Type
Rated
Power
(MW) CF
Fixed
Cost
(million
$/yr)
Var i abl e
($/kWh)
Output
(billion
kWh/yr)
Total
Cost
(billion
$/yr)
Unit
Cost
(¢/kWh)
Coal-steam 3500 0.91 784.0 0.0189 27.99 1.312 4.69
Combined-cycle 1200 0.47 115.2 0.0390 4.94 0.308 6.23
Combustion turbine 1300 0.10 83.2 0.0556 1.14 0.147 12.87
a
Electricity from the peakers is expensive because peakers are used so little.
would have to be augmented to allow for plant outages, sudden peaks in demand,
and other complicating factors.
The process of selecting which plants to operate at any given time is called
dispatching. Since costs already incurred to build power plants (sunk costs) must
be paid no matter what, it makes sense to dispatch plants in order of their oper-
ating costs, from lowest to highest. Renewables, with their intermittent operation
but very low operating costs, should be dispatched first whenever they are avail-
able; so even though their capacity factors may be low, they are part of the
baseload. A special case is hydroelectric plants, which must be operated with
multiple constraints including the need for proper flows for downstream ecosys-
tems, water supply, and irrigation while maintaining sufficient reserves to cover
dry seasons. Hydro is especially useful as a dispatchable source that may sup-
plement baseload, intermittent, or peak loads, especially when existing facilities
are down for maintenance or other reasons.
TRANSMISSION AND DISTRIBUTION 145
3.10 TRANSMISSION AND DISTRIBUTION
While the generation side of electric power systems usually receives the most
attention, the shift toward utility restructuring, along with the emergence of dis-
tributed generation systems, is causing renewed interest in the transmission and
distribution (T&D) side of the business.
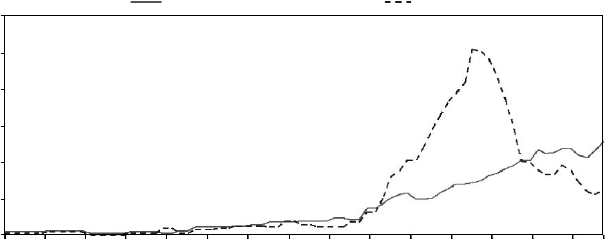
Figure 3.33 shows the relative capital expenditures on T&D over time com-
pared with generation by U.S. investor-owned utilities. The most striking feature
of the graph is the extraordinary period of power plant construction that lasted
from the early 1970s through the mid-1980s, driven largely by huge spending for
nuclear power stations. Except for that anomalous period, T&D construction has
generally cost utilities more than they have spent on generation. In the latter half
of the 1990s, T&D expenditures were roughly double that of generation, with
most of that being spent on the distribution portion of T&D.
The utility grid system starts with transmission lines that carry large blocks
of power, at voltages ranging from 161 kV to 765 kV, over relatively long
distances from central generating stations toward major load centers. Lower-
voltage subtransmission lines may carry it to distribution substations located
closer to the loads. At substations, the voltage is lowered once again, to typi-
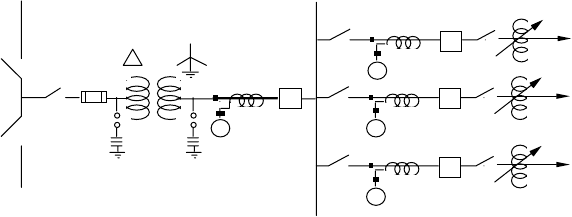
cally 4.16 to 24.94 kV and sent out over distribution feeders to customers. An
example of a simple distribution substation is diagrammed in Fig. 3.34. Notice
the combination of switches, circuit breakers, and fuses that protect key com-
ponents and which allow different segments of the system to be isolated for
maintenance or during emergency faults (short circuits) that may occur in the
system.
30
25
20
15
10
5
0
1925 1930 1935 1940 1945 1950 1955 1960
Year
Transmission and distribution Generation
$US billion
1965 1970 1975 1980 1985 1990 1996 1998
Figure 3.33 Transmission and distribution (T&D) construction expenditures at U.S.
investor-owned utilities compared with generation. Except for the anomalous spurt in
power plant construction during the 1970s and early 1980s, T&D costs have generally
exceeded generation. From Lovins et al. (2002), using Edison Electric Institute data.
146 THE ELECTRIC POWER INDUSTRY
Subtransmission
System
34.5 kV − 138 kV
Substation
Disconnect
Fuse
Distribution.
Substation
Transformer
Lightning
Arrestors
Overcurrent
Relay
Bus Breaker
Main Bus
Overcurrent
Relay
Feeder
Breakers
Feeder
Disconnect
Disconnect
Voltage
Regulators
Radial
Distribution
Feeders
4.16 kV −
24.94 kV
Figure 3.34 A simple distribution station. For simplication, this is drawn as a one-line
diagram, which means that a single conductor on the diagram corresponds to the three
lines in a three-phase system.
3.10.1 The National Transmission Grid
The United States has close to 275,000 miles of transmission lines, most of which
carry high-voltage, three-phase ac power. Investor owned utilities (IOUs) own
three-fourths of those lines (200,000 miles), with the remaining 75,000 miles
owned by federal, public, and cooperative utilities. Independent power produc-
ers do not own transmission lines so their ability to wheel power to customers
depends entirely on their ability to have access to that grid. As will be described
in the regulatory section of this chapter, Federal Energy Regulatory Commission
(FERC) Order 2000 is attempting to dramatically change the utility-ownership
of the grid as part of its efforts to promote a fully competitive wholesale power
market. Order 2000 encourages the establishment of independent regional trans-
mission organizations (RTOs), which could shift transmission line ownership to
a handful of separate transmission companies (TRANSCOs), or it could allow
continued utility ownership but with control turned over to independent system
operators (ISOs).
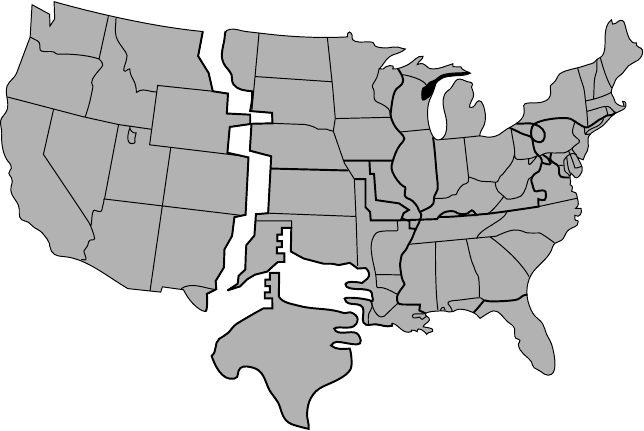
As shown in Fig. 3.35, the transmission network in the United States is orga-
nized around three major power grids: the Eastern Interconnect, the Western
Interconnect, and the Texas Interconnect. Texas is unique in that its power does
not cross state lines so it is not subject to control by the Federal Energy Reg-
ulatory Commission (FERC). Within each of these three interconnection zones,
utilities buy and sell power among themselves. There are very limited inter-
connections between the three major power grids. After a major blackout in
the Northeastern United States in 1965, the North American Electric Reliabil-
ity Council (NERC) was formed to help coordinate bulk power policies that
affect the reliability and adequacy of service within 10 designated regions of the
U.S. grid.
While almost all power in the United States is transmitted over three-
phase ac transmission lines, there are circumstances in which high-voltage
TRANSMISSION AND DISTRIBUTION 147
Texas Interconnect
Western
Interconnect
Eastern
Interconnect
ERCOT
FRCC
SERC
SPP
WSCC
MAPP
NPCC
ECAR
MAAC
MAIN
Figure 3.35 Transmission of U.S. electric power is divided into three quite separate
power grids, which are further subdivided into 10 North American Electric Reliability
Council Regions. ECAR, East Central Area Reliability Coordination Agreement; ERCOT,
Electric Reliability Council of Texas; FRCC, Florida Reliability Coordinating Council;
MAAC, Mid-Atlantic Area Council; MAPP, Mid-Continent Area Power Pool; MAIN,
Mid-America Interconnected Network; NPCC, Northeast Power Coordinating Council;
SERC, Southeastern Electric Reliability Council; SPP, Southwest Power Pool; WSCC,
Western Systems Coordinating Council. (EIA 2001).
dc (HVDC) lines have certain benefits. They are especially useful for inter-
connecting the power grid in one part of the country to a grid in another
area since problems associated with exactly matching frequency, phase, and
voltages are eliminated in dc. An example of such a system is the 600-
kV, 6000-MW Pacific Intertie between the Pacific Northwest and South-
ern California. Similar situations occur between countries, and indeed many
of the HVDC links around the world are used to link the grid of one
country to another—examples include: Norway–Denmark, Finland–Sweden,
Sweden–Denmark, Canada–United States, Germany–Czechoslovakia, Aus-
tria–Hungary, Argentina–Brazil, France–England, and Mozambique–South
Africa. The control and interfacing simplicity of dc makes HVDC links particu-
larly well suited for connecting ac grids that operate with different frequencies,
as is the case, for example, in Japan, with its 50-Hz and 60-Hz regions.
HVDC links require converters at both ends of the dc transmission line to
rectify ac to dc and then to invert dc back to ac. The converters at each end
can operate either as a rectifier or as an inverter, which allows power flow