Masters G.M. Renewable and Efficient Electric Power Systems
Подождите немного. Документ загружается.


238 ECONOMICS OF DISTRIBUTED RESOURCES
on consumption of at least 0.80 × 1000 kW = 800 kW. This can lead to some
rather extraordinary penalties for customers who add a few kilowatts to their
load right at the time of their annual peak; conversely, it provides considerable
incentive to reduce their highest peak demand.
Example 5.4 Impact of Ratcheted Demand Charges on an Efficiency
Project. A customer’s highest demand for power comes in August when it
reaches 100 kW. The peak in every other month is less than 70 kW. A proposal
to dim the lights for 3 h during each of the 22 workdays in August will reduce
the August peak by 10 kW. The utility’s energy charge is 8¢/kWh and its demand
charge is $9/kW-mo with an 80% ratchet on the demand charges.
a. What is the current annual cost due to demand charges?
b. What annual savings in demand and energy charges will result from dim-
ming the lights?
c. What is the equivalent savings expressed in ¢/kWh?
Solution
a. At $9/kW-mo, the current demand charge in August will be
August = 100 kW × $9/kW-mo = $900
For the other 11 months, the minimum demand charge will be based on
80 kW, which is higher than the actual demand:
Sept–July demand charge = 0.8 × 100 kW ×$9/kW-mo × 11 mo
= $7920
So the total annual demand charge will be
Annual = $900 + $7920 = $8820
b. By reducing the August demand by 10 kW, the annual demand charges
will now be
August = 90 kW × $9/kW-mo = $810
Sept–July = 0.8 × 90 kW × $9/kW-mo ×11 mo = $7128
Total annual demand charge = $810 + $7128 = $7938
Annual demand savings = $8820 − $7938 = $882

ELECTRIC UTILITY RATE STRUCTURES 239
August energy savings = 3h/d× 10 kW × 22 days × $0.08/kWh
= $52.80
Total Annual Savings = $882 + $52.80 = $934.80
Notice that the demand savings is 94.4% of the total savings!
c. Dimming the lights saved 3 h/d × 10 kW × 22 d = 660 kWh and $934.80,
which on a per kWh basis is
Savings =
$934.80
660 kWh
= $1.42/kWh
In other words, the business saves $1.42 for each kWh that it saves, which is
about 18 times more than would be expected if just the $0.08/kWh cost of energy
is considered.
5.2.5 Load Factor
The ratio of a customer’s average pow er demand to its peak demand, called the
load factor, is a useful way for utilities to characterize the cost of providing
power to that customer:
Load factor (%) =
Average power
Peak power
× 100% (5.1)
For example, a customer with a peak demand of 100 kW that uses
876,000 kWh/yr (8760 h/yr × 100 kW) would have an annual load factor of
100%. Another customer using the same 876,000 kWh/yr with a peak demand
of 200 kW would have a load factor of 50%. For this example, the utility would
need twice as much generation capacity and twice as much transmission and
distribution capacity to serve the customer with the lower load factor, which
means that the rate structure must be designed to help recover those extra costs.
Since they use the same amount of energy, the $/kWh charge won’t differentiate
between the two, but the demand charges $/kW-mo will. A stiff demand charge
will encourage customers to shed some of their peak power, perhaps by shifting
it to other times of day to even out their demand.
Example 5.5 Impact of Load Factor on Electricity Costs. Two customers
each use 100,000 kWh/mo. One (customer A) has a load factor of 15% and
the other (customer B) has a 60% load factor. Using a rate structure with energy
charges of $0.06/kWh and demand charges of $10/kW-mo, compare their monthly
utility bills.

240 ECONOMICS OF DISTRIBUTED RESOURCES
Solution. They both have the same energy costs: 100,000 kWh/mo ×
$0.06/kWh = $6000/mo
Using (5.1), the peak demand for A is
Peak(A) =
100,000 kWh/mo
15% × 24 h/day × 30 day/mo
× 100% = 925.9kW
which, at $10/kW-mo, will incur demand charges of $9259/mo.
The peak demand for B is
Peak(B) =
100,000 kWh/mo
60% × 24 h/day × 30 day/mo
× 100%
= 231.5 kW costing $2315/mo
The total monthly bill for A with the poor load factor is nearly twice as high as
for B ($15,259 for A and $8315 for B).
5.2.6 Real-Time Pricing (RTP)
While time-of-use (TOU) rates attempt to capture the true cost of utility service,
they are relatively crude since they only differentiate between relatively large
blocks of time (peak, partial-peak, and off-peak, for example) and they typically
only acknowledge two seasons: summer and non-summer. The ideal rate structure
would be one based on real-time pricing (RTP) in which the true cost of energy
is reflected in rates that change throughout the day, each and every day. With
RTP, there would be no demand charges, just energy charges that might vary,
for example, on an hourly basis.
Some utilities now offer one-day-ahead, hour-by-hour, real-time pricing. When
a customer knows that tomorrow afternoon the price of electricity will be high,
they can implement appropriate measures to respond to that high price. With
the price of electricity more accurately reflecting the real, almost instantaneous,
cost of power, it is hoped that market forces will encourage the most efficient
management of demand.
5.3 ENERGY ECONOMICS
There are many ways to calculate the economic viability of distributed generation
and energy efficiency projects. The capital cost of equipment, the operation and
maintenance costs, and the fuel costs must be combined in some manner so
that a comparison may be made with the costs of not doing the project. The
treatment presented here, although somewhat superficial, is intended to provide
a reasonable start to the financial evaluation—enough at least to know whether
the project deserves further, more careful, analysis.

ENERGY ECONOMICS 241
5.3.1 Simple Payback Period
One of the most common ways to evaluate the economic value of a project is
with a simple payback analysis. This is just the ratio of the extra first cost P
to the annual savings, S:
Simple payback =
Extra first cost P ($)
Annual savings S($/yr)
(5.2)
For example, an energy-efficient air conditioner that costs an extra $1000 and
which saves $200/yr in electricity would have a simple payback of 5 years.
Simple payback has the advantage of being the easiest to understand of all
economic measures, but it has the unfortunate problem of being one of the least
convincing ways to present the economic advantages of a project. Surveys consis-
tently show that individuals, and corporations alike, demand very short payback
periods—on the order of only a few years—before they are willing to consider
an energy investment. The 5-year payback in the above example would probably
be too long for most decision makers; yet, for example, if the air conditioner lasts
for 10 years, the extra cost is equivalent to an investment that earns a tax-free
annual return of over 15%. Almost anyone with some money to invest would
jump at the chance to earn 15%, yet most would not choose to put it into a more
efficient air conditioner.
Simple payback is also one of the most misleading measures since it doesn’t
include anything about the longevity of the system. Two air conditioners may
both have 5-year payback periods, but even though one lasts for 20 years and the
other one falls apart after 5, the payback period makes absolutely no distinction
between the two.
5.3.2 Initial (Simple) Rate-of-Return
The initial (or simple) rate of return is just the inverse of the simple payback
period. That is, it is the ratio of the annual savings to the extra initial investment:
Initial (simple) rate of return =
Annual savings S ($/yr)
Extra first cost P ($)
(5.3)
Just as the simple payback period makes an investment look worse than it
is, the initial rate of return does the opposite and makes it look too good. For
example, if an efficiency investment with a 20% initial rate of return, which
sounds very good, lasts only 5 years, then just as the device finally pays for
itself, it dies and the investor has earned nothing. On the other hand, if the
device has a long lifetime, the simple return on investment is a good indicator
of the true value of the investment as will be shown in the next section.
Even though the initial rate of return may be misleading, it does often serve a
useful function as a convenient “minimum threshold” indicator. If the investment

242 ECONOMICS OF DISTRIBUTED RESOURCES
has an initial rate of return below the threshold, there is no need to proceed
any further.
5.3.3 Net Present Value
The simple payback period and rate of return are just that, too simple. Any more
serious analysis involves taking into account the time value of money—that is,
the fact that one dollar 10 years from now isn’t as good as having one dollar in
your pocket today. To account for these differences, a present worth analysis in
which all future costs are converted into an equivalent present value or present
worth (the terms are used interchangeably) is often required.
Begin by imagining making an investment today of P into an account earning
interest i. After 1 year the account will have earned interest iP so it will then
be worth P + iP = P(1 + i); after 2 years it will have P(1 + i)
2
, a nd so forth.
This says that the future amount of money F in an account that starts with P ,
which earns annual interest i over a period of n years, will be
F = P(1 + i)
n
(5.4)
Rearranging (5.4) gives us a relationship between a future amount of money F
and what it should be worth to us today P :
P =
F
(1 + i)
n
(5.5)
When converting a future value F into a present worth P , the interest term i
in (5.5) is usually referred to as a discount rate d. The discount rate can be
thought of as the interest rate that could have been earned if the money had been
put into the best alternative investment. For example, if an efficiency investment
is projected to save $1000 in fuel in the fifth year, and the best alternative
investment is one that would have earned 10%/yr interest, the present worth of
that $1000 would be
P =
F
(1 + d)
n
=
$1000
(1 + 0.10)
5
= $620.92 (5.6)
That is, a person with a discount rate of 10% should be neutral about the choice
between having $620.92 in his or her pocket today, or having $1000 in 5 years.
Or stated differently, that person should be willing to spend as much as $620.92
today in order to save $1000 worth of energy 5 years from now. Notice that
the higher the discount rate, the less valuable a future payoff becomes. For
instance, with a 20% discount rate, that $1000 in 5 years is equivalent to only
$401.87 today.
When viewed from the perspective of a neutral decision—that is, would some-
one be just as happy with P now or F later—the discount rate takes on added
meaning and may not refer to just the best alternative investment. Ask people

ENERGY ECONOMICS 243
without significant financial resources—for instance, college students—about the
choice between $621 today or $1000 in 5 years, and chances are high that they
would much prefer the $621 today. In 5 years, college students anticipate having
a lot more money, so $1000 then wouldn’t mean nearly as much as $621 today
when they are so strapped for cash. That is, their personal discount rate is proba-
bly much higher than 10%. Similarly, if there is significant risk in the proposition,
then factoring in the probability that there will be no F in the future means that
the discount rate would need to be much higher than would be suggested by
the interest that a conventional alterna tive investment might earn. Deciding just
what is an appropriate discount rate for an investment in energy efficiency or
distributed generation is often the most difficult, and critical, step in a present
value analysis.
Frequently, a distributed generation or efficiency investment will deliver finan-
cial benefits year after year. To find the present value P of a stream of annual
cash flows A,forn years into the future, with a discount rate d, we can introduce
a conversion factor called the present value function (PVF):
P = A · PVF(d, n) (5.7)
For a series of n annual $1 amounts that start 1 year from the present, PVF is
the summation of the present values:
PVF(d, n) =
1
1 + d
+
1
(1 + d)
2
+···+
1
(1 + d)
n
(5.8)
A series analysis of (5.8) yields the following:
PVF(d, n) = Present value function =
(1 + d)
n
− 1
d(1 + d)
n
(5.9)
With all of the variables expressed in annual terms, the units of PVF will be years.
The present value of all costs, present and future, for a project is called
the life-cycle cost of the system under consideration. When a choice is to be
made between two investments, the present value, or life-cycle cost, for each, is
computed and compared. The difference between the two is called the net present
value (NPV) of the lower-cost alternative.
Example 5.6 Net Present Value of an Energy-Efficient Motor. Two 100-hp
electric motors are being considered—call them “good” and “premium.” The
good motor draws 79 kW and costs $2400; the premium motor draws 77.5 kW
and costs $2900. The motors run 1600 hours per year with electricity cost-
ing $0.08/kWh. Over a 20-year life, find the net present value of the cheaper
alternative when a discount rate of 10% is assumed.

244 ECONOMICS OF DISTRIBUTED RESOURCES
Solution. The annual electricity cost for the two motors is
A(good) = 79 kW × 1600 h/yr × $0.08/kWh = $10,112/yr
A(premium) = 77.5kW× 1600 h/yr × $0.08/kWh = $9920/yr
Notice how the annual energy cost of a motor is far more than the initial cost.
The present value factor for these 20-year cash flows with a 10% discount
rate is
PVF(d, n) =
(1 + d)
n
− 1
d(1 + d)
n
=
(1 + 0.10)
20
− 1
0.10(1 + 0.10)
20
= 8.5136 yr
The present value of the two motors, including first cost and annual costs,
is therefore
P(good) = $2400 + 8.5136 yr × $10,112/yr = $88,489
P(premium) = $2900 + 8.5136 yr ×$9920/yr = $87,354
The premium motor is the better investment with a net present value of
NPV = $88,489 − $87,354 = $1,135
The net present value calculation can be simplified by comparing the present
value of all of those future fuel savings A with the extra first cost of the more
efficient product P .
NPV = present value of annual savings −added first cost of better product
NPV = A × PVF(d, n) − P (5.10)
Using (5.10) with the data in Example 5.6 gives
NPV = ($10,112 − $9920)/yr × 8.5136 yr − ($2900 − $2400) = $1135
which agrees with the example.
5.3.4 Internal Rate of Return (IRR)
The internal rate of return (IRR) is perhaps the most persuasive measure of the
value of an energy-efficiency or distributed-generation project. It is also the trick-
iest to compute. The IRR allows the energy investment to be directly compared
with the return that might be obtained for any other competing investment. IRR is
the discount rate that makes the net present value of the energy investment equal
to zero. In the simple case of a first-cost premium P for the more efficient

ENERGY ECONOMICS 245
product, which results in an annual fuel savings A, it is the discount rate that
makes the net present value in (5.10) be zero:
NPV = A ×PVF(IRR,n)− P = 0 (5.11)
Rearranging (5.11), and realizing that P /A is just the simple payback period
introduced earlier, gives the following convenient relationship for finding the
internal rate of return:
PVF(IRR,n) =
P
A
= Simple payback period (5.12)
Solving (5.12) is not straightforward and may require some trial-and-error
estimates of the discount rate until the equation balances. Many spreadsheet
programs, and some of the more powerful pocket calculators, will also do the
calculation automatically. If the calculation is to be done by hand, it helps to
have precalculated values for the present value function such as those presented
in Table 5.4. To use Table 5.4, enter the table in the row corresponding to the
project lifetime and move across until the simple payback period P /A is
reached. The IRR is the interest rate in that column of the table. Of course, some
interpolation may be called for.
For example, the premium air conditioner in Example 5.6 costs an extra $1000
and saves $200 per year in electricity, so P /A = $1000/($200/yr) = 5.0
years. With a lifetime of 10 years, Table 5.4 suggests that it would have an
IRR of just over 15%. If it lasts 20 years, its IRR would be between 19% and
21%. To find the exact value would require iteration on (5.12) or interpolation
in Table 5.4.
Table 5.4 can also be used to determine the IRR when the decision maker
wants an energy payback, with interest, within a certain number of years. For
TA BLE 5.4 Present Value Function to Help Estimate the Internal Rate of Return
a
Life
(years)
9% 11% 13% 15% 17% 19% 21% 23% 25% 27% 29% 31% 33% 35% 37% 39%
1 0.92 0.90 0.88 0.87 0.85 0.84 0.83 0.81 0.80 0.79 0.78 0.76 0.75 0.74 0.73 0.72
2 1.76 1.71 1.67 1.63 1.59 1.55 1.51 1.47 1.44 1.41 1.38 1.35 1.32 1.29 1.26 1.24
3 2.53 2.44 2.36 2.28 2.21 2.14 2.07 2.01 1.95 1.90 1.84 1.79 1.74 1.70 1.65 1.61
4 3.24 3.10 2.97 2.85 2.74 2.64 2.54 2.45 2.36 2.28 2.20 2.13 2.06 2.00 1.94 1.88
5 3.89 3.70 3.52 3.35 3.20 3.06 2.93 2.80 2.69 2.58 2.48 2.39 2.30 2.22 2.14 2.07
6 4.49 4.23 4.00 3.78 3.59 3.41 3.24 3.09 2.95 2.82 2.70 2.59 2.48 2.39 2.29 2.21
7 5.03 4.71 4.42 4.16 3.92 3.71 3.51 3.33 3.16 3.01 2.87 2.74 2.62 2.51 2.40 2.31
8 5.53 5.15 4.80 4.49 4.21 3.95 3.73 3.52 3.33 3.16 3.00 2.85 2.72 2.60 2.48 2.38
9 6.00 5.54 5.13 4.77 4.45 4.16 3.91 3.67 3.46 3.27 3.10 2.94 2.80 2.67 2.54 2.43
10 6.42 5.89 5.43 5.02 4.66 4.34 4.05 3.80 3.57 3.36 3.18 3.01 2.86 2.72 2.59 2.47
15 8.06 7.19 6.46 5.85 5.32 4.88 4.49 4.15 3.86 3.60 3.37 3.17 2.99 2.83 2.68 2.55
20 9.13 7.96 7.02 6.26 5.63 5.10 4.66 4.28 3.95 3.67 3.43 3.21 3.02 2.85 2.70 2.56
25 9.82 8.42 7.33 6.46 5.77 5.20 4.72 4.32 3.98 3.69 3.44 3.22 3.03 2.86 2.70 2.56
30 10.27 8.69 7.50 6.57 5.83 5.23 4.75 4.34 4.00 3.70 3.45 3.22 3.03 2.86 2.70 2.56
a
Enter the row corresponding to project life, and move across until values close to the simple payback period, P /A, are reached.
IRR is the interest rate in that column. For example, a 10-year project with a 5-year payback has an internal rate of return of just
over 15%.
246 ECONOMICS OF DISTRIBUTED RESOURCES
109876543210
0
10
20
30
40
50
Simple Payback Period (yrs)
Internal Rate of Return (%/yr)
5-yr life
10-yr life
15-yr life
20-yr life
Initial Rate of Return
(infinite life)
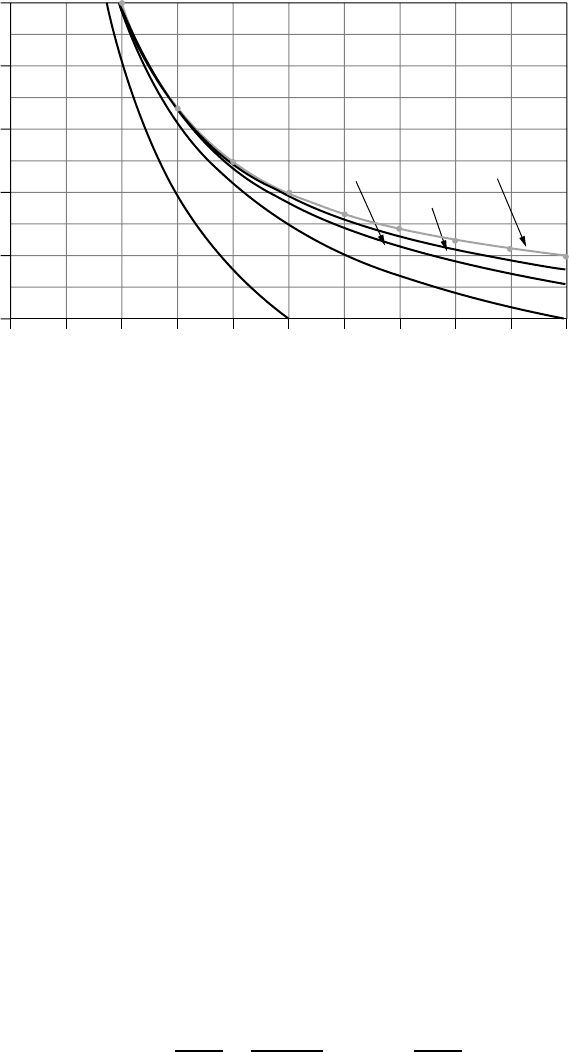
Figure 5.2 Internal rate of return as a function of the simple payback period, with
project life as a parameter. When the lifetime greatly exceeds the simple payback, IRR
approaches the initial rate of return.
example, the premium motor in Example 5.6 costs an extra $500 and saves
$192/yr, giving it a simple payback period of P /A = $500/$192 = 2.60
years. Assuming a 20-year life and using Table 5.4, the internal rate of return
is between 37% and 39% (it is actually 38.34%). Suppose management decides
that it wants to earn all of its extra $500 investment back sooner—in 5 years,
for example—with interest. That is equivalent to saying the efficiency device
has only a 5-year life. Table 5.4 indicates that the investment would still earn,
almost 27% compounded annual interest. That’s a pretty good investment!
Since it is so common for the simple payback period to be used to judge a
project, and it is so often misleading, it may be handy to use Fig. 5.2 to translate
payback into the more persuasive internal rate of return. Notice that for long-lived
projects, the initial rate of return is a good approximation to IRR.
5.3.5 NPV and IRR with Fuel Escalation
The chances are that the cost of fuel in the future will be higher than it is today,
which means that the annual amount of money saved by an efficiency measure
could increase with time. To account for that potential it is handy to have a way
to include a fuel price escalation factor in the present worth analysis.
Begin by rewriting (5.8) so that it is the sum of present values for an annual
amount that is worth $1 at time t = 0, but becomes $(1 + e)att = 1 year, and
escalates to $(1 + e)
n
in the nth year
PVF(d,e,n) =
1 + e
1 + d
+
(1 + e)
2
(1 + d)
2
+ ...+
1 + e
1 + d
n
(5.13)

ENERGY ECONOMICS 247
where d is the buyer’s discount rate and e is the escalation rate of the annual
savings. A comparison of (5.8) with (5.13) lets us write an equivalent discount
rate d
when there is fuel savings escalation e
1 + e
1 + d
=
1
1 + d
(5.14)
Solving,
Equivalent discount rate with fuel escalation = d
=
d − e
1 + e
(5.15)
The equivalent discount rate given in (5.15) can be used in all of the present
value relationships, including (5.6), (5.9), (5.10), and (5.12).
Example 5.7 Net Present Value of Premium Motor with Fuel Escalation.
The premium motor in Example 5.6 costs an extra $500 and saves $192/yr at
today’s price of electricity. If electricity rises at an annual rate of 5%, find the net
present value of the premium motor if the best alternative investment earns 10%.
Solution. Using (5.15), the equivalent discount rate with fuel escalation is
d
=
d − e
1 + e
=
0.10 − 0.05
1 + 0.05
= 0.04762
From (5.9), the present value function for 20 years of escalating savings is
PVF(d
,n)=
(1 + d
)
n
− 1
d
(1 + d
)
n
=
(1 + 04762)
20
− 1
0.04762(1 + 0.04762)
20
= 12.717 yr
From (5.10), the net present value is
NPV = A ×PVF(d
,n)− P = $192/yr × 12.717 yr −$500 = $1942
(Without fuel escalation, the net present value of the premium motor was only
$1135.)
To find the IRR when there is fuel escalation, the present value of the escalating
series of annual savings must equal the extra initial principal,
NPV = A × PVF(d
,n)− P = 0 (5.16)
PVF(d
,n)=
P
A
= Simple payback period (5.17)