Vaccari D.A., Strom P.F., Alleman J.E. Environmental Biology for Engineers and Scientists
Подождите немного. Документ загружается.

Of course, some organisms may feed at more than one trophic level. One example is
the owl mentioned just above, which eats an herbivore and a carnivore. Humans are an
example of an omnivore, which eats both plants and animals. However, this is unusual in
natural systems. An exception is certain fishes that eat their way up the food chai n as they
grow. Other examples are the fox, skunk, and black bear.
The complexity of real systems can be described more precisely as a food web, which
shows feed ing relationships on a species-by-species basis. The food web shows the
ecological dependencies of individual species more graphically than the energy pyramid.
A web can be used to help predict the effect of a disturbance. For example, elimination
of any one species from an ecosystem may increase the abundances of species that it
feeds on and decrease the abundance of those that feed on it. Figure 14.2 shows two
P – 1,500,000
P – 200,000
P – 90,000
P – 1
Grassland (summer)
P – 1,500,000
–
–
–
P – 1,500,000
–
–
–
C
3
–2
C
2
– 120,000
C
1
– 150,000
P – 200
Temperate forest (summer)
3
–
C
2
– 120,000
C
1
– 150,000
–
3
–
C
2
– 120,000
C
1
– 150,000
–
P – 96
Wisconsin lake
C
1
-11
C
2
-4
P – 96
-
-
P - 4
English Channel
C
1
-21
-
C
1
-21
(a)
(b)
Standing crop
S - 5
P – 809
C
1
-37
C
2
-11
C
3
–1.5
-
P – 809
-
-
–
(c)
Energy flow
P – 20,810
C
1
-3368
C
2
-383
C
3
-21
S - 5060
P – 20,810
-
-
-
S - 5060
(d)
Spring
C
1
-12
P – 100
C
2
-6
-
P – 100
-
C
1
-10
P – 2
C
2
-3
Winter
C
1
-10
P – 2
C
2
-3
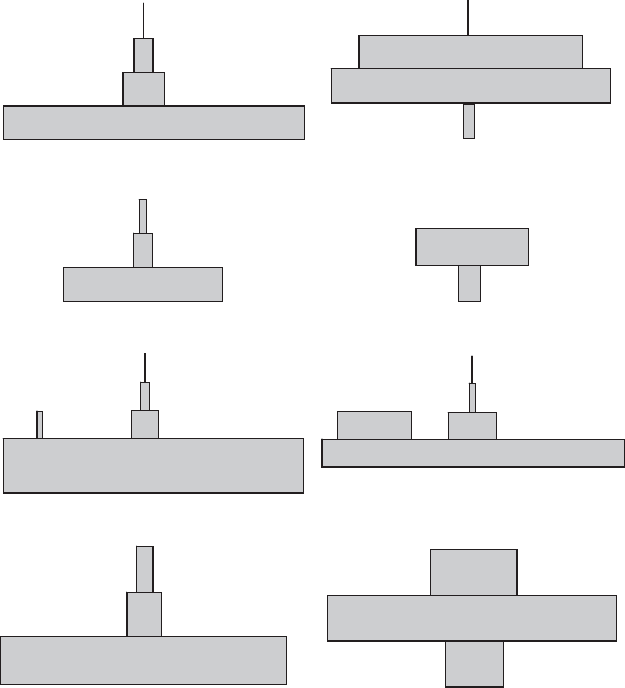
Figure 14.1 Several types of trophic pyramids. (a) Pyramid of numbers of individuals per 0.1 ha,
not including microorganisms and soil animals. (b) Pyramid of biomass (grams dry weight per
square meter). (c) Standing crop (kcal/m
2
) vs. energy flow (kcal/m
2
yr) pyramids for Silver Springs,
Florida. (d) Seasonal changes in the biomass pyramid in the water column of an Italian lake
(planktonic organisms only) (mg/m
3
). (Based on Odum, 1987.)
448
ECOLOGY: THE GLOBAL VIEW OF LIFE
Clapper rail
Fiddler Crab
Marsh
Plants
Detritus
Man
Geese
Grasshoppers
Leafhoppers
Mice
Voles
Muskrat
Raccoon
Mosquito
Killifish
Stickleback
Silversides
Sheepshead Minnow
EXPORT
Herring Gull
Mud
Algae
Glossy Ibis
Dowitchers
Terns
Gulls
Ducks
Weakfish
Shark
Snails
Mussels
Clams
Blue Crabs
Amphipods
Shrimp
Blowfish
Sea Robin
Winter
Flounder
Bluefish
Striped Bass
Summer Flounder
Spotted Sea Trout
Oyster
Oystercatcher
Ribbed
Mussel
Periwinkles
Plovers
Sandpipers
Willet
Terrapin
(a)
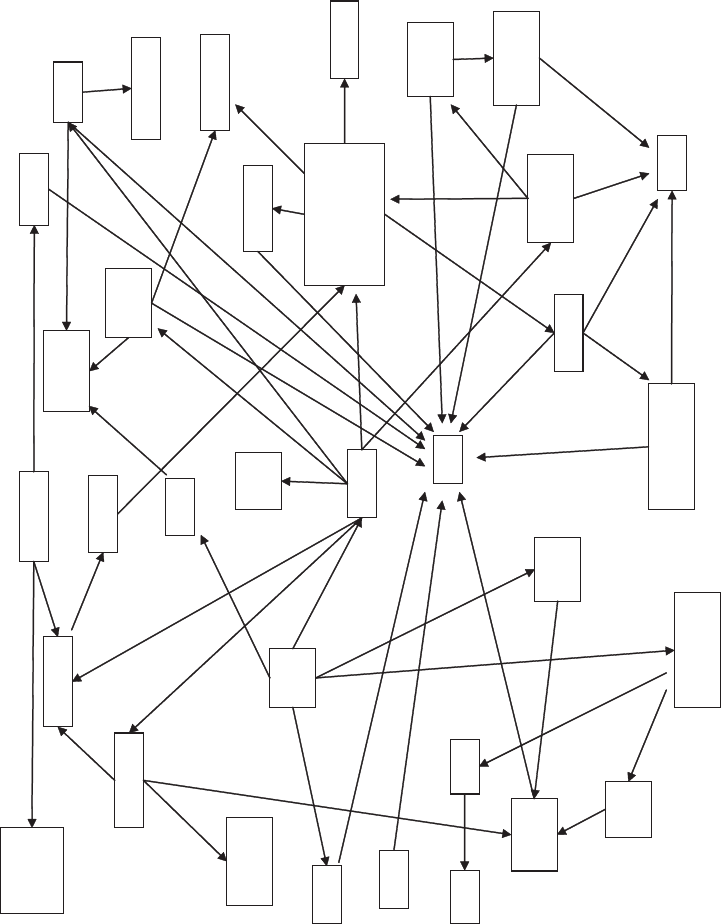
Figure 14.2
Food webs for (
a) an unpolluted and (
b) a polluted marsh/estuary. (Based on Mattson and Vallario, 1975.)
449
Clapper rail
Fiddler Crab
Marsh
Plants
Detritus
Man
Geese
Grasshoppers
Leafhoppers
Mice
Voles
Muskrat
Raccoon
Mosquito
Killifish
Stickleback
Silversides
Sheepshead Minnow
EXPORT
Herring Gull
Mud
Algae
Glossy Ibis
Dowitchers
Terns
Gulls
Ducks
Weakfish
Shark
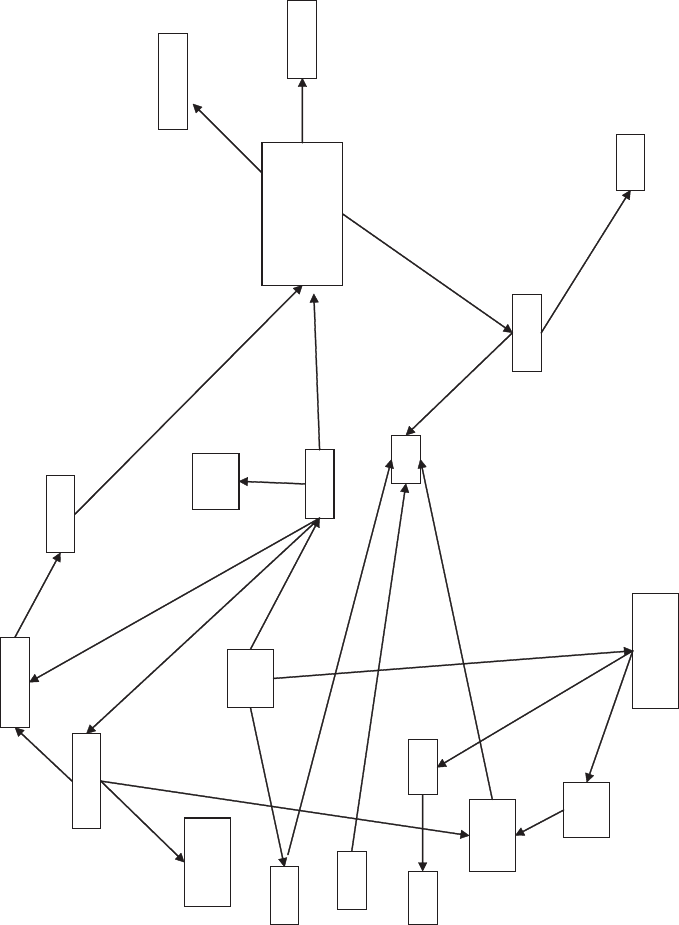
(b)
Figure 14.2
(Continued)
450
hypothetical food webs for a similar marsh, one that is unaffected by human activities, and
a second that is affected heavily by pollution.
The more species there are in an ecosystem, the more possible interactions that could
exist. Specifically, if there are s species, there could be up to s(s 1)/2 pairwise interactions.
However, in reality, each species tends to have only about two interactions on average.
Another generalization that can be made about food chains is that there tend to be about
two to three prey species for each predator, no matter how many total species are present.
The flow of energy described in this section goes one way. It starts with the solar input,
part of which is captured in gross productivity; what does not get used by the producers
forms net productivity; successive trophic levels harvest part of this and produce their own
biomass. At each step a majority of the energy is lost. Ultimately, all is returned to the
environment as heat, after doing some useful work in producing biomass at each level.
Although the ecosystem may try to optimize its use of energy, energy cannot be recycled.
The second law of thermodynamics prevents the waste heat from being collected and
reused for useful work.
14.2 FLOW OF MATTER IN ECOSYSTEMS
In contras t to the flow of energy in the ecosystem, materials can be and are recycled and
reused. The patterns in which the elements are used, stored, made available again, and
reused are called biogeochemical cycles. We have previously met biogeochemical cycles
in Section 2.5 with reference to the effects of living things on the nonliving world, and in
Chapter 13, since many of the important pathways in the cycles are catalyzed by
microbes. Whereas Chapter 13 described the details of the microbial transformations
involved, here we describe the overall cycles in quantitative terms as well as the abiotic
parts of the cycles.
Each cycle consists of a network of compartments or reservoirs, which store forms of
the element. The major compartments are the atmosphere, the biosphere, the hydrosphere,
and the lithosphere. The hydrosphere is the liquid water on Earth, including rivers, lakes,
groundwater, and the ocean. The lithosphere is the mineral part of the Earth, the crust
with its soil, rocks and sediments, and mantle and core. The amount contained in each
compartment is measured in units of mass or moles and is called the standing stock.
The compartments are linked by flows or fluxes of the element, called cycling rates,
which represent the rate at which the element moves from one compartment to the
next. The units of the cycling rates are in mass per unit time or moles per unit time.
The cycling rates may be the result of chemical or biochemical transformations, such
as the fixation of carbon by photosynthesis, or simply the transport between phases
such as the absorption of CO
2
by the oceans.
The elements constitute the basic nutrient requirements of the ecosy stem. Of interest is
the major storage compartment from which living things obtain each nutrient most
directly. In the case of carbon and nitrogen, the inorganic source for living things is the
atmosphere. Most of the other nutrients, such as phosphorus, sulfur, and potassium, ori-
ginate in the lithosphere. However, weathe ring of rocks does not provide nutrients at a
sufficient rate to replace losses of phosphorus and sulfur, and nitrification does not replace
fixed nitrogen fast enough. Thus, the ecosystem must recycle its nutrients. This is one
function of the detritus-based soil food chain. The decomposers release the nutrients in
the dead organic matter. The partially decomposed organic matter increase the adsorptive
FLOW OF MATTER IN ECOSYSTEMS 451

capacity of the soil, preventing the nutrients from being leached out and lost to the eco-
system. Thus, a healthy soil environment is a key component of an ecosystem.
However, the soil is being compromised by human activities. Erosion causes a loss of
organic-rich topsoil. Agricultural practices do more to replace lost nutrients than to
replace soil organic matter, which contributes to favorable physical soil properties as
well as chemical ones. Increased water runoff reduces infiltration, thereby reducing
weathering of bedrock and the consequent liberation of minerals . As a result, agricultural
fertilizers now need to include trace minerals in some area s.
When you examine biogeochemical cycles, an important consideration is whether or
not the cycle is at steady state. Steady state is defined as the condition in which none of
the variables are changing with time. A cycle is at steady state if all of its compartments
are at steady state, which can be determined by a simple mass balance around each com-
partment (units of each term are mass or moles per unit time):
accumulation ¼ inputs outputs reactions ð14:3Þ
A compartment is at steady state if there is zero accumulation. The only reactions that
create or destroy elements are nuclear ones, which we can ignore. (If we were doing mass
balances on compounds, such as ammonia, we would have to consider reactions.) Thus,
for a compartment to be at steady state, equation (14.3) reduces to
inputs ¼ outputs ð14:4Þ
Natural systems tend to be close to steady state, called the ‘‘balance of nature.’’ An
exception is when there is a net import or export from the ecosystem. Other exceptions
operate at long time scales, such as when a long-term storage compartment is being
formed. Examples of this are the deposition of carbonate sediments on the ocean floor,
the formation of peat deposits in marshes, and burial of organic matter being converted
over geologic time into coal or oil deposits. A system could also be disturbed from a
steady-state condition by human activities.
Another important consideration is the size of various compartments relative to the
total fluxes in or out of them. This leads to the concept of turnover time, y, for a
steady-state compartment without reac tion:
y ¼
standing stock in a compartment
input rates to that compartment
ð14:5Þ
For example, all the plants on Earth store about 600 Tg organic carbon (1 Tg ¼10
9
kg).
Photosynthesis forms about 120 Tg/yr, which is approximately balanced by respiration.
Thus, the turnover time for organic carbon in the biosphere is five years. Compartments
with short turnover times, on the order of days or weeks, respond more rapidly to distur-
bances and therefore may be more susceptible to pollution. Compartments with long turn-
over times change more slowly. However, it may take longer to recognize that a change is
occurring, and it will also be slow to recover if a significant impact does occur.
Some cycles, such as phosphorus, tend to be local in scale. Others, such as carbon and
nitrogen, include the atmosphere and the ocean as major compartments. These link all
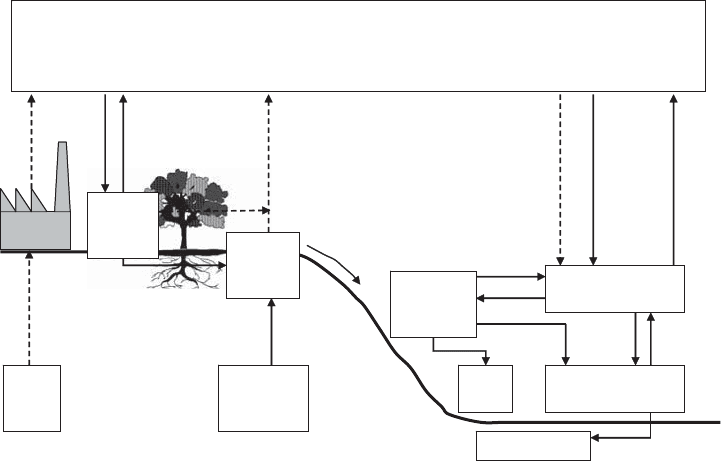
local cycles into a global cycle. Figure 14.3 shows some of the major compartment s
and fluxes associated with global cycles. In this chapter we discuss mainly global cycles.
In the next chapter we look at local cycles for particular ecosystems.
452 ECOLOGY: THE GLOBAL VIEW OF LIFE
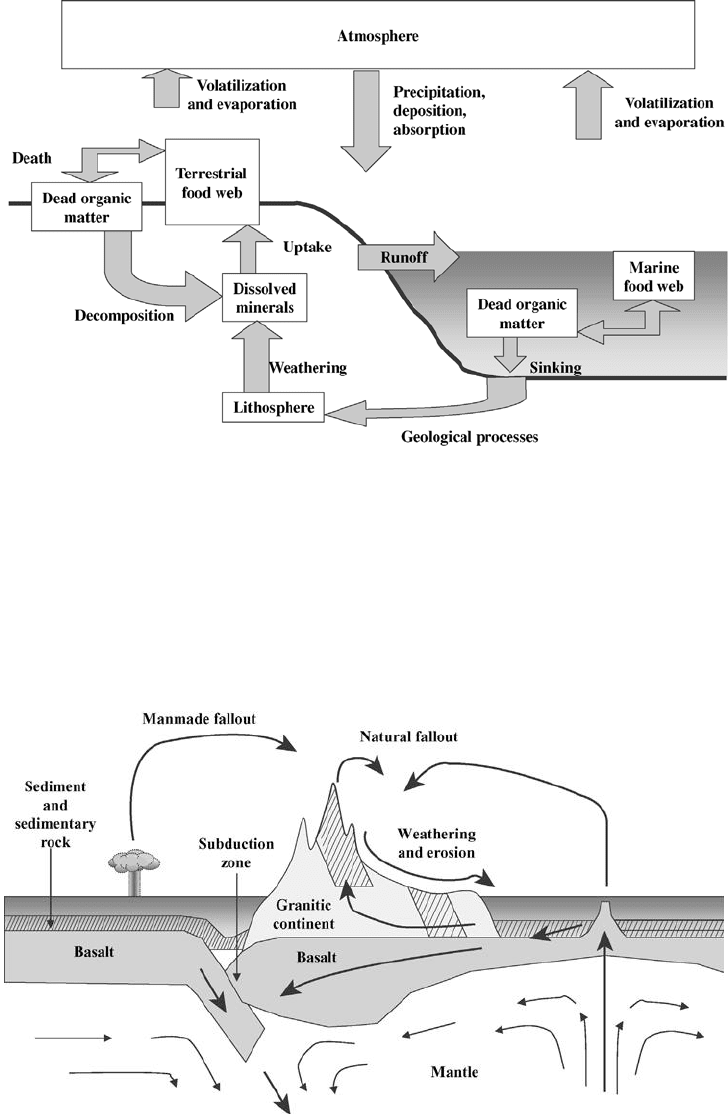
14.2.1 Sedimentary Cycles
All of the elemental cycles except for that of nitrogen are also linked to the sedimentary
cycle, in which elements are cycled through Earth’s crust (Figure 14.4). The cycling rates
associated with this are small for most elements, but this only means that the turnover
time is geologic in scale. Each of the cycles except that for nitrogen shows losses to
Figure 14.3 Generalized global biogeochemical cycle.
Figure 14.4 Sedimentary cycle.
FLOW OF MATTER IN ECOSYSTEMS 453
the ecosystem as minerals are washed to sea and eventually buried in sediments. The
losses are made up for by gains from volcanic activity or weathering of rocks. Th is
part of the cycle is closed by processes driven by geologic rock-forming activity
associated with continental drift. According to the theory of continental drift , Earth’s
crust is divided into sections called tectonic plates, which move around relative to one
another on Earth’s surface and upon which the continents ride. The motion is driven by
thermal convection in Earth’s molten mantle. The plates are formed continually at one
edge by volcanic activity. The other edge, known as the subduction zone, is slowly
pushed down into the mantle, carrying sediments with it. For example, the North Amer-
ican Plate is formed by volcanic activity at the mid-Atlantic ridge. Along the west coast of
North America it is pushing over the Pacific Plate, forming a subduc tion zone there.
In the sedimentary cycle, buried minerals may follow several pathways to reenter the
surface cycles. In the longest path they are carried into, and become part of, Earth’s man-
tle. Eventually, they may resurface at a plate formation site. Other substances, especially
the volatile sulfur and carbon dioxide, are expelled to the atmosphere by volcanic activity
near the subduction zone. A third route is the crustal pathway. Buried sediments even-
tually consolidate to form sedimentary rocks, such as shale and limestone. Heat and
pressure from deep burial may transform these into metamorphic rocks, such as slate
and marble. Tectonic motion can cause parts of the continental masses to fold and crum-
ple, forming mountains. This may raise their rocks above the surface, exposing them to
erosion and making them available to the biosphere.
Living things act to reduce the rate at which minerals liberated by weathering return to
the sedimentary cycle. Plants take up minerals faster than weathering makes them avail-
able. When plants and other living things die, the detritus food chain helps recycle them
within the ecosystem. The saprotrophs release the miner als in close association with
plants, so they can be reused immediately before they are lost. In this way most of the
minerals in som e ecosystems, such as the tropical rain forest, are stored in living things.
Little is held in the soil.
14.2.2 Carbon Cycle
Carbon forms the backbone of biochemical compounds, and its fixation by primary pro-
ducers coincides with the first biological step in the energy pyramid. Furthermore, the
carbon cycle is at the center of one of the most important environmental impacts of human
activities. Figure 14.5 illustrates some of the major parts of the global carbon cycle. The
largest compartment shown is the ocean , which contains carbon mostly as dissolved car-
bonates. The ocean stores about 50 times as much CO
2
as the atmosphere does and has a
very large turnover time of about 350 years. Terrestrial plants have a turnover time of less
than five years. However, soil organic matter turns over about every 25 years. The biomass
and soil organic matter form the major reservoir of reduced carbon, other than fossil fuels.
The importance of the carbon cycle reactions was dramatized by the experience of
the Biosphere II project in Oracle, Arizona (the Earth is Biosphere I). Biosphere II is a
1.27-ha (3.15-acre) closed structure originally designed to support a crew of eight for
several years without any food or other material supplies from the outside. It contained
simulated ocean, desert, and forest ecosystems, as well as agricultural areas, plus an inter-
connected atmosphere. Thus, it was a highly visible, if only semiscientific, examination of
a closed ecosystem. However, once the crew of eight was sealed inside in September 1991
for an initial two-year mission, it soon became apparent that oxygen was disappearing
454 ECOLOGY: THE GLOBAL VIEW OF LIFE
from the system. Eventually, the oxygen concentration dropped from the normal 21% to a
dangerous 14%, and the total volume of the atmosphere decreased. (Huge, flexible
‘‘lungs’’ connected to the system gradually collapsed to maintain atmospheric pressure
within.) It was suspected that the oxygen was being lost to respiration, but mysteriously,
the increase in CO
2
from 330 ppmv to 4000 pp mv could not account for this. The high
CO
2
levels lowered the pH of the crew’s blood, which decreased the ability of their blood
hemoglobin to carry oxygen. This, combined with the low oxygen level, led to complaints
of fatigue among the crew. Ultimately, it was determined that the soil that Biosphere II
was started with contained soil organic matter that was degrading, consuming oxygen and
producing CO
2
. The CO
2
then reacted with lime [Ca(OH)
2
] in the concrete structure, pro-
ducing calcium carbonate. Oxygen had to be brought into the facility, breaking the goal of
achieving a closed ecologi cal system. (Note: Biosphere II is now run as an educational
and research facility, http://www.bio2.edu.)
Despite its low concentration, atmospheric CO
2
is a significant compartment. Its turn-
over time in Earth’s atmosphere is about three years. Atmospheric CO
2
is an important
‘‘greenhou se gas’’ that affects the temperature of the Earth. In preindustrial times its con-
centration was about 280 ppmv (parts per million by volume). However, it is now about
350 ppmv and increasing by 1.5 ppmv per year. This level is already higher than levels
going back 160,000 years, based on measurements in bubbles trapped in Antarctic ice
core samples. Over that period, Earth’s temperature correlated with atmospheric CO
2
con-
centration. At the current rate of increase, it will be double the preindustrial level in sev-
eral decades.
It is well established that such an increase will trap an additional 4.35 watts (W) per
square meter at Earth’s surface, compared to the 235 W/m
2
normally absorbed by the
Fossil
fuel
6000
5
Atmosphere
720
Photosynthesis
and respiration
120
Deforestation,
land use change
and burning
0 - 2
Carbonate
rocks
10,000,000
Exchange
90
Absorption
2
40
Rivers
0.5 - 2
Intermediate and
deep water 35,000
1020
Marine
biota
3
DOC
<700
6
50
4
91.6
100
0.2
Sediments 150
Soil and
detritus
1500
Land
plants
500-800
Ocean surface
Figure 14.5 Global carbon cycle. Reservoirs units are 10
15
g C, flux units are 10
15
g C/yr. (From
Odum, 1987.)
FLOW OF MATTER IN ECOSYSTEMS 455
surface. What is not so well settled is how much this extra heat energy will increase the
temperature at the surface, called the global warming or greenhouse effect. A variety of
mathematical climate models have been developed which predict an increase of from
1.5
C to 4.5
C, with a mos t likely value of 2.5
C. Besides potentially affecting tempera-
ture, climate, and sea level, the change in CO
2
could directly affect living things by fer-
tilizing plant growth (Section 15.6). Potential ecological effects of global warming are
described in Section 15.6.
Figure 14.5 shows primary productivity to be in equi librium with plant and soil respira-
tion. Fossil-fuel combustion contributes an extra 5:3 10
15
g C/yr. In addition, about
1:0 10
15
g C/yr comes from deforestation. However, only about 2:9 10
15
g C/yr
actually accumulates in the atmosphere. It is thought that the oceans absor b about
2:2 10
15
g C/yr of the industrial contribution, about 42%. This leaves 1:2 10
15
g C/yr
unaccounted for, called ‘‘unknown sinks.’’ It must be emphasized that global fluxes are
difficult to measure. There is uncertainty whether terrestrial plants are increasing their
removal of CO
2
from the atmosphere as its concentration increases, or whether such an
effect is counterbalanced by human deforestation.
Atmospheric carbon is also present as carbon monoxide and methane. The turnover
times for these are 0.1 and 3.6 years, respectively, compared to 4 years for CO
2
. Methane
is also a greenhouse gas. Although less important than CO
2
, it is increasing faster, having
already increased from about 700 ppbv (parts per billion by volume) in preindustrial
levels to 1714 ppbv in 1992. Methane has many biogenic sources, including anaerobic
degradation in wetland sediments and bacteria living symbiotically in the gut of termites.
Anthropogenic sources contribute two-and-one-third times the natural sources. About half
the anthropogenic sources are associated with food production, including rice paddies,
biomass burning, and from livestock which belch gases formed by anaerobic bacteria
in their gut. About one-fourth the anthropogenic source is from fossil-fuel use.
Two other greenhouse gases should be mentioned. Halocarbons are synthetic com-
pounds used for refrigeration (e.g., Freon) among other things. They are highly stable,
having half-lives in the atmosphere measured in decades. The most harmful forms have
been banned because of their ability to destroy stratospheric ozone, and levels have
stopped increasing. About two-thirds of the total nitrous oxide (N
2
O) emissions are
anthropogenic, and most of those are from tropical agriculture. N
2
O has increased 13%
over preindustrial levels.
At their current levels, these four gases trap an estimated 2.45 W/m
2
at Earth’s surface.
About 64% of this is due to CO
2
, 19% to methane, 11% to halo carbons, and 6% to nitrous
oxide. An increase in extreme weather events has been noted worldwide. Global tempera-
tures have increased 0.3 to 0.6
C since measurements began in 1856. About half of
that increase has come in the last 40 years, and the years 1990, 1991, 1994, 1995 were
warmer than any of the years that preceded them. There are some who suggest that these
changes may be natural, such as due to changes in solar output. Nevertheless, most scien-
tists who have studied the data agree that these emissions have already produced detect-
able changes in Earth’s climate and that their effects will have serious consequences for
the Earth.
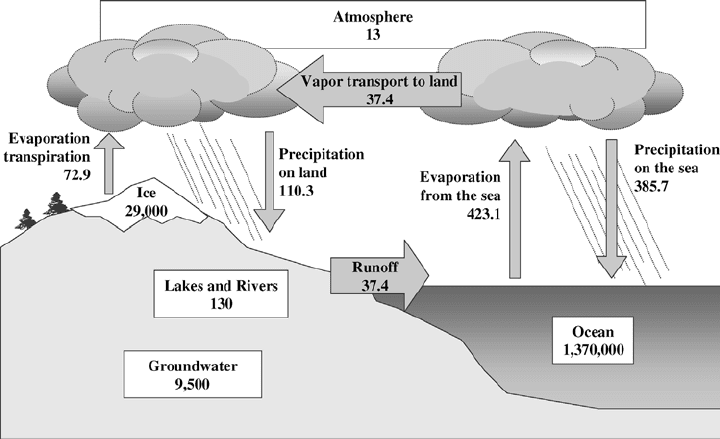
14.2.3 Hydrologic Cycle
The hydrologic or water cycle does not have any major flux components that are biolo-
gical (Figure 14.6). Although water is consumed by photosynthesis and produced by
456 ECOLOGY: THE GLOBAL VIEW OF LIFE
respiration, these are very minor compared to other sources. The energy in rainfall does
contribute an energy subsidy to ecosystems, as in rivers where it provides energy for
transport of organisms and nutrients and for oxygenation of the water. And, of course,
it provides water itself, the single compound that makes up the great majority of the
mass of almost all living things. Water is the most common limiting factor in terrestrial
productivity.
The biota affect the hydrologic cycle in several ways. In the process of evapotrans-
piration, plants withdraw moisture from the soil and evaporate it from their leaves. Plants
also cool the soil by shading and evaporative cooling. Roots, detritus, and soil organic
matter greatly increase the water-holding capacity of the soil.
14.2.4 Nitrogen Cycle
Nitrogen is the mos t common limiting factor in ecosystem productivity after water.
Organisms require it to form all the amino acids and nucleic acids. Although N
2
is ubi-
quitous, it is not available to most organisms. The important role of microorganisms in
catalyzing the fixation of N
2
to ammonia was discussed in Section 13.2.1. Nitrogen fixa-
tion also occurs abiotically in nature by lightning and fire, but this results in nitrogen oxi-
des instead of ammonia. In fact, oxygen and nitrogen in the atmosphere are unstable
thermodynamically. If they are heated together to a high enough temperature, they
react to form nitroge n oxides. Thus, combustion processes from cooking fires to automo-
biles add to nitrogen fixation. Nitrogen oxides in the atmosphere can form nitrous and
nitric acids, components of acid precipitation, described below. They also react with
hydrocarbons to form photochemical smog, an irritating mixture containing ozone and
nitrogenous organics. Another industrial source of fixed nitrogen is the Haber–Bosch
Figure 14.6 Hydrologic cycle. Reservoirs units are 10
18
g C, flux units are 10
18
g C/yr. (From
Odum, 1987.)
FLOW OF MATTER IN ECOSYSTEMS 457