Yao N. Focused Ion Beam Systems: Basics and Applications
Подождите немного. Документ загружается.

A slow ion (with velocity v lower than the velocity of the conduction
electrons of the target) represents a strong perturbation to the collision
system. A linear response theory for fast ions is not valid to treat the slow
ion–target interaction [32]. The recent nonlinear response theory of the
electronic stopping power expresses the electron excitation in a free electron
gas, in terms of elastic scattering of the electrons at the Fermi energy, E
F
,
with the intruding ion [33]. According to the nonlinear response theory, the
inverse mean free path (MFP) of projectile ion or recoiled target atoms to
excite the electron of interest is calculated as:
1
l
inel
¼
3n”
4
p
2”
F
2
X
1
l¼0
X
1
m¼0
ð2l þ 1Þð2m þ 1Þ
· f1 cos 2–
l
ðE
F
Þcos 2–
m
ðE
F
Þþcos½2ð–
l
ðE
F
Þ–
m
ðE
F
ÞÞg
·
Z
1
1
ð1 xÞ
1=2
P
l
ðxÞP
m
ðxÞdx; ð4:9Þ
where, –
l,m
are the phase shifts for the scattering of a conduction electron at
E
F
by the potential of the intruding ion or the recoiled target atom at rest.
The quantities n and P
l,m
are the density of conduction electrons and the
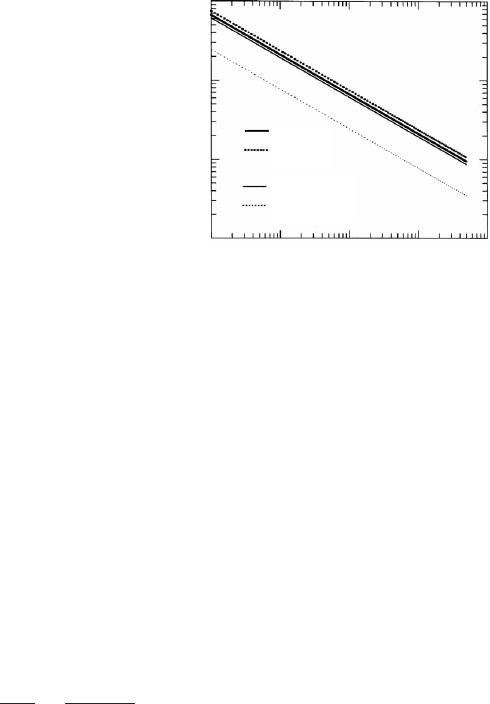
Legendre polynomials, respectively. Figure 4.5 shows the energy dependence
of the calculated MFPs of a Ga ion, and recoiled target atoms in aluminum
(Al) and gold (Au). The inverse MFP is directly proportional to v (or the
square root of the energy) and n, so that the number of excited electrons
increases with increasing v and depends upon the electron shell structure of
the target atoms, and the atomic number, Z
2
.
Ga in Al
Ga in Au
Al in Al
Au in Au
Ener
gy
(eV)
10 10
2
10
3
10
4
10
5
10
–1
1
10
10
2
MFP, l
inel
(nm)
Figure 4.5 Energy dep endence of MFPs for electron excitation by a Ga ion,
and recoiled Al and Au atoms in Al and Au [34]. The MFPs are calculated
using the nonlinear response theory developed by Echenique et al.[32].
Focused ion beam systems98

Transport of secondary electrons to solid surfaces
The second stage in kinetic emission is the transport of excited SEs to the
surface. Energetic electrons may lose their original energy in a sequence of
inelastic collisions to other target electrons, including an electron multi-
plication by the cascade process.
For a metal with conduction electrons the electron excitations are very
efficient in the slowing down processes. The stopping power for electrons in
metals has a maximum between 100 eV and 1 keV (see Figure 4.4), and
depends strongly on the density of conduction electrons. For electron exci-
tation by a primary electron, the differential inverse MFP, (E, !), of an
electron with an energy E is described by the complex dielectric response
function, Im[1/e(!, k)], i.e.,
ðE; !Þ¼
1
E
Z
kþ
k
dk
k
Im
1
"ð!; kÞ
; ð4:10Þ
and the integration of (E, !) over the allowed values of k yields the inverse
MFP. Here ! and k are the energy and momentum transfers to conduction
electrons, and k± ¼2
1/2
[E
1/2
(E !)
1/2
] in atomic units. Optical data of the
target material for the k ¼0 limit, "(!, 0), can be connected to "(!, k)
according to an ‘‘optical-data’’ model developed by Penn [35], and by Ashley
[36]. Since the optical data are based on the experimental results, it includes
complicated processes of the inter-band, intra-band, and some other transi-
tion mechanisms automatically, in addition to the single and bulk-plasmon
excitation of conduction electrons, which can be treated by the Lindhard
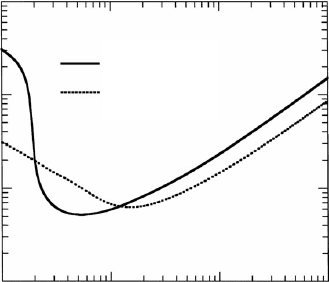
dielectric function. Figure 4.6 shows the energy dependence of the calculated
MFPs of electrons in Al and Au.
The electron energy loss is substantially influenced by the possible existence
of an energy gap E
g
, i.e., whether or not the material is an insulator. Elec-
trons, which possess less energy than E
g
, cannot lose energy by electronic
excitation. Therefore, the energy loss of SEs in the insulator takes place via
inefficient collisions with core atoms though their density fluctuation, i.e.,
phonons.
The elastic scattering is caused by the core atoms, but electron–electron
collisions may lead to directional changes as well. The frequent collisions
lead to a completely isotropic distribution of SEs in the solid. The MFP for
elastic scattering can be calculated using the partial wave expansion cross
section with appropriate solid-state potential [37] or using screened
Rutherford formula where the energy-dependent screening parameters are
used [38].
Imaging using electrons and ion beams 99
Escape of secondary electrons in vacuum
The third stage, the ejection over the surface barrier, accounts for the
selection of the SEs that are emitted. Since the majority of the SEs have an
energy in the ranges of eV and tens of eV, the SE emission is strongly affected
by the surface barrier, the magnitude of which ranges from a few eV up to
20 eV. The commonly accepted treatment implies that the SEs have to pass a
barrier of height, U ¼8 þE
F
, which is the distance from the bottom of the
conduction band to the vacuum level, in such a manner that the energy
component parallel to the surface is conserved. The component perpendi-
cular to the surface is reduced with U, so that the internal threshold energy
for escape is E ¼U.
The kinetic emission occurs if the projectile ion gives a conduction electron
sufficient kinetic energy to overcome the surface barrier U. This leads to a
threshold energy for kinetic emission, E
th
¼(1/2)M
1
v
2
th
, where v
th
¼(1/2)
v
F
[(1 þ8E
F
)
1/2
1] and M
1
is the ion mass. The threshold energy for Ga ions
is 10.7, 18.8, and 26.6 keV for Al, Cu, and Au, respectively, which is incon-
sistent with experiments on the kinetic electron emission observed at only a
few keV. Such inconsistencies have already been observed for other heavy
ions [39,40]. This has been considered to be due to the electron promotion
mechanism modeled recently for electron excitation within kinetic emission
processes [41], including the inner shell electrons, as well as conduction
electrons. The mechanism promotes the electrons to higher and vacuum
levels during close collisions with material atoms. For simplicity, the kinetic
emission below an energy E
th
may be also treated as a reduction in the surface
1
10
10
2
10
–1
10
10
2
10
3
10
4
Ener
gy
(eV)
MFP. l
inel
(nm)
e in Al
e in Au
Figure 4.6 Energy dependence of inelastic MFP of electrons in Al and Au
[34]. The MFPs are calculated using the optical-data model by Ashley [36].
Focused ion beam systems100
barrier energy U; e.g., 0.5E
F
þ8, which has been arbitrarily chosen. With
decreasing surface barrier energy, the SE yield increases and the threshold
energy is significantly reduced. For electron-induced SE emission, however,
the reduction of the surface barrier energy causes a much smaller increase in
the SE yield [42].
For insulators the surface barrier U is determined by the electron affinity
E
A
. Usually, the value of E
A
from 0 to 1 eV. The average electronic stopping
power of insulators for ions is similar for metals of comparable atomic
numbers, but the stopping power for the migration of low-energy SEs and the
magnitude of surface barrier are much smaller for the insulating material. As
a result, the SE yield from insulators is much larger than the yield for metals
of comparable atomic numbers.
4.2.3 Monte Carlo simulation of ion-induced kinetic secondary
electron emission
As mentioned above, the kinetic emission is modeled in SE excitation in a
solid, transport of the SEs to the surface, and their escape through a surface
barrier. The SE is excited by three collision processes; one due to collisions
between projectile ions and target electrons, one due to collisions between
recoiled target atoms and target electrons, and one due to collisions between
excited SEs and other target electrons.
The basic concept for a Monte Carlo model is to simulate trajectories of a
projectile ion penetrating into the target bulk and of recoiled target atoms
and excited SEs traveling towards the surface in the basis of the binary
collision approximation [43] with given mean free paths (MFPs) for elastic
and inelastic collisions. The motion of projectile ions and recoiled target
atoms are treated in the same way: the straight free flight path is determined
from the total MFP, l
tot
, defined as 1/l
el
þ1/l
inel
, using a random number.
The elastic MFP, l
el
, is fixed at N
1/3
where N is the atomic density of the
target. Depending on each of the inverse MFPs, l
el
and l
inel
, either elastic
collision or inelastic collision (i.e., SE excitation) is chosen using another
random number.
If elastic collision is chosen, the scattering angle is determined using a so-
called scattering integral with appropriate interatomic potential, or any
asymptotic procedure [44]. The elastic energy loss is calculated within a clas-
sical collision scheme, and in each elastic collision, a new recoiled target atom
is generated. If inelastic collision is chosen, the particle loses its energy and
excites an SE. The energy of the excited SE is equal to the energy loss of the
particle, e.g., (4.8), which is calculated from a head-on collision of the particle
Imaging using electrons and ion beams 101
with a conduction electron. The initial directional angle of the excited elec-
tron is calculated using the energy and momentum conservation law.
The excited SEs interact with the target through elastic collisions with the
target core atoms, and through excitations of other target electrons. The
trajectory of each SE is chosen as a series of random numbers to determine
the path length between collision events, the type of collision that has taken
place and the energy loss or the scattering angle. In each inelastic process,
SEs are excited, so that an electron cascade is generated. The electron cascade
model can also be applied for the simulation of SE emission by electron
bombardment [45–51].
4.3 Comparison between secondary electron images in SIM and SEM
Contrast mechanisms in SIM images have been discussed [9,52,53] and they
fall largely into the categories of material contrast, topographic contrast, and
channeling contrast. Although the contrast mechanism present in the SIM
images is similar to that in SEM, there are some differences. In this section
SIM and SEM images are discussed from a viewpoint of interaction between
ion or electron beams and samples. While SIM advantages include high
contrast sensitivity to surface topography and crystal grain (channeling),
drawbacks include sample surface damage and ion implantation. Therefore,
beam charging for insulator samples and image deterioration due to surface
sputtering and contamination will be presented in this section.
4.3.1 Material contrast
Material contrast arises from differences in the yield of SEs as a function of
atomic number Z
2
of samples. In experiments, the SE emission in SIM shows
a decrease with increasing Z
2
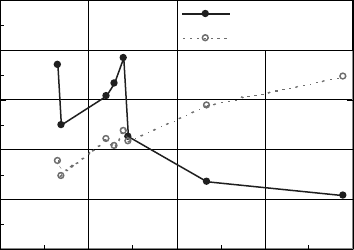
[7,8,54]. Figure 4.7 shows the relative SE
intensities as a function of Z
2
for SIM and SEM images. The SE intensities
were measured for Al, Si, Cr, Fe, Ni, Cu, Ag, and Pt bombarded both by
30 keV Ga ions in the FIB (Hitachi FB-2000A) system and by 5 keV electrons
in the SEM (Hitachi S-4200). The SE intensities for the SIM broadly descend
with increasing Z
2
, being superimposed with a fine structure. The SE inten-
sities for the SEM, on the other hand, show Z
2
-dependency increasing with
Z
2
, commonly known as material contrast.
Recently, Monte Carlo (MC) simulations on the SE emission have revealed
the origin of the difference in the material contrast between SIM and SEM
images [4,34,42,54,55]. SEs are produced along the entirety of the trajectory
of a projectile particle penetrating into the sample material. Due to their low
Focused ion beam systems102
excitation energy and energy loss in inelastic collisions before reaching the
surface, only a small fraction of the SEs can overcome the surface barrier to
escape into the vacuum. The SE yield increases due to the existing back-
scattered electrons (BSEs), which scatter backwards inside the material and
approach the surface to excite additional SEs that can escape from the sur-
face barrier [11,34]. Since the electron backscattering coefficient increases
with increasing Z
2
, the SE yields of high- Z
2
metals under electron bom-
bardment are dominated by the additional electron excitation by the BSEs on
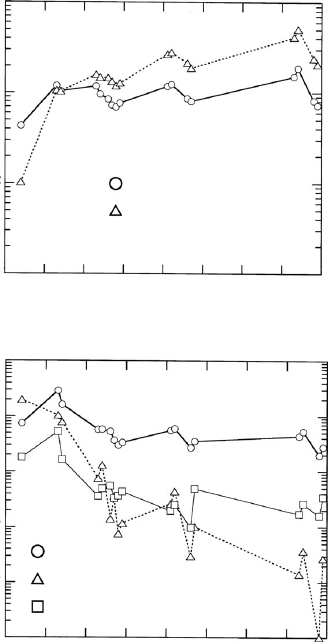
their way out, as shown in Figure 4.8(a). Furthermore, it shows that the
general increase in the SE yield with increasing Z
2
, which has been observed
in experiments [7 ,8, 54], is mainly caused by the increase in the number of SEs
excited by the BSEs.
For bombardment with light ions, such as hydrogen (H) ions, the projectile
ion backscattering is effective in the kinetic emission as well [56], whereas for
relatively heavy, Ga ions, it is much less important, due to the small back-
scattering coefficient. A more important factor in the kinetic emission due to
the bombardment of Ga ions is the electron excitation by recoiled material
atoms, which receive a large fraction of the total kinetic energy of the pro-
jectile ion in frequent elastic collision events. Therefore, the electron excita-
tion can be split into three components, as shown in Figure 4.8(b): one due to
excitation by a projectile ion, one due to excitation by the recoiled material
atoms and one due to excitation by the excited SEs, i.e., the electron cascade.
With increasing Z
2
, the component from the projectile ion, which dom-
inates the total SE yield, generally decreases while showing a fine structure.
This general decrease is because a large energy transfer from the Ga ion to
100
80
60
40
20
0
0
20
40
60
80
Target atomic number, Z
2
0
20
40
60
80
100
Pt
Ag
Cu
Cr
Si
Fe
Ni
Al
d (arb. units)
g (arb. units)
g (Ga; 30 keV)
d (e; 5 keV)
Figure 4.7 Relative SE intensities as a function of Z
2
for the Ga-SIM and
SEM images [54].
Imaging using electrons and ion beams 103
the heavier material atoms causes the ion velocity to decrease steeply just
after incidence. The lowering of the ion velocity leads to a lowering in the
electron excitation probability or the inverse MFP for electron excitation (see
(4.9)). Due to the decreasing excitation energy with increasing mass of the
recoiled atoms, the component from the electron excitation by the recoiled
material atoms decreases with increasing Z
2
. As a result, a strong decrease in
the total SE yield with increasing Z
2
is obtained for Ga ion bombardment.
The component from the electron cascade is less important for such heavy
1
1
10
–1
10
–1
10
–2
10
–3
10
–4
10
–5
10
–2
10
–3
0
10
20
30
40 50 60
70
80
0
10
20
30
40 50 60
70
80
Target atomic number, Z
2
Target atomic number, Z
2
Partial electron yields, d
t
and d
r
Partial electron yields, g
i
, g
r
,
and g
e
d
t
(trapped electrons)
d
r
(reflected electrons)
g
i
(Ga ions)
g
r
(recoiled atoms)
g
e
(electron cascade)
(b) 30 keV Ga
(a) 10 keV e
Figure 4.8 Parti al SE yields due to electron excitations (a) by primary
electrons backscattered from the surface and finally trapped inside the
material for 10 keV electron bombardment, and (b) by projectile ions,
recoiled material atoms , and electron cascades for 30 keV Ga ion
bombardment, as a function of the atomic number, Z
2
, of material atoms
[34]. The lines are only intended as a guide for the eye.
Focused ion beam systems104
ions. For light ions, however, most of the SEs are excited by the electron
cascades in the same manner as electron bombardment [57].
The Z
2
dependence is characterized by a fine structure relating to the
periods of the periodic system. Furthermore, a different structure from the
case for electron bombardment was observed in Z
2
dependence for heavy ion
bombardment [58]. Such fine structures are calculated for both Ga ion and
electron bombardments. For Ga ion bombardment, the components from
the electron excitation by the recoiled material atoms and the electron cas-
cade change with Z
2
in a different manner from the SE yield for electron
bombardment. The SE yields for electron bombardment correlate with the
density of conduction electrons, so that they are proportional to the stopping
power. This indicates the dominant contribution of bulk properties of
the target materials. However, due to large elastic energy loss of projectile
ions and surface effects (e.g., the work function), the SE yields for slow,
heavy ion bombardment are not directly proportional to the electronic
stopping power [59].
There is much difference in the potential of electron multiplication
between the SEs excited by Ga ions and by primary electrons [42,54,57]. The
mean energies of SEs excited by 10 keV Ga ions are as low as approximately
7–15 eV, decreasing with an increasing Z
2
. The mean velocity of recoiled
target atoms also decreases with an increasing mass under identical energy.
The excited SEs with low energies have poor potential in the SE multi-
plication and also have less chance than the SEs to escape from the surface.
Therefore, the SE yield generally decreases with an increasing Z
2
. For elec-
tron impact in SEM, on the other hand, the mean energy of electrons excited
by 10 keV electrons is as high as approximately 40–60 eV, increasing with an
increasing Z
2
(contrary to the case of Ga ion impact). Then, the SE yield
increases with an increasing Z
2
, as it is contrary to the SE yield under Ga ion
bombardment.
4.3.2 Topographic contrast
Topographic contrast is familiar to anyone who has seen an SEM image of
an irregular object. In general, topographic contrast in SIM has been
explained in a similar manner to topographic contrast in SEM, in terms of
differences in the SE yield as a function of the angle of incidence of primary
beam relative to sample surface normal as the local inclination of the sample
surface varies.
At high energy bombardment, a simple geometric model [29], which
assumes constant electronic stopping along the ion trajectory in the SE
Imaging using electrons and ion beams 105
escape depth and disregards scattering of the ion, leads us to a simple law in
the form
ðÞ
ð0Þ
¼ðcos Þ
1
; ð4:11Þ
which is called the ‘‘inverse cosine law’’; () and (0) are the SE yields at an
incident angle, measured from the surface normal and at normal incidence,
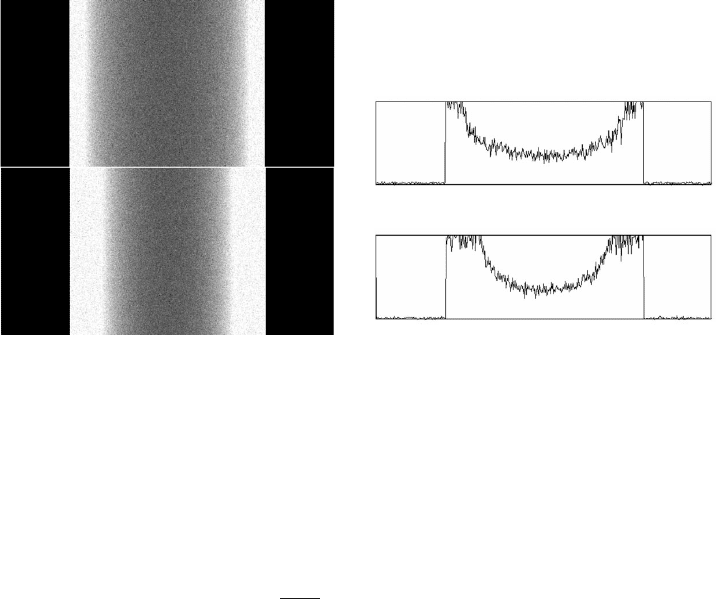
respectively. Figure 4.9 shows pseudo SE images calculated for a rod with a
circular cross section, assuming different incident-angle-dependences,
including the inverse cosine law [60]. Since the ‘‘inverse cosine’’ approaches to
infinity at grazing angles, the boundary between the rod and the background
is enhanced in the pseudo image. However, at the energy ranges of tens of
keV or less, due to the breakdown of the assumptions in the model, the
incident angle dependence of the SE yield largely deviates from the inverse
cosine law and varies complicatedly, depending on the ion energy and solid
materials.
A systematic investigation on the incident angle dependence of the SE yield
for various ion species and materials has been performed by means of Monte
Carlo calculations at wide energy range of 100 eV–1 MeV [61,62,63]. The
deviation from the inverse cosine law was represented by a fitting parameter f
to a modified form of (4.11) where the exponent of (–1) is replaced to (– f ). At
low energies, the ion energy loss within the SE escape depth contributes to
255.00
255.00
14.00
15.00
0
0
510
510
Pixels
Pixels
(a)
(b)
Figure 4.9 Reconstruction of pseudo SE images from the incident angle
dependence of SE yield, (), assuming (a) f ¼1 and (b) f ¼2 where
()/(0) ¼(cos )
f
[60]. Random noise at S/N ¼10 is artificially added
to each pixel intensity. The images intensities saturate artificially at the
intensity of 255.
Focused ion beam systems106
the incident angle dependence negatively ( f < 1). The negative ( f < 1) and
positive ( f > 1) effects of the backscattered ions on the incident angle
dependence can be apparently seen at low and intermediate energies,
respectively. The positive effect is due to the additional excitation of SEs near
the surface when the ion was backscattered, while the negative effect is due to
the appearance of the ions backscattered from the surface just after incidence
without excitation of SEs. When the incidence is inclined, the positive
(negative) effect is enhanced at intermediate (low) impact energy. At high
energy, however, the ( )/ (0) approaches the inverse cosine ( f ¼ 1), because
the backscattering coefficient becomes small as the impact energy increases.
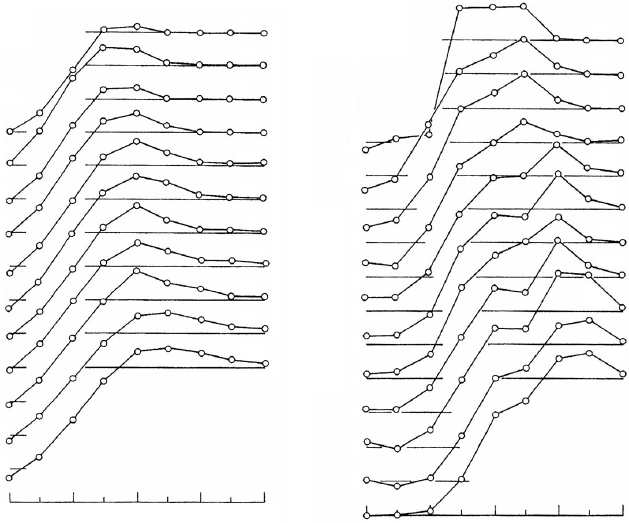
For light ion impacts, as well as electron impact in the SEM, the back-
scattering effects are a major reason for the deviation from the inverse cosine
law (Figures 4.10(a) and b).
For Ga ion impact, although the contribution of backscattered ions to
kinetic emission is negligible, a large number of fast recoiled atoms are
generated. The fast recoiled atoms impose the same effects on the incident
0.1
1
10
100
1000
Energy (keV)
0
0
0
0
0
0
0
0
0
0
0
0
0
0
0
0
0
0
0
0
0
0
Proton
Au
Ag
Mo
Ge
Cu
Fe
Ti
Si
Al
W
C
C
Al
Si
Ti
Fe
Cu
Ge
Mo
Ag
W
Au
0.1 1 10 100 1000
Ener
gy
(keV)
Fitting parameter, f
Fitting parameter, f
(b)
(a)
Electron
1
1
1
1
1
1
1
1
1
1
1
1
1
1
1
1
1
1
1
1
1
1
Figure 4.10 Calculated fitting parameter f in ()/(0) ¼(cos )
f
and
–()/–(0) ¼(cos )
f
as a function of energy (a) for proton impact and
(b) electron impac t, respectively, on different materials [61].
Imaging using electrons and ion beams 107