Hunefeldt C., Harris B. A Brief History of Peru
Подождите немного. Документ загружается.


Compañía de Seguros Rímac, the Compañía de Seguros Nacionales, and
Porvenir opened their doors between WWI and 1920.
One problem these large agrarian enterprises faced was shortage of
labor. The Chinese coolies were no longer available, and the indigenous
population in the highlands resisted migration to the coastal planta-
tions so completely different from their accustomed altitude and cli-
mate. Landowners thus resorted to coercive means to convince these
Indian peasants to work on their fields. They hired enganchadores, men
who visited peasant communities in the highlands and awaited a pr
oper
moment to hand a cash advance to peasants in need of money, such as
for community duties or religious and patron saint festivities. Such fes-
tivities required that the individuals involved not only take care of pro-
cessions and dressing the respective saint or virgin but also feed the
whole community. Often, this was only possible for the chosen indi-
viduals when they obtained extra cash. But once a peasant had accepted
money from an enganchador, he was obliged to work for a certain
amount of time on a coastal plantation to r
epay the loan. Landowners
and enganchadores made sure, however, that these individuals were
unable to r
epay the loan and were thus doomed to remain at the plan-
tation for extended periods of time. The primary mechanism used to
retain laborers was the estate-owned general store, where fraudulent
accounting assured that the initial debt would never be repaid. A more
stable and better-paid labor force emerged only gradually over the
course of the first decades in the 20th century. In the 1920s sugar and
cotton workers on Peru’s coastal plantations became the backbone of
very strong unions. In the 1930s these same laborers led to the forma-
tion of the Alliance for Popular Revolution in America (APRA) in con-
junction with a newly emerging leftist intellectual community.
The Southern Highlands
The region that suffered least from the War of the Pacific was the south-
ern highlands. Although Tarapacá and Arica on the southern coast suf-
fered the brunt of early fighting in the war, the highlands only saw
smaller skirmishes late in 1883, when the war was almost over. Cuzco,
Arequipa, and Puno surrendered to Chilean troops without resistance,
and collaborators helped Chilean officials establish control. The region
was affected by the war only indirectly when the blockade of the port
of Mollendo kept imported goods out of the south, eliminating compe-
tition with British textiles. As a result Arequipa, the center of southern
textile production, exported four times as much wool in 1884 than it
A BRIEF HISTORY OF PERU
164

165
THE WAR OF THE PACIFIC AND AFTER
had in the years preceding the war. Also, thousands of tons of food had
to be provided from this region to feed the armies.
As usual, Indians paid the bill. Not only were they expected to pro-
duce the crops and the wool, but they served as the soldiers and contin-
ued to pay tribute. The result was the strengthening of hacienda owners
and a new brand of local powerholders called gamonales. In the depart-
ments located at higher altitudes, such as Ar
equipa and Cuzco, where
there had been essentially no haciendas prior to the war, in the decades
after the war they multiplied into the hundreds. In Puno the number of
The Wool Trade
T
rade in wool produced in scattered regions was concentrated in
British-owned merchant houses in the city of Arequipa. William
Ricketts, a British immigrant to Peru in 1852, founded one such house in
1896. Ricketts invited the powerful British company Gibbs & Sons to
become his financial and commercial agent in Europe. Gibbs & Sons
opened an office in Arequipa and was able to secure a loan from the
Banco del Callao, owned by a Cuban financier, José Payán. Ricketts and
Gibbs & Sons planned to distribute goods imported from Europe
throughout Peru’s south, using the railway between Puno and Sicuani
(finished in 1891); however, they soon discovered that their potential
customers had little money and found themselves accepting wool
instead of money as payment for merchandise.This persuaded Ricketts
and his British counterparts there was an opportunity to profitably
export wool.
They quickly organized a large network of intermediaries to pur-
chase wool throughout the southern Andes. Next they established a
network of company agents near the wool production sites. These
employees bought wool in advance by providing producers with cred-
its of up to 75 percent of their expected wool production.The credit,
in turn, was handed out in the form of cash or purchase bills for the
imported goods from Europe that Gibbs & Sons provided. In more
remote areas the company’s agents traveled on muleback to buy wool
from peasants and to sell imported merchandise, transactions that
often involved bartering rather than purchasing. Often—as the repartos
in colonial times—peasants never really had money in their pockets.
Wool exports grew constantly throughout the final decades of the
19th century and the first decades of the 20th century, especially dur-
ing World War I (Based on Burga and Reátequi 1981).

haciendas rose from 705 to 3,219 between 1876 and 1915, and this
increase took place on former communal properties that had belonged
to the indigenous population. The basic mechanism used to expropriate
communal land was the advancement of money to purchase wool from
peasants. A predictable strategy based in paternalism and violence forced
Indians off their lands and reduced them to a servile relationship. It took
about 20 years before Indian peasants found the strength to resist
gamonalismo, and it was not until in the late 1950s that peasants mobi-
lized on a national scale.
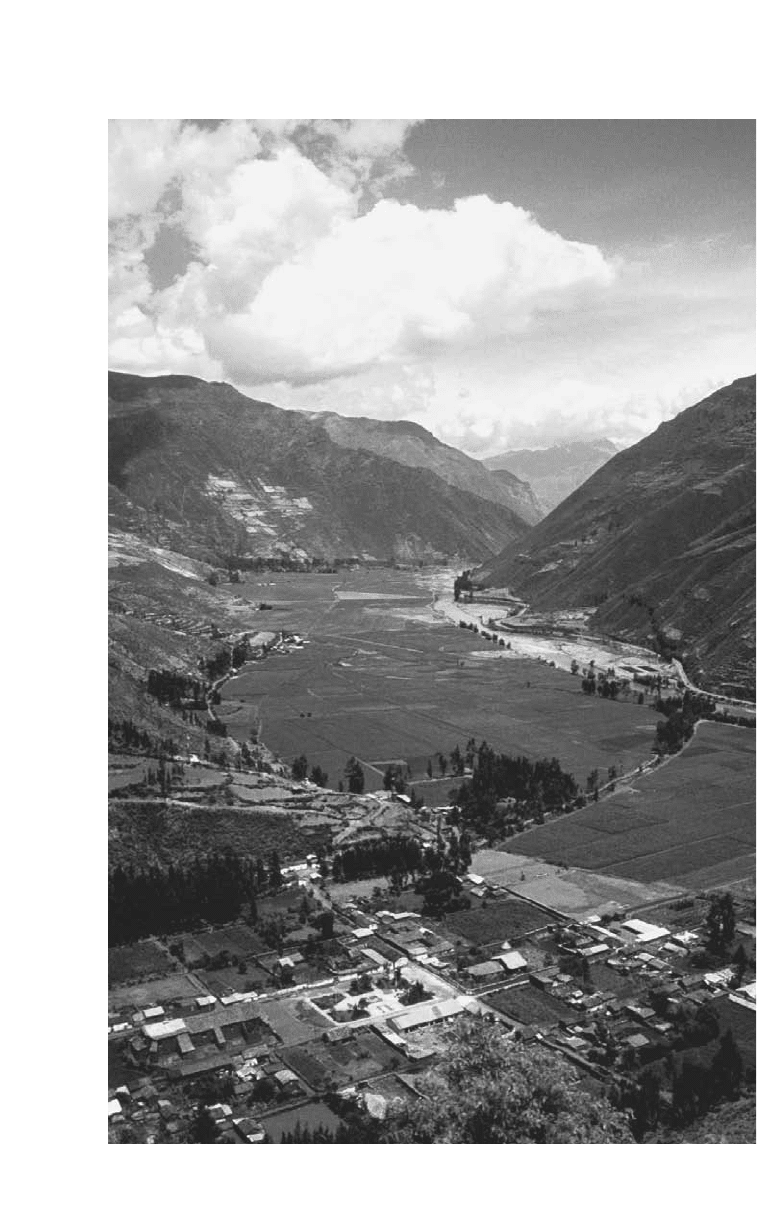
The Urubamba V
alley, near Cuzco, saw a peculiar kind of develop-
ment in the aftermath of the War of the Pacific. Commercial crops were
produced there as a result of colonization laws from 1898 and 1909 and
the expansion of the railroads to Urubamba. Haciendas with little capi-
tal or technology were the main production sites. Owners—comfortably
living in Cuzco—hired administrators to take care of their properties.
The produce from these haciendas provided a high standard of living to
owners and coca, sugar, coffee, tea, and other goods to people in Puno
and Bolivia. These were some of the few commercial crops that reached
what could be considered an internal market. When Indians from the
Machiguenga tribes successfully resisted becoming laborers on these
haciendas, the hacienda owners and local administrators established
colonies of imported highland peasants on nearby plots of land. This
strategy lowered the costs of labor, and the proximity of the labor force
allowed the owners control over these laborers. Colonizers would, in
turn, subcontract smaller portions of land to other peasants. Thus, the
colonized peasants fulfilled their work assignments with the hacienda
owners by drawing on peasants even humbler than themselves.
Cattle Raising and Exports
Large stretches of highland lands (from Cajamarca to Puno) were cattle-
raising areas. Beginning in the years after the War of the Pacific, and
more intensely toward the beginning of the 20th century, cattle produc-
ers imported breeding stock from Europe and provided Peru’s export
economy with hides, meat, milk, butter, and cheese. They also sent their
produce to feed the growing labor force on coastal plantations and cities.
Between 1905 and 1910, the larger cattle-producing haciendas, in
alliance with Lima-based capital providers, founded associations, or
sociedades, of cattle producers in Junín and the center of the country. In
1920 these or
ganizations held 46,000 acres and 90,000 acres of land,
respectively. In the Department of Pasco, the Eulogio Fernandini
A BRIEF HISTORY OF PERU
166
167
THE WAR OF THE PACIFIC AND AFTER
The Urubamba Valley (Photofrenetic/Alamy)

Agriculture and Cattle Enterprise, which also owned mines, amassed
more than 171,000 acres of land between 1903 and 1931. The concen-
tration of land followed patterns common to other enterprises, espe-
cially mining. After Peruvian owners modernized their properties and
invested in new technology and infrastructure, foreign enterprises
offered to buy their properties at what national owners considered very
good prices. Thus the Peruvian elite in a sense became less committed
to national interests.
Changes in the Amazon
In the 20th century booming electricity and automobile industries in
Europe and the United States, with their large-scale demand for rubber,
had the effect of ending the peaceful lives of the Amazonian tribes.
Rubber harvesting in Peru began at the end of the War of the Pacific
and witnessed a peak in the first decade of the 20th century. Rubber was
transported on Amazon rivers to the city of Iquitos, and from there to
European and U.S. markets. Smuggling was rampant, making it difficult
to quantify the amounts of rubber exported; however, it has been cal-
culated that by 1910 rubber exports amounted to about 30 percent of
total Peruvian exports.
Some owners of rubber fields were larger-than-life characters. They
dominated the region of the Ucayali River, and the Putumayo region
and amassed enormous fortunes in a very short time, spending their
money on luxury goods from Europe and Brazil. During the height of
the rubber boom, these regions grew so strong and powerful that Lima
was confronted with several separatist uprisings, initiated by profiting
elites in the Amazon. Through fiscal manipulation and military inter-
vention—it took an armed expedition a year to get to the site of one
rebellion—Lima’s government prevented the disintegration of Peruvian
territory.
Rubber harvesting not only depleted this resource but also brought
epidemics to the region and imposed harsh working conditions and
even enslavement on the native populations, resulting in the death of 80
percent of the indigenous peoples, especially along the Putumayo River.
The treatment of Indian workers by the Peruvian Amazon Company was
the cause of an international scandal between 1908 and 1912.
Rubber turned out to be another boom industry that disappeared as
quickly as it had appeared when British investors took Amazon rubber
seeds with them and found more profitable and secure resources in
their colonial plantations in Java and Borneo. The rubber boom ended
A BRIEF HISTORY OF PERU
168

around 1912 when Asian producers inundated the international market
and prices fell.
Another important crop from the Amazon basin was coffee. The
Peruvian Corporation, operating under the Grace Contract of 1889,
formed the Perene Colony, which was administered by a small group of
British employees and included an area of 202,000 acres called the
Valley of Chanchamayo, with its capital city at Tarma. The laborers
were Ashaninka Indians. The Peruvian government had hoped to turn
this region into a prosperous colonization project; however, declining
coffee prices in the international market frustrated such expectations.
From a global perspective, therefore, in the aftermath of the War of
the Pacific, Peru found itself more fragmented than before. Lima’s
importance grew, but the regions became weaker. Within the regions,
power also became more centralized, most markedly in the south,
where Arequipa came to dominate large areas that incorporated Puno,
Cuzco, Andahuaylas, and Apurimac and saw a dramatic increase of its
urban population. The locus of power became the coast, not the high-
lands, a tendency that continues to this day. Presently, one of every
three Peruvians lives in Lima. In 1876 it was one out of every 12.
The 1900 Generation
Paralleling these developments, a new group of intellectuals, small
merchants, and state bureaucrats began cracking open Peru’s still
rigid—almost feudal—social structure. Cultural and intellectual
endeavors at the turn of the century focused on how to achieve
progress, how to establish a legitimate political authority, and how to
achieve social integration. These groups were linked to prominent
educational institutions, such as the College of Education (Colegio de
Educandas) in Cuzco and the universities in Cuzco and Arequipa. It
was in these locations that indigenismo came into being, a movement
of socially oriented concerns, especially on behalf of Peru’
s Indians.
However important this movement was, there is little evidence of its
effecting change for Indians. One of the few initiatives taken was to
teach the Spanish language to them in order to lower illiteracy rates. It
had only partial success. By 1940 illiteracy rates were still as high as
58 percent, and one-third of Peru’s population did not speak Spanish.
In terms of literacy efforts, indigenous populations included a varied
set of Amazonian tribes who had been largely untouched by anything
happening in the country throughout the 19th century, and they cer-
tainly did not speak Spanish.
169
THE WAR OF THE PACIFIC AND AFTER

Intellectuals of this generation sought to study Peru’s society and his-
tory from a scientific point of view; they harbored anticlerical feelings,
and they largely criticized the negative sides of Hispanic colonization
and conquest. In their eyes Peruvians’ aversion to manual labor and a
culture inherited from Spain hampered ideas of equal opportunity and
the development of science and industry. They believed economic
progress could only be attained by political centralization.
A BRIEF HISTORY OF PERU
170

10
The Twentieth Century:
First Decades (1900–1929)
B
etween 1890 and 1930 Peru strengthened its ties to the interna-
tional market. These four decades were fundamentally outward-
looking, and Peru’s economy was export-oriented especially exporting
raw materials. In contrast to earlier decades, when guano and nitrate
had been the most important export products, during these later
decades Peru’s exports diversified. New regions in the country became
linked to the international market, and some old regions switched to
new export products following international prices and demands. The
need to look inside the country often came about only because the
internal market eventually offered opportunities to diversify exports, to
incorporate larger areas into commercial production, and to satisfy a
need for food for Peru’s growing urban and industrial population.
Socially and politically these decades were the golden years of Peru’s
export-based oligarchy. Only gradually, beginning in the early 1920s,
was oligarchic power undermined by the emergence of a middle class
made up of state employees, people in the armed forces, and commerce
and education workers and by the growing numbers of salaried work-
ers in rural and urban areas. Throughout the 1920s and 1930s these
new social groups formed their own political parties and developed
their own views about the country’s present and future and the role they
were to play in Peru’s development.
Often, such views came into conflict with what had been in place for
decades. New solutions for old concerns were debated through the
pages of a proliferating press. Cultural identity, political participation,
and the benefits or detriment of political decentralization were some of
the main issues of debate. Another topic was a matter that had gone
unresolved throughout the 19th century: Peru’s boundaries with its
neighbors—Bolivia, Ecuador, Colombia, Chile, and Brazil. In contrast
171

to earlier centuries, the 20th century witnessed a rapidly accelerating
population growth and an acceleration of the rural-to-urban migration,
which fueled this shift in power and focus.
Demographic Changes
Between 1876 and 1940 Peru’s population grew from 2.6 million to 6 mil-
lion people. Population growth was largely urban and coastal, whereas
population density in the highlands and the Amazon basin remained low.
In 1906 Alejandro Garland, a distinguished member of the Geographical
Society, calculated that population density in the highlands was higher
(4.78 inhabitants per square kilometer) than on the coast (4.53 per
square kilometer). The Amazon basin had the lowest urban concentra-
tion index at 0.39 per square kilometer. (One square kilometer equals
0.39 square mile.) But a massive rural-to-urban migration began in the
1920s causing a sharp regional shift. In 1940, 65 percent of Peru’s popu-
lation was rural; in 1970 this would drop to 30 percent.
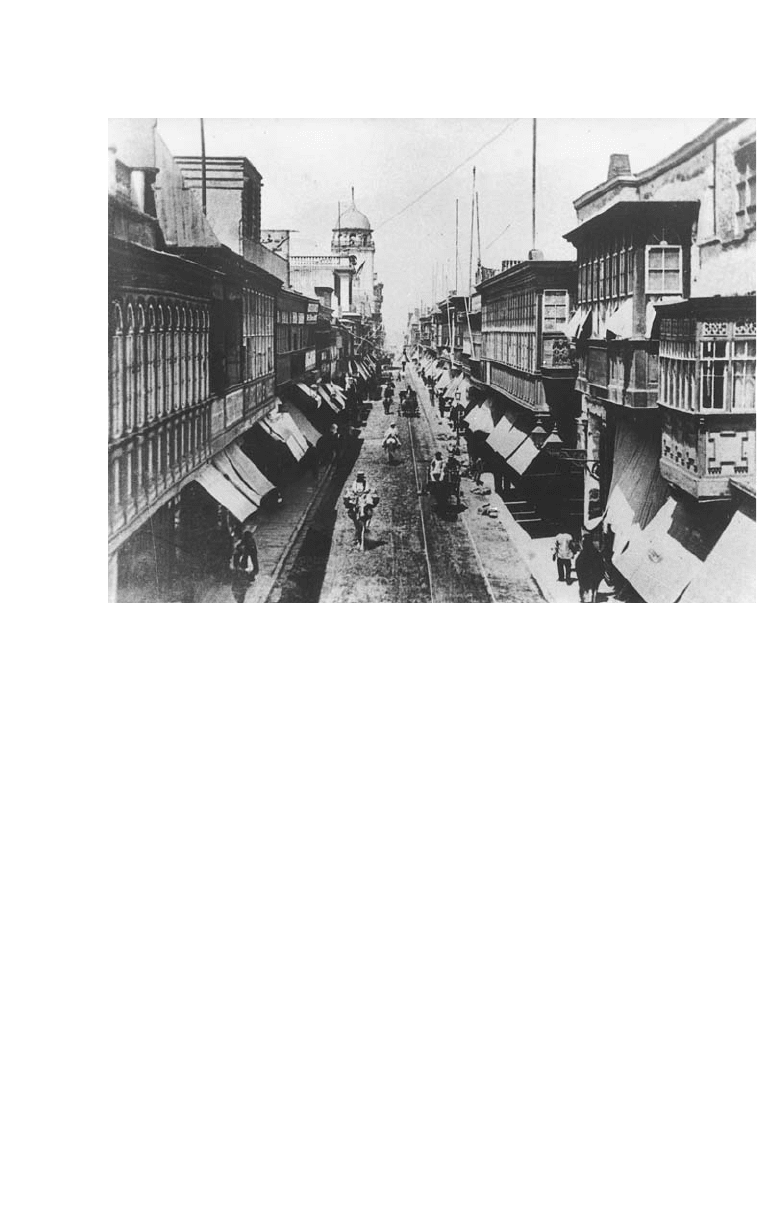
Lima grew from 114,788 inhabitants in 1890 to 172,927 in 1908. By
1908, 58.5 percent of limeños had not been born in Lima. The popula-
tion fur
ther increased to 223,807 in 1920, to 376,097 in 1931, and to
540,100 in 1940. Other cities also saw increases in population, espe-
cially Arequipa, Cuzco, and Trujillo. Most city dwellers, especially in
the smaller cities, lacked electricity and running water, and a single
telegraph often was the only connection to the outside world.
Administrative changes—especially the expansion of the state bureau-
cracy and a higher commitment to hygiene—and, even more impor-
tant, job opportunities in urban centers and political peace promoted
not only the natural growth of the population but also an internal
migration from Peru’s rural areas. The 1940 census registered in Lima
an even gender distribution (49.42 percent men, 50.58 percent women)
and a predominantly young population (50 percent of the population
was 19 years old or younger). The economically active population in
the country numbered 2.5 million people, of whom 62 percent worked
in agriculture or husbandry, 17.5 percent in industry, and 20.5 percent
in services. By 1940, 65 percent of Peru’s population spoke Spanish, and
many were bilingual in Spanish and Quechua.
The 1940 national census was Peru’s last census to register race. It
counted 52.89 percent whites and mestizos, 45.86 percent Indians, 0.47
percent blacks, 0.68 percent “yellows” (that is, Chinese or Japanese),
and a 0.10 percent of “undeclared” race. This racial count was a sur-
prise to many contemporaries. Only 10 years earlier Peru’s intellectuals
A BRIEF HISTORY OF PERU
172
173
THE TWENTIETH CENTURY: FIRST DECADES
were firmly convinced that Indians amounted to four-fifths of Peru’s
population. When the census counted less than half of Peru’s popula-
tion as Indians, it reflected not a changed composition of Peru’s racial
mix but a dramatic change of racial perception and self-perception. The
national debate about indigenismo had been based on the presumed
existence of an Indian majority; however
, by 1940 Peru had self-defined
itself as an essentially mestizo country.
Traditionally the terms Indian and peasant were almost synonyms.
Not all peasants were Indians, but most Indians were considered peas-
ants. Population pressur
e had exceeded the availability of land in Peru’s
highland provinces, and peasants migrated to nearby cities and to Lima.
With a declining rural population and an increasing urban population,
more former “Indian” peasants were being counted as mestizos, a ten-
dency that continues to this day.
In the decades between 1890 and 1940 Peru experienced what his-
torians commonly call a “demographic transition”; that is, the growth
of population created the conditions necessary for industrial develop-
ment. However, as the Peruvian case shows, demographic growth is
only one part of the story.
A street scene in Lima, around 1900. The capital city’s population grew rapidly during the first
decades of the 20th century.
(Christine Hunefeldt)