Yao N. Focused Ion Beam Systems: Basics and Applications
Подождите немного. Документ загружается.

stage is tilted and the cutting plane is viewed at an angle dictated by the
angular separation between the FIB and SEM column. The image data are
properly tilt compensated during the acquisition to correct for the geometric
tilt. The image data may also be adjusted using electronic beam shift during
the acquisition in order to compensate for the translational shift in the SEM
image. Automatic image registration is also part of data acquisition software.
Image processing may involve contrast enhancement, segmentation,
threshold operations, or any other combination of standard image processing
steps. For the results presented in this chapter image processing was not
extensive and consisted of contrast adjustment or pass filters to facilitate
transparency mapping. However, in future more sophisticated image pro-
cessing will likely be employed to develop quantitative metrology applica-
tions as the field of 3D FIB-SEM nanotomography continues to emerge.
A variety of commercial software and freeware is available to complete 3D
reconstructions that vary in sophistication and capability, including the
integrated Smart3D software. Reconstructions of the type depicted on the
following pages can be processed within one hour. The quality and ease of
data processing is strongly dependent upon the quality of the original image
data volume. Strong contrast and good signal intensity translate into an
easily processed and high quality data set.
6.7 High density quantitative FIB-SEM nanotomography results
A series of examples follow that demonstrate the application of FIB-SEM 3D
nanotomography including real-time data acquisition during the milling
process. There is an inherent challenge capturing the experience of a dynamic
process in the static format of a text. The reader should bear in mind that
one can interrogate the data interactively including the ability to rotate the
object freely, zoom in or out and even generate a ‘‘fly-through’’ path on the
region of interest. It is common to animate the final results for presentation
purposes.
6.7.1 FIB-SEM 3D reconstruction of a superconducting thin film
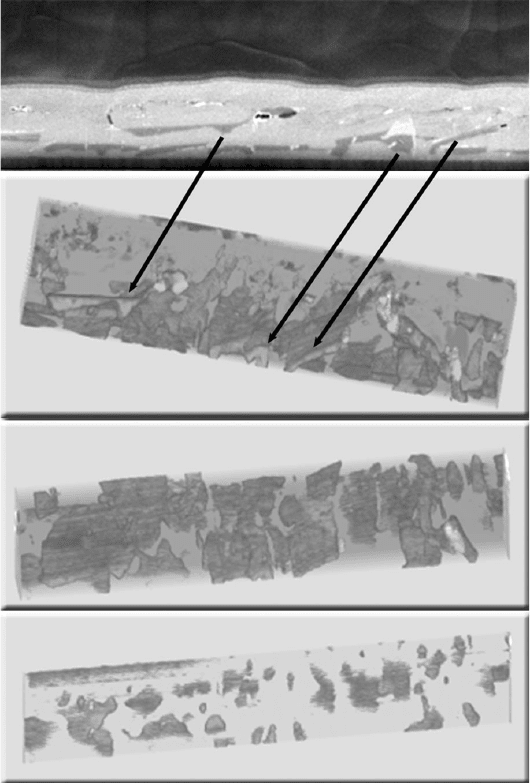
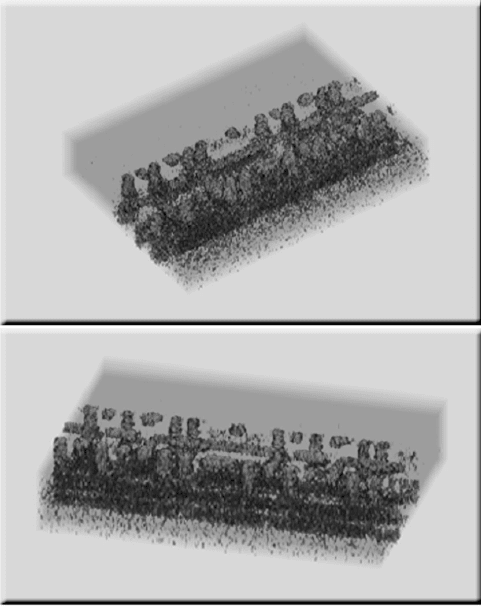
Figure 6.8 depicts a High-Tc superconductor thin film with second phases
(dark areas in cross section). The top panel is a frame from the original AVI
capture and the second panel is the volumetric reconstruction with selective
transparency applied to display only the second phase material. This example
demonstrates the ability to investigate a very complex and irregular structure.
Interpolative schemes are generally not necessary due to the high data density
Focused ion beam systems168
(a)
(b)
(c)
(d)
Figure 6.8 3D FIB-SEM nanotomographic reconstruction of a High-Tc
superconductor thin film with second phases (dark areas in cross section).
Panel (a) is a frame from the original AVI capture and the panel (b) depicts
the volumetric reconstruction with selective transparency applied to
highlight the second phase material. Common features in each image are
marked by the arrows. Panel (c) is a different view but also shows a different
section plane from the full transparen cy. The section plane is indicated by
the dashed marker. Panel (d) is a transparency section plane close to the
bottom of the reconstruction volume and highlights the nucleation density
of second phases along the interface. (Sample courtesy of Dean Miller and
Jon Hiller, Argonne National Laboratory.)
High-density FIB-SEM 3D nanotomography 169
and a user specified slice thickness in the typical range of 5–20 nm. The solid
reconstruction (no transparency applied) is not shown. In addition, it is
possible to ‘‘slice and dice’’ either the solid reconstruction or data with
applied transparency any way desired, allowing considerable freedom in the
analysis and study of the subject. This capability is illustrated through the
third and fourth panels of Figure 6.8 where the transparency data are taken
at two different x–z planes in the transparency. This particular example was
completed from 100 image frames and covered a distance of approximately
0.75 mminthey-axis direction.
Using the same live imaging techniques, method of quantification, and
equipment as described here a team of researchers have applied volumetric
analysis to a solid oxide fuel cell sample [16]. They applied the 3D recon-
struction to determine volumetric fractions of the material constituents and
porosity. In addition, with aid of an application specific code the lengths of
contiguous three phase boundaries in the volume and the connectivity of sub
phases were mapped in the first volumetric analysis of its kind. In this way
quantitative correlation of microstructure with electrochemical performance
was enabled via a quantitative FIB-SEM 3D reconstruction. This example
points to the potential of the technique and future directions and highlights
application of the method beyond visualization.
6.7.2 FIB-SE 3D reconstruction of a second phase in a stainless
steel heat affected zone
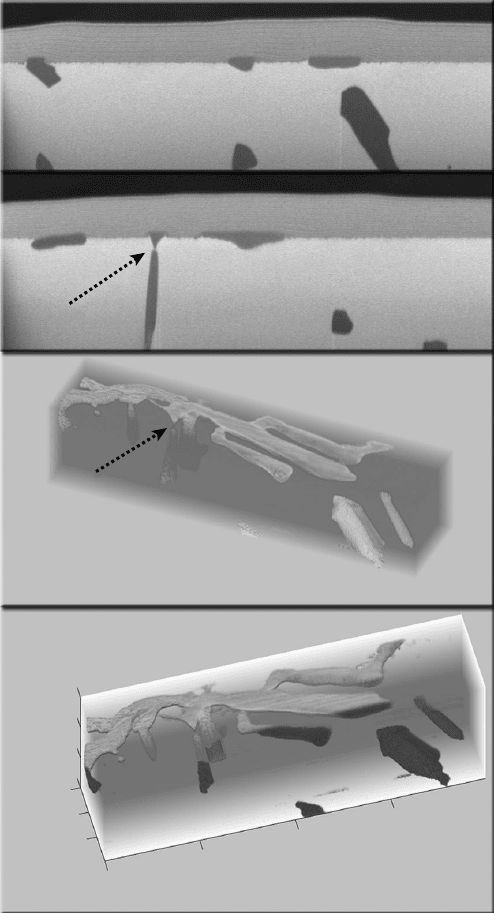
In Figure 6.9 the top two panels depict two images extracted from the ori-
ginal data stack. The precipitate phase is represented by the dark features in
the cross section and provided strong contrast relative to the bright intensity
of the matrix. The sample was embedded in epoxy and the top surface was
polished prior to FIB-SEM reconstruction. A platinum layer was deposited
on the surface to protect the portion of the structure at the surface. The
fiducial marks for quantification (not shown) were also etched into the pla-
tinum layer outside the field of view. Again, the FIB-SEM nanotomographic
reconstruction faithfully reproduces details in the original structure. The
reconstruction is 563 · 135 pixels and consists of 200 frames over a y-axis
linear dimension of approximately 1.4 mm to yield a 4 nm slice thickness
encompassing a volume of approximately 25 mm
3
. Growth, shape, and
nucleation parameters can thus be studied in three dimensions. Several data
sets were obtained from this material at different sections of the weld. The
different shapes and structures of the phases frozen into the material reflected
Focused ion beam systems170
(a)
(b)
(c)
(d)
1.4014
0.934267
0.467133
1.386
0
0
0.693
0
2.16755
4.3351
6.50265
x-microns
z-microns
y-microns
Figure 6.9 3D FIB-SEM reconst ruction with transparency applie d to
highlight phases formed in a heat affected zone of a stainless steel weld. The
top two images (a, b) are frames extracted from the original movie .
Reconstruction views are shown in (c) and (d). A common feature detail is
identified by the arrows. Axes units are micrometers in (d). (Sample courtesy
of Mahesh Chaturvedi, University of Manitoba.)
High-density FIB-SEM 3D nanotomography 171
the thermal histories from the various regions of the weld. Quantification of
all three axes has been applied to this volume, as shown in the fourth panel.
6.7.3. Stereolithographic printing of the second phase
in stainless steel HAZ
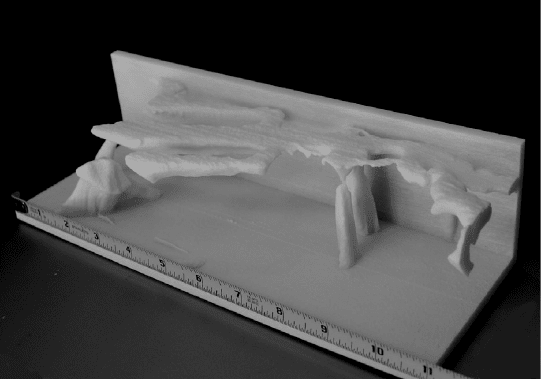
In cooperation with the State University of New York, Stony Brook
(SUNYSB) the first 3D stereolithographic print was produced from an
FIB-SEM 3D tomography dataset. The 3D model shown in Figure 6.10 was
produced from the data set shown in Figure 6.9. Originally approximately
10 mm in length the physical model measures over 25 cm to allow a virtual
nanoscale to macroscale conversion. Using a routine to convert the original
intensity matrix into a format compatible with the 3D printer (STL format)
it was a fairly straightforward process to produce a quantitative three-
dimensional solid model. Following a similar approach it is also possible to
scale replicate an object using the deposition capabilities within the CrossBeam.
Figure 6.10 The first 3D stereolithographic print of an FIB-SEM nanotomo-
graphic reconstruction. The original object dimension was less than 10 mm
across while the macroscale model of that original object is over 10 inches in
length and repres ents the same structure shown in Figure 6.9. The project to
convert one of the 3D nanotomography data sets into a stereolithography
format (STL) for printing was motivated by Dr. Jim Quinn at SUNY, Stony
Brook. Dr. Quinn produced the first examples in his laboratory, including
the one shown. The file translation routine into the STL format was
completed by Peter Sobol of Monona Analytical Services in Madison,
Wisconsin.
Focused ion beam systems172
Integral software on the CrossBeam platform allows the user to reslice the
3D reconstruction following data reduction and then rebuild the object at a
chosen scale layer by layer using any of the selected deposition materials,
including metals, oxides or carbon precursors. A potentially interesting
application of this technology is to scale replicate pattern templates using
FIB-SEM reconstructions produced from natural structures. Objects could
range from diatoms to the interlaced ladder-like structure of the cross section
from a butterfly’s wing. The stereolithographic 3D models also make lovely
bookends.
6.7.4 3D reconstruction of a multi-layer semiconductor device
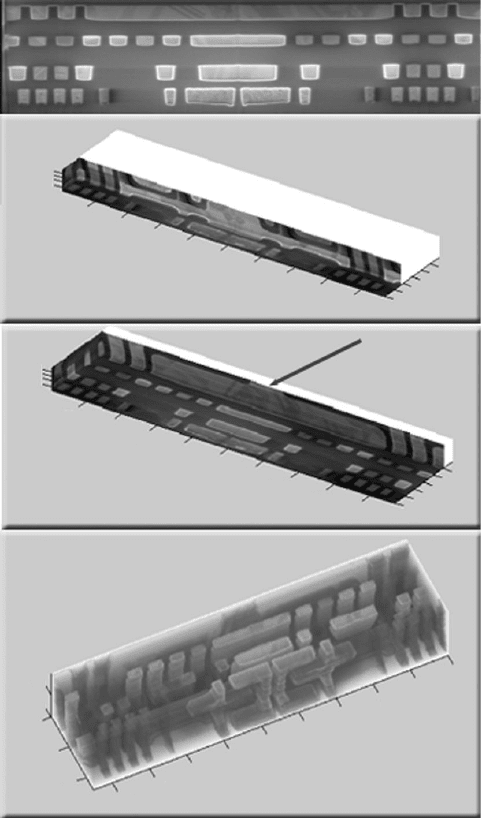
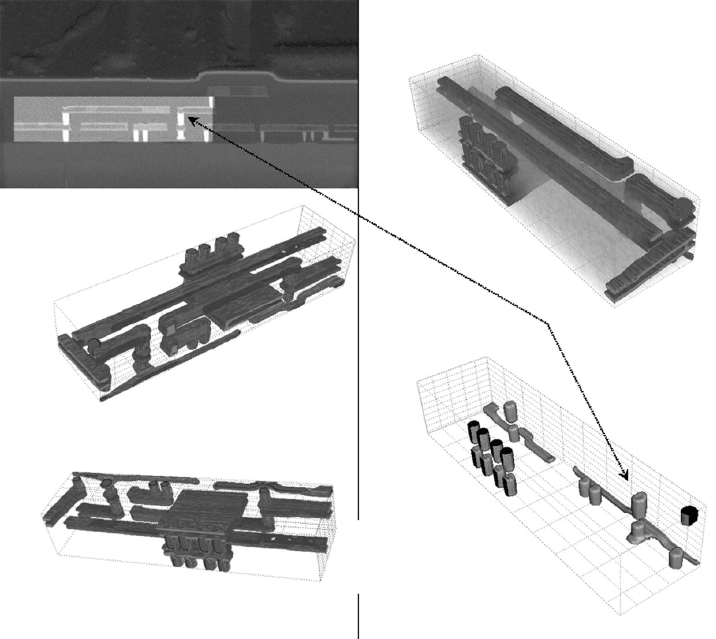
Figure 6.11 depicts a multi-layer semiconductor device with copper inter-
connects. The top panel is a cropped portion of a frame from the original
movie. Voltage contrast is apparent in the SEM image data where some
interconnects are bright while others are dark. Since these reconstructions
are intensity-based, the dark interconnects do not display clearly throughout
the selective transparency volume. Collection of a BSE image is one
approach to eliminate the voltage contrast when desired. The second and
third panels represent solid reconstructions depicting different section planes.
Recall that the top surfaces are planes perpendicular to the cutting plane.
Note the detail of the copper grain structure in the third panel highlighted by
the arrow. It is possible to trace the copper grain structure throughout the
volume.
FIB-EDS 3D reconstruction of a multi-layer semiconductor device
Figure 6.12 depicts an FIB-EDS reconstruction of the same device shown in
Figure 6.11. The information vector in this reconstruction is associated with
X-ray intensity data for the copper L line. These data were acquired at 5 kV
in order to excite the Cu
L
X-ray. The reconstruction is based upon 18 data
slices and has an inherently lower resolution than the FIB-SE data due to the
larger analytical volume associated with the X-ray signal at 5 kV. The key
benefit of FIB-EDS is the opportunity to combine high-resolution image data
with compositional information.
6.7.5 FIB-BSE 3D reconstruction using the in-lens EsB
backscatter detector
Figure 6.13 is an FIB-BSE nanotomographic reconstruction of a multi-layer
semiconductor device. Figure 6.13(a) shows a single frame from the image
High-density FIB-SEM 3D nanotomography 173
50
100
150
200
250
300
350
400
450
50
100
150
200
250
300
350
400
450
120
100
80
60
40
20
120
100
80
60
40
20
20
40
60
80
20
40
60
80
50
50
100
450
400
0
0
300
250
200
150
0
100
50
350
(a)
(b)
(c)
(d)
Figure 6.11 3D FIB-SEM reconstruction of a multi-layer semiconductor
device. Panel (a) is a cropped frame extracted from the original AVI movie.
Panels (b) and (c) are solid 3D reconstructions sectioned along different
planes and perpendicular to the FIB cutting plane. Note the detail in the
cross section, particularly in the panel (c), where the copper grains are
clearly visible (marked by the arrow). Note also the voltage contrast seen in
the image. Panel (d) presents the volume reconstruction with transparency
applied to highlight the copper interconnects. (Sample courtesy of Bernie
Levine, SUNY at Albany Nanotechnology Center, College of Nanoscale
Science & Engineering.)
Focused ion beam systems174
data stack showing the total cross section, which extends approximately
40 m m in width. The data set was collected using a 20 pA milling current
and acquired in less than 2 hours. The highlight area in Figure 6.13(a) is the
sub-volume from which the 3D reconstruction shown in Figure 6.13(b) and
(c) was generated. The 3D reconstruction data set consists of approximately
350 frames with a 15 nm slice thickness encompassing a volume of 22 m m ·
3.5 mm · 4 mminthex, y,andz-axes respectively. The data were acquired using
the in-lens backscatter (EsB) at a primary voltage of 0.8 kV. The brightest
contrast regions in the EsB image stack, such as the eight areas seen in Figure
6.13(a) correspond to the via material. The next brightest contrast is from the
metal interconnects and the lowest contrast level is from the interlayer
dielectric. In the reconstructions in Figure 6.13(b) and upper image in Figure
6.13(c) the via material is mapped to blue while the interconnects are mapped
to red. In Figure 6.13(b) transparency mapping is applied to remove the
(a)
(b)
Figu re 6.12 FIB-EDS reconst ruction of the struc ture sh own in Figure 6.11 .
Ori ginal EDS da ta maps were acqu ired by James Evertsen, SUNY at
Albany Nanotechnology Center using a PGT EDS spectrometer.
High-density FIB-SEM 3D nanotomography 175
interlayer dielectric completely. Upper panel in Figure 6. 13 (c) is a three color
composite with a lower degree of transparency applied to the dielectric (green)
to provide additional depth contrast. The view in the upper image of Figure
6.13(b) is at positive elevation viewed from the rear of the volume with respect
to the orientation in Figure 6.13(a) while the lower image is a negative ele-
vation view (bottom view) as seen from the front. The lower image in Figure
6.13(c) is the same view as the upper image in Figure 6.1 3( c ) r ep re se nt ed a s a n
isoclinic surface that maps the 204 intensity level from the 0–255 range in the
data and thereby shows exclusively the via material throughout the volume.
The image in Figure 6. 13 (a) represents a single plane of the data stack that
1000
2000
3000
4000
18
16
14
12
10
8
6
4
2
0
0
0.4
0.8
1.2
1.6
2
2.4
2.8
3.2
3.6
0
0
0.4
0.8
1.2
1.6
2
2.4
2.8
3.2
3.6
0
0
0.4
0.8
1.2
1.6
2
2.4
2.8
3.2
3.6
0
y (um)
y (um)
x (um)
z(nm)
3.6
3.2
2.8
2.4
2
1.6
1.2
0.8
0.4
0
18
16
14
12
10
8
6
4
2
0
0
1000
2000
3000
4000
x (um)
x (um)
x (um)
z (nm)
2
4
6
8
10
12
12
14
16
18
18
16
14
12
10
8
8
4
2
6
0
1000
2000
3000
4000
z (nm)
y (um)
y (um)
0
1000
2000
3000
4000
z (nm)
(a)
(b)
(c)
Figure 6.13 FIB-BSE 3D nanotomography of a multi-layer semiconductor
device using in-lens EsB detection. The backscatter image data stack was
captured using a primary voltage of 0.8 kV. The EsB detector produces
high-resolution z-contrast, which is favorable for separating different
materials in the 3D reconstruction while suppress ing voltage contrast and
edge enhanced contrast effects.
Focused ion beam systems176
bisects the approximate center of the eight via structures seen along the back
plane region of the isoclinic view in Figure 6. 13 (c ). T he a rr ows i de nt if y a
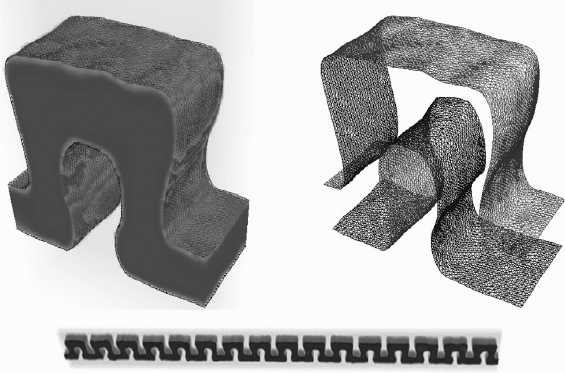
corresponding structure in each image. Figure 6.14 provides another example
of FIB-BSE reconstruction representing a BW of 65 nm dual damascene
structures. Various views in the figure illustrate that volume reconstructions
can be combined with a surface mesh mapped to specific intensity values.
6.7.6 FIB-EBSD
The EBSD technique is too rich in information and complexity to give a full
accounting in the scope of this text. A general overview is given to facilitate
presentation of the FIB-EBSD methodology and results. The interested reader
should consult references for further study [17]. In the EBSD technique an
incident electron beam forms an angle of approximately 20
with the sample
plane, as shown in Figure 6. 15 . The beam voltage is generally 15–20 kV to
obtain a properly scaled pattern. The glancing angle geometry of the electron
beam facilitates production of strong intensity electron channeling patterns
(commonly called electron backscatter diffraction patterns) which escape from
the near surface region of the sample. The projected patterns are captured onto
a phosphor screen. The EBSD pattern consists of multiple pairs of Kikuchi
lines. Each pair forms a Kikuchi band that corresponds to a specific plane
Figure 6.14 FIB-BSE 3D nanotomography example from a 65 nm node dual
damascene structure. Note that a volume reconstruction can be completed
by a surface mesh over the same region of interest. Several reconstructions
also can be combined from different sub-volumes within the same dataset.
High-density FIB-SEM 3D nanotomography 177